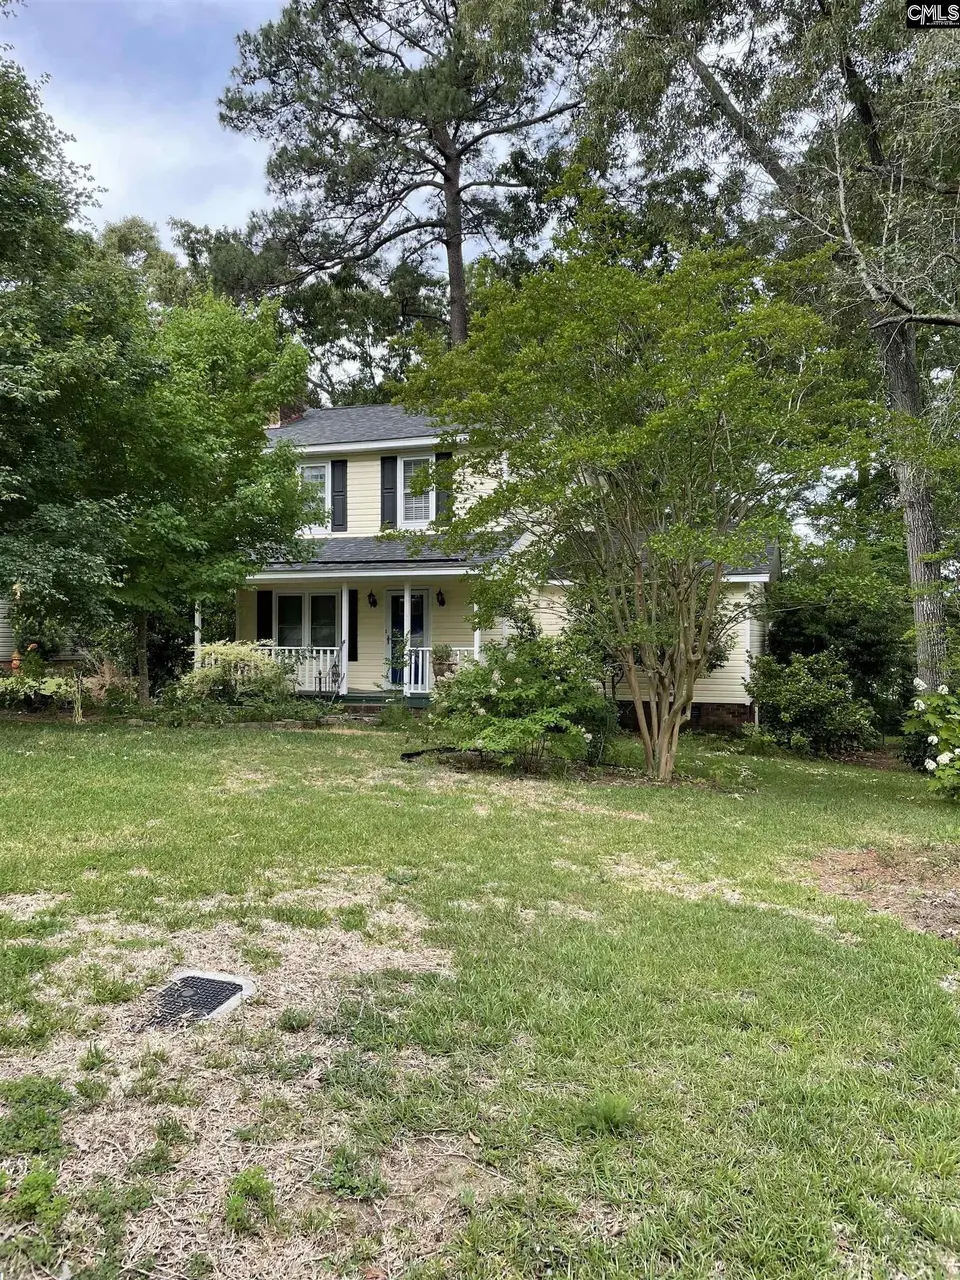
2029 Bedford Way · Capitol View, SC
Flood risk 1/10 · Minimal
- FEMA flood zone
- X (unshaded)
- Chance of flooding over 30 yrs
- 0.0%
- Est. flood insurance / yr
- $507 – $1,088
Fire risk 4/10 · Minor
- Est. fire insurance / yr
- $783 – $1,453
Heat risk 7/10 · Major
- Hot days now (above 108°F)
- 7 days/yr
- Hot days in 30 yrs
- 16 days/yr
Wind risk 7/10 · Major
- Chance of severe wind over 30 yrs
- 78.0%
Air-quality risk 3/10 · Minor
- Unhealthy air days now
- 2 days/yr
- Unhealthy air days in 30 yrs
- 2 days/yr
Risk factors via First Street. Map © Google.
Why this score? — see what drove the C- grade
The composite is a weighted blend of 9 inputs, each scored 0–100. Each bar is that input's sub-score; the figure is the points it added to the 100-point composite (weight × sub-score).
- Cash flow +18.4/30.0
- ARV discount +7.5/15.0
- DSCR +5.8/10.0
- Appreciation +5.0/10.0
- 1% rule +3.7/10.0
- Schools +2.6/10.0
- Rent growth +2.5/5.0
- Livability +2.5/5.0
- Condition / age +2.5/5.0
$195,000
🖨 Deal sheet (PDF) 📄 Offer letter ✓ Due diligence
Listing remarks
WELL ESTABLISHED NEIGHBORHOOD. MATURE PLANTINGS IN YARD. THIS 3 BEDROOM 2 BATH HOME IS A GREAT FIND. SPACIOUS EAT-IN KITCHEN, PANTRY, MASTER DOWNSTAIRS WITH PRIVATE BATH. FIREPLACE AND SHELVING IN FIVING ROOM. SPACIOUS BEDROOMS UPSTAIRS WITH SPACIOUS SHARED BATH. COVERED FRONT PORCH TO ENJOY THE YARD. SPACIOUS DECK IN BACK FOR GRILLING AND GATHERING. FENCED INBACKYARD WITH SHED AND STORAGE AREA. DOUBLE GATE TO ACCESS BACKYARD. HOME IS BEING SOLD AS-IS. Disclaimer: CMLS has not reviewed and, therefore, does not endorse vendors who may appear in listings.
Key facts
- Covered front porch
- Fenced in backyard
- 4,356 sq ft lot
Tags
Property features AI
Exterior
- Parking: Three parking spaces
- Security: Storm doors and storm windows
- Utilities: Public water; Public sewer
- Home design: 1.5-story home; House faces east; Vinyl exterior finish
- Construction: Crawlspace foundation
- Exterior features: Covered front porch; Rear deck; Yard shed; Rear chain-link fence
Interior
- Kitchen: Eat-in kitchen; Pantry; Solid-surface countertops; Painted cabinets; Tiled and other backsplash; Vinyl flooring; Disposal; Icemaker; Refrigerator; Free-standing, smooth-surface, self-cleaning range with exterior-vented exhaust
- Bedrooms: Primary bedroom on main level with private bath, walk-in closet, tub/shower, ceiling fan; Second bedroom on second level with shared bath, tub/shower, ceiling fan, private closet; Third bedroom on second level with shared bath, tub/shower, ceiling fan, private closet
- Flooring: Vinyl flooring in kitchen; Other flooring throughout (as noted)
- Bathrooms: Two full bathrooms; One main-level full bathroom
- Heating & cooling: Central heating and cooling; Heat pump serving first level
- Interior features: Attic storage with attic access; Ceiling fans throughout; Smoke detector; Built-ins; Fireplace with gas log-propane insert; Entertainment center; Molding
- Laundry & utility: Laundry on main level in heated space; Electric hookup for washer/dryer; Tankless water heater; Gas and electric water heaters
Neighborhood map
What this means for you Summary
Snapshot
- This is a 3-bed/2.0-bath single-family listed at $195k.
Deal economics
- At list price, monthly cash flow is $181 ($2k/yr) — positive.
- The deal already cash-flows at list — no discount required.
- To meet the 1% rule (rent ≥ 1% of price), the offer needs to be $170k (12.9% below list).
- Recommended offer: $170k (12.9% below list) — sets the bar for 1% rule.
Location & tenants
- Location reads: area grade C — affects rentability + tenant quality, not the cash-flow math above.
- Richland 01 (urban): math 26% / reading 36% proficiency, ranked #54 of 80 in SC (top 68%) — families likely to look elsewhere, expect single-tenant / working-renter base with shorter leases; 64% free/reduced lunch — lower-income household profile, screen leases tightly.
- Zoned schools: Caughman Road Elementary (math 22% / reading 27%, grade F, #452 of 597 statewide, top 78%, 707 students, 100% FRL); Lower Richland High (math 5% / reading 64%, grade F, #185 of 196 statewide, top 94%, 1,244 students, 100% FRL) — zoned schools average 100% FRL vs 64% district-wide (36 pts higher); higher-poverty schools than district average — tighter screening recommended.
- Market conditions: 1 active listings in the ZIP; 15 comparable units currently listed for rent nearby; rentals at typical pace (median 20d on market — plan ~3-4 weeks tenant-placement turnaround); 3,472 units permitted in Richland County in 2024 (1,096 in 5+ unit buildings).
Forward outlook
- In year one you build about $7k of equity ($1k loan paydown + $6k appreciation (3.0% local appreciation)).
- Richland County population projected at +30% by 2050 — long-run rental-demand tailwind backs the buy-and-hold thesis.
- At projected returns (3.0% appreciation + 3.0% rent growth), your $55k cash investment doubles in ~6 years — after that, you're playing with house money.
- By year 5, paydown + projected appreciation supports a ~$31k cash-out refi (75% LTV) — recoverable capital for the next deal without selling this one.
Negotiation context
- Only 12 days on market — expect competitive offers; lowballing is unlikely to land.
- Current owner paid $57k; list at $195k implies a 241% gain — meaningful room to come down on a strong offer.
Risks & watch-outs
- Climate carrying-cost: major wind risk, 78% chance of damaging wind over 30y; extreme-heat days projected 7→16/yr by 2055 (HVAC capex compounding) — expect insurance premiums to compound above CPI over the hold.
Questions for the listing agent
- Built in 1979 — when were the roof, HVAC, electrical panel, plumbing, and water heater last replaced?
- Is there a deadline driving the sale (1031 exchange, divorce, estate, relocation)? That informs how much negotiation room exists.
- What's the average days-on-market for RENTAL listings here right now (not sales)? A rising rental-DOM trend means longer vacancies and softer asking-rent achievability than the comps imply.
- What's the recent tenant-quality profile in this submarket — average credit score on applications, eviction rate, late-payment / NSF rate, and stable-employment percentage? A property-management company in the area should have these aggregated.
- How much new for-sale + rental construction is in the pipeline within 1–3 miles? Heavy new supply typically softens prices + rents 12–24 months out; constrained supply supports both.
Investment metrics
- 1% rule
- 0.87% ✗
- Cap rate
- 7.41%
- Cash-on-cash
- 3.98%
- DSCR
- 1.18
- GRM
- 9.6
CMA / ARV
No comps found within radius.
Projected returns pro-forma
3.0% appreciation · 3.0% rent growth · sell at horizon
- IRR
- 11.2%
- Equity multiple
- 1.64×
- Total profit
- $34,932
- Equity at exit
- $87,680
- IRR
- 13.3%
- Equity multiple
- 2.98×
- Total profit
- $108,102
- Equity at exit
- $135,126
Cash invested: $54,600 (down + closing). Projections, not guarantees.
Landlord ↔ Tenant lean methodology
- Overall (STATE)
- 90 Strongly Landlord-Friendly
- State South Carolina
- 90 Strongly Landlord-Friendly · R+6
- County
- — inherits STATE
- City
- — inherits STATE
ZIP-level market 29209-4145
- Active inventory
- 1
- Price-to-rent
- 9.6×
Monthly cashflow live
- Estimated rent
- $1,698 high interval (Pro) →
- Mortgage (P&I)
- −$1,023
- Tax from tax record
- −$56 /mo · $678/yr
- Insurance
- −$81
- HOA
- −$0
- Vacancy / Maint / Mgmt
- −$357
- Net cashflow
- $181
Break-even live
Sensitivity live
| Price | -10% $291 | -5% $236 | +0% $181 | +5% $126 | +10% $71 |
|---|---|---|---|---|---|
| Rent | -10% $47 | -5% $114 | +0% $181 | +5% $248 | +10% $315 |
| Rate | -1.0pp $279 | -0.5pp $231 | base $181 | +0.5pp $131 | +1.0pp $79 |
UW: 25.0% down · 7.5% · 30yr · 1.5% tax · 5.0% vac · 8.0% maint · 8.0% mgmt
Financing live
Cash to close
- Down payment
- $48,750
- Closing costs
- $5,850
- Reserves months
- —
- Total cash needed
- —
Loan-product check · same deal, 3 products live
Conventional
25% down · 7.5% · 30yr
- Down + closing
- —
- Monthly P&I
- —
- Monthly cashflow
- —
- DSCR
- —
- Eligible?
- —
Personal DTI + credit; lowest rate.
DSCR
20% down · 8.5% · 30yr
- Down + closing
- —
- Monthly P&I
- —
- Monthly cashflow
- —
- DSCR
- —
- Eligible?
- —
No personal income docs; deal must DSCR.
Hard money
10% down · 12.0% · 12mo
- Down + closing
- —
- Monthly P&I
- —
- Monthly cashflow
- —
- DSCR
- —
- Eligible?
- —
Short-term bridge; refi at stabilization.
Rent comps 15 comps
| Address | Beds | Baths | Sqft | Rent | $/sqft | DOM | Units | Dist |
|---|---|---|---|---|---|---|---|---|
| 2769 Prince Charles Ct Columbia, SC | 3.0 | 2.5 | 1617 | $1,850 | $1.14 | 12d | 1 | 0.41mi |
| 2705 Prince Charles Ct Columbia, SC | 4.0 | 2.0 | 1466 | $1,906 | $1.30 | 24d | 1 | 0.45mi |
| 3 Ashley's Pl Unit 04 Columbia, SC | 2.0 | 1.5 | 1100 | $995 | $0.90 | 24d | 1 | 0.54mi |
| 149 Moores Creek Dr Columbia, SC | 3.0 | 2.0 | 1600 | $2,069 | $1.29 | 15d | 1 | 0.58mi |
| 2011 Dominion Dr Columbia, SC | 3.0 | 2.0 | 1625 | $1,595 | $0.98 | 24d | 1 | 0.64mi |
| 1912 Dominion Dr Columbia, SC | 4.0 | 2.0 | 1614 | $2,300 | $1.43 | 24d | 1 | 0.73mi |
| 7712 Burdell Dr Columbia, SC | 3.0 | 1.0 | 1025 | $1,750 | $1.71 | 24d | 1 | 0.86mi |
| 1101 Hallbrook Dr Columbia, SC | 1.0–3.0 | 1.0–2.0 | 1050 | $1,229 | $1.17 | 15d | 1 | 0.96mi |
| 4022 Ulmer Rd Columbia, SC | 2.0–3.0 | 1.0–2.0 | 1202 | $1,322 | $1.10 | 20d | 1 | 1.03mi |
| 1727 Sandra Dr Columbia, SC | 4.0 | 2.5 | 1750 | $1,900 | $1.09 | 12d | 1 | 1.12mi |
| 457 Delahays Rd Columbia, SC | 3.0 | 2.0 | 1704 | $2,000 | $1.17 | 15d | 1 | 1.28mi |
| 164 Ashewood Commons Dr Columbia, SC | 2.0 | 2.0 | 1025 | $1,349 | $1.32 | 15d | 1 | 1.29mi |
| 440 Delahays Rd Columbia, SC | 3.0 | 2.5 | 1704 | $1,900 | $1.12 | 15d | 1 | 1.31mi |
| 7116 Tama Rd Columbia, SC | 3.0 | 1.0–1.5 | 600 | $1,225 | $2.04 | 24d | 1 | 1.36mi |
| 7524 Marie St Columbia, SC | 3.0 | 1.0 | 1075 | $1,350 | $1.26 | 22d | 1 | 1.37mi |
Listing history 3 events
-
2026-05-11$195,000 Active
-
1984-03-01soldstatus $57,189
-
1979-12-01soldstatus $44,500
ⓘ Source: listings_history table (triggers on properties + properties_extension) + one-shot
backfill from property_details.listing_events for pre-trigger history.
Tax reassessment forecast SC · Resets to sale price
- Current annual tax
- $678 · $56/mo
- Projected year-2 tax
- $1,112 · $93/mo
- Expected delta
- +$434/yr (+$36/mo · 63.9%)
ⓘ Screening estimate from a state-policy table — verify with the county assessor before closing.
Climate risk First Street
- Flood 1/10 Low FEMA zone X (unshaded) · 0% chance over 30 yrs
- Wildfire 4/10 Moderate
- Heat 7/10 Severe 7 d/yr ≥108°F today · 16 d/yr by 30 yrs out
- Wind 7/10 Severe 78% chance of damaging wind over 30 yrs
- Air quality 3/10 Moderate 2 unhealthy d/yr today · 2 by 30 yrs out
Nearby sold comps map
Loading sold comps map…
Walkable amenities ~0.75 mi
Loading nearby amenities…
Taxation est. · year 1
- Rental income
- $20,376
- − Mortgage interest
- −$10,923
- − Property taxes
- −$678
- − Insurance
- −$975
- − Repairs & maintenance
- −$1,630
- − Management
- −$1,630
- − Depreciation
- −$5,673
- Taxable loss
- −$1,133
- Est. tax savings @ 24.0%
- +$272
- After-tax cash flow
- $2,445/yr
For passive investors: Depreciation is non-cash, so a rental often shows a tax loss while cash-flowing — sheltering income. Rental losses are passive: they offset passive income freely, and up to $25,000/yr can offset ordinary (W-2) income if you actively participate and your MAGI is under $100k (phasing out to $0 by $150k); unused losses carry forward. On sale, claimed depreciation is recaptured at up to 25%, and gains may owe capital-gains tax (a 1031 exchange can defer both). Figures are a year-1 estimate at your 24.0% rate — not tax advice; consult a CPA.
Schools (NCES district)
- District
- Richland 01
- NCES district ID
- 4503360
- Math proficiency
- 26% ▼ -7.00%
- Reading proficiency
- 36% ▼ -5.00%
- Median HH income
- $38,931
- Composite
- 25.94/100
- National rank
- #7335
- State rank
- #54 of 80 in SC
Livability — Capitol View
No livability data for this city. (Only ~50 U.S. cities are tracked.)
Census & demographics
No demographic data for this ZIP.
Market trends
- HPI YoY
- —
- Current HPI
- —
- Rent YoY
- —
- Metro
- —
- State GDP YoY
- ▲ 4.51%
- F500 in state
- 2
Industry mix (Fortune 500 HQ in SC)
| Industry | F500 HQs | Revenue |
|---|---|---|
| Packaging | 1 | $7B |
|
||
Price history
+338.2% since first listed3 events — show timeline
- 2026-05-11 Listed $195,000 Consolidated MLS
- 1984-03-01 Sold (Public Records) $57,189 Public Records
- 1979-12-01 Sold (Public Records) $44,500 Public Records
Property tax history
+2.7%/yrLatest (2025): $678 · +4.0% YoY. Source: county tax records.
Cash-flow waterfall
monthlySold comps — $/sqft
last 12 mo · ≤1 miLoading sold comps…