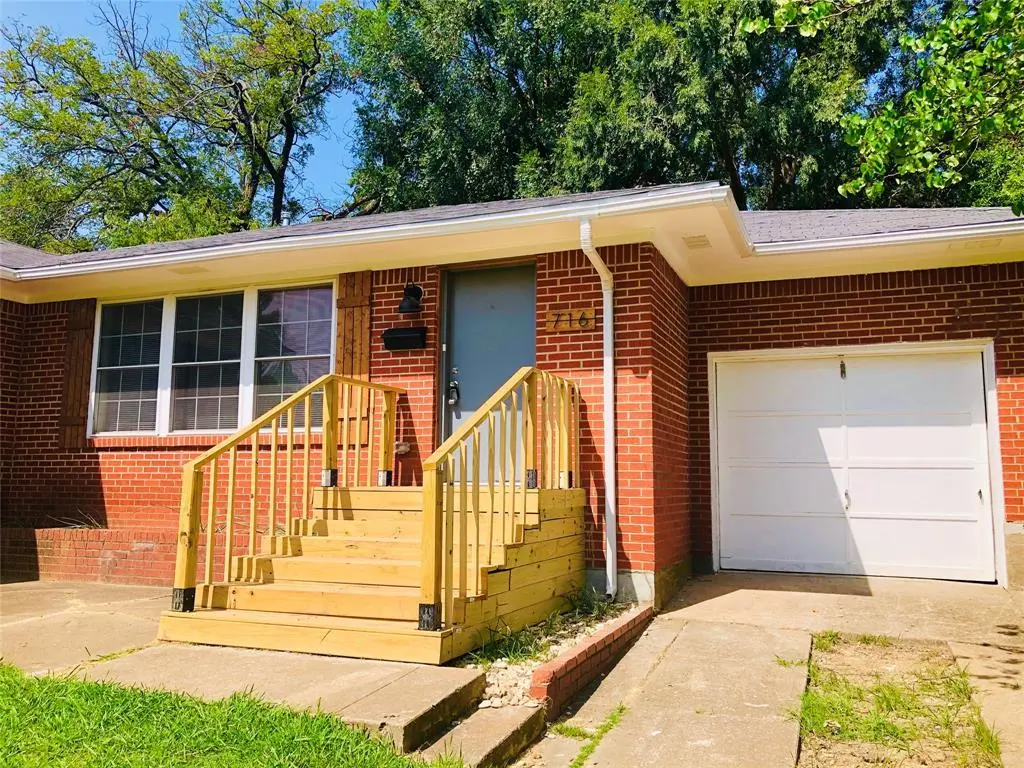
716 Kessler Blvd · Sherman, TX
Flood risk 1/10 · Minimal
- FEMA flood zone
- X (unshaded)
- Chance of flooding over 30 yrs
- 0.0%
- Est. flood insurance / yr
- $507 – $1,088
Fire risk 6/10 · Moderate
- Est. fire insurance / yr
- $1,222 – $2,270
Heat risk 6/10 · Moderate
- Hot days now (above 108°F)
- 7 days/yr
- Hot days in 30 yrs
- 22 days/yr
Wind risk 4/10 · Minor
- Chance of severe wind over 30 yrs
- 20.0%
Air-quality risk 3/10 · Minor
- Unhealthy air days now
- 2 days/yr
- Unhealthy air days in 30 yrs
- 3 days/yr
Risk factors via First Street. Map © Google.
Why this score? — see what drove the D grade
The composite is a weighted blend of 9 inputs, each scored 0–100. Each bar is that input's sub-score; the figure is the points it added to the 100-point composite (weight × sub-score).
- ARV discount +15.0/15.0
- Cash flow +10.4/30.0
- 1% rule +4.0/10.0
- Livability +3.1/5.0
- DSCR +3.0/10.0
- Schools +2.9/10.0
- Condition / age +2.5/5.0
- Rent growth +1.9/5.0
- Appreciation +0.0/10.0
$154,500
🖨 Deal sheet (PDF) 📄 Offer letter ✓ Due diligence
Listing remarks
Updated Brick move-in ready starter home in West Sherman, TX! This charming brick home sits on a quiet block west of Hwy 75 and boasts a complete renovation in 2020 with additional updates in 2024! The house is freshly painted and features the original hardwood floors, complemented by luxury vinyl plank in the kitchen. The updated kitchen includes butcher block countertops and stainless steel appliances. Additional features include a utility closet with washer dryer hookups, central HVAC, a one-car attached garage, and a fenced-in yard. The home also benefits from a new roof installed in 2023. Located just minutes from Hwy 75, restaurants, and shopping, this home is ideally situated for con
Key facts
- Central hvac
- Complete renovation
- Utility closet
Tags
Property features AI
Finance
- Other: Property listed as standard, for sale; Possession at closing/funding
- Financial info: Treat As Clear loan type; No second mortgage
- HOA & community: No association
Exterior
- Parking: Attached garage (1 garage space); 1 covered parking space
- Utilities: City water; City sewer; Municipal utility district: No
- Home design: Single family residence; Residential property; Built in 1950; One story
- Construction: Brick construction; Composition roof
- Exterior features: Lot under 1/2 acre (approx. 0.204 acre); Subdivision: Belaire Add
Interior
- Kitchen: Dishwasher; Disposal; Electric range; Microwave
- Bedrooms: 2 bedrooms (both on main level)
- Flooring: Vinyl flooring; Wood flooring
- Bathrooms: 1 full bathroom
- Heating & cooling: Central heating (natural gas); Central air (electric)
- Interior features: One-level layout; Other interior features; Living area approx. 1306
- Laundry & utility: Washer/dryer hookups (utility details not specified)
Neighborhood map
What this means for you Summary
Snapshot
- This is a 2-bed/1.0-bath single-family listed at $154k.
Deal economics
- At list price, monthly cash flow is $-83 ($-1k/yr) — negative.
- To cash-flow at today's rent, offer at most $140k (9.5% below list).
- To meet the 1% rule (rent ≥ 1% of price), the offer needs to be $139k (9.9% below list).
- Recommended offer: $139k (9.9% below list) — sets the bar for 1% rule.
- Cap rate 5.6% vs local median 3.7% in Sherman — top-decile yield for the area; either an underpriced asset or a hidden risk that comps aren't pricing in. Stress-test before assuming the spread holds.
Location & tenants
- Location reads 61/100 on livability (#1,027 in TX) — a middle-class / working-renter tenant base. Strengths: cost of living A+, housing A+; Watch: crime C-, employment C-, amenities F.
- Sherman ISD (urban): math 31% / reading 37% proficiency, ranked #546 of 826 in TX (top 66%) — families likely to look elsewhere, expect single-tenant / working-renter base with shorter leases.
- Zoned schools: Wakefield El (math 32% / reading 32%, grade F, #2,268 of 4,322 statewide, top 55%, 325 students, 98% FRL); Piner Middle (math 31% / reading 41%, grade F, #805 of 1,662 statewide, top 50%, 818 students, 75% FRL); Sherman H S (math 28% / reading 44%, grade F, #930 of 1,632 statewide, top 57%, 2,155 students, 70% FRL) — zoned schools average 81% FRL vs 60% district-wide (21 pts higher); higher-poverty schools than district average — tighter screening recommended.
- Market conditions: Rents soft (-2.4%/yr); 640 active listings in the ZIP; 40 comparable units currently listed for rent nearby; rentals lingering (median 46d on market — plan ~5-8 weeks vacancy on turnover, expect pricing pressure); 60% of comp listings sitting > 30 days — soft ceiling on asking rent; 2,272 units permitted in Grayson County in 2024 (750 in 5+ unit buildings).
Forward outlook
- Local home prices are declining (-3.0%/yr); year-one equity from $1k of loan paydown is wiped out by about $5k of value loss. Plan a longer hold.
- Grayson County population projected at +12% by 2050 — modest demand growth; plan on rents tracking national, not racing it.
Negotiation context
- It's been on market 62 days — a 6% lower offer ($145k) is reasonable based on typical stale-listing flexibility.
- 4 sale attempts since 2y ago with the ask held roughly flat each time — persistent listings suggest the price (not the market) is what's stuck; bring a comps-based counter.
Risks & watch-outs
- Watch-outs: built in 1950 — expect roof / HVAC / electrical / plumbing capex.
- Climate carrying-cost: major wildfire risk; extreme-heat days projected 7→22/yr by 2055 (HVAC capex compounding) — expect insurance premiums to compound above CPI over the hold.
Questions for the listing agent
- What do current leases actually rent for vs. the listed asking? Can we see a recent rent roll and the last 12 months of T-12 income?
- It's been on market 62 days. Have you received any prior offers? Is the seller open to a 10% concession, seller financing, or rate buy-down credit?
- Built in 1950 — when were the roof, HVAC, electrical panel, plumbing, and water heater last replaced?
- Why hasn't it sold? Are there any deal-killer items the seller is aware of (foundation, flood, title, zoning, code violations)?
- Is there a deadline driving the sale (1031 exchange, divorce, estate, relocation)? That informs how much negotiation room exists.
- Schools are D-rated, which usually means shorter tenancies and higher turnover. Who's the typical renter profile here, and what's been the actual vacancy rate?
- The area grade is low — what's the realistic commute time and amenity access for the typical tenant pool here? Any planned neighborhood developments (good or bad) we should know about?
- What's the average days-on-market for RENTAL listings here right now (not sales)? A rising rental-DOM trend means longer vacancies and softer asking-rent achievability than the comps imply.
- What's the recent tenant-quality profile in this submarket — average credit score on applications, eviction rate, late-payment / NSF rate, and stable-employment percentage? A property-management company in the area should have these aggregated.
- How much new for-sale + rental construction is in the pipeline within 1–3 miles? Heavy new supply typically softens prices + rents 12–24 months out; constrained supply supports both.
Investment metrics
- 1% rule
- 0.90% ✗
- Cap rate
- 5.65%
- Cash-on-cash
- -2.31%
- DSCR
- 0.90
- GRM
- 9.2
CMA / ARV
- ARV (median comp)
- $227,697
- List price
- $154,500
- Delta
- -32.15%
- Verdict
- UNDERPRICED
- Comps
- 20 within 1.0 mi
Show comp detail 12 sales within ~0.75 mi
| Address | Dist | Beds/Ba | Sqft | Sold | Price | $/sf | Match |
|---|---|---|---|---|---|---|---|
| 646 Denton Dr | 0.13mi | 3/1.5 (+1) | 1,191 (-9%) | 4mo | $199,900 | $168 | 69 |
| 1318 Kessler Blvd | 0.36mi | 2/2.0 | 1,224 (-6%) | 6mo | $224,800 | $184 | 64 |
| 900 W Sycamore St | 0.33mi | 3/1.0 (+1) | 1,140 (-13%) | 2mo | $160,000 | $140 | 57 |
| 1809 W Birge St | 0.66mi | 3/1.5 (+1) | 1,248 (-4%) | 2mo | $199,500 | $160 | 53 |
| 1003 Blanton Dr | 0.48mi | 3/2.0 (+1) | 1,221 (-6%) | 7mo | $209,740 | $172 | 52 |
| 904 N Woods St | 0.44mi | 3/2.0 (+1) | 1,468 (+12%) | 1mo | $219,999 | $150 | 49 |
| 1711 W Birge St | 0.59mi | 3/2.0 (+1) | 1,219 (-7%) | 7mo | $209,900 | $172 | 47 |
| 1006 N Grant Dr | 0.70mi | 3/2.0 (+1) | 1,210 (-7%) | 0mo | $235,000 | $194 | 46 |
| 1511 N Alexander St | 0.74mi | 3/2.0 (+1) | 1,414 (+8%) | 1mo | $282,500 | $200 | 42 |
| 1711 N Ricketts St | 0.74mi | 2/2.0 | 1,186 (-9%) | 6mo | $154,000 | $130 | 42 |
| 1808 W College St | 0.61mi | 3/2.0 (+1) | 1,121 (-14%) | 2mo | $125,000 | $112 | 37 |
| 116 S Bryant Ave | 0.57mi | 3/2.0 (+1) | 1,488 (+14%) | 7mo | $165,000 | $111 | 36 |
Match score weights: distance 35% · size 25% · config 20% · recency 20%. Top-matched comps best support the ARV.
Projected returns pro-forma
-3.0% appreciation · 0.0% rent growth · sell at horizon
- IRR
- -23.9%
- Equity multiple
- 0.21×
- Total profit
- $-34,329
- Equity at exit
- $23,036
- IRR
- -32.3%
- Equity multiple
- -0.20×
- Total profit
- $-52,119
- Equity at exit
- $13,358
Cash invested: $43,260 (down + closing). Projections, not guarantees.
Landlord ↔ Tenant lean methodology
- Overall (STATE)
- 87 Strongly Landlord-Friendly
- State Texas
- 87 Strongly Landlord-Friendly · R+5
- County
- — inherits STATE
- City
- — inherits STATE
ZIP-level market 75092
- Rents YoY
- -2.4%
- Active inventory
- 640
- Price-to-rent
- 9.2×
Monthly cashflow live
- Estimated rent
- $1,392 high interval (Pro) →
- Mortgage (P&I)
- −$810
- Tax from tax record
- −$308 /mo · $3,702/yr
- Insurance
- −$64
- HOA
- −$0
- Vacancy / Maint / Mgmt
- −$292
- Net cashflow
- $-83
Break-even live
Sensitivity live
| Price | -10% $4 | -5% $-40 | +0% $-83 | +5% $-127 | +10% $-171 |
|---|---|---|---|---|---|
| Rent | -10% $-193 | -5% $-138 | +0% $-83 | +5% $-28 | +10% $27 |
| Rate | -1.0pp $-6 | -0.5pp $-44 | base $-83 | +0.5pp $-123 | +1.0pp $-164 |
UW: 25.0% down · 7.5% · 30yr · 1.5% tax · 5.0% vac · 8.0% maint · 8.0% mgmt
Financing live
Cash to close
- Down payment
- $38,625
- Closing costs
- $4,635
- Reserves months
- —
- Total cash needed
- —
Loan-product check · same deal, 3 products live
Conventional
25% down · 7.5% · 30yr
- Down + closing
- —
- Monthly P&I
- —
- Monthly cashflow
- —
- DSCR
- —
- Eligible?
- —
Personal DTI + credit; lowest rate.
DSCR
20% down · 8.5% · 30yr
- Down + closing
- —
- Monthly P&I
- —
- Monthly cashflow
- —
- DSCR
- —
- Eligible?
- —
No personal income docs; deal must DSCR.
Hard money
10% down · 12.0% · 12mo
- Down + closing
- —
- Monthly P&I
- —
- Monthly cashflow
- —
- DSCR
- —
- Eligible?
- —
Short-term bridge; refi at stabilization.
Rent comps 40 comps
| Address | Beds | Baths | Sqft | Rent | $/sqft | DOM | Units | Dist |
|---|---|---|---|---|---|---|---|---|
| 930 W Freeman St Sherman, TX | 3.0 | 2.0 | 1222 | $1,499 | $1.23 | 23d | 1 | 0.26mi |
| 914 W Washington St Unit F Sherman, TX | 2.0 | 1.5 | 1287 | $1,165 | $0.91 | 45d | 1 | 0.29mi |
| 1402 Hillcrest Dr Sherman, TX | 3.0 | 1.5 | 1216 | $1,595 | $1.31 | 45d | 1 | 0.29mi |
| 1014 W Belden St Sherman, TX | 3.0 | 2.0 | 1573 | $1,599 | $1.02 | 23d | 1 | 0.36mi |
| 524-526 N Woods St Sherman, TX | 3.0 | 2.0 | 1454 | $1,445 | $0.99 | 45d | 1 | 0.38mi |
| 814 W College St Sherman, TX | 2.0 | 2.0 | 1100 | $1,150 | $1.05 | 45d | 1 | 0.39mi |
| 822 W Fischer St Sherman, TX | 3.0 | 1.0 | 1256 | $1,350 | $1.07 | 23d | 1 | 0.39mi |
| 324 Tolbert Ave Sherman, TX | 3.0 | 2.5 | 1700 | $1,650 | $0.97 | 45d | 1 | 0.41mi |
| 207 N Highland Ave Sherman, TX | 2.0 | 1.0 | 1175 | $1,300 | $1.11 | 45d | 1 | 0.42mi |
| 907 W Birge St Sherman, TX | 2.0 | 2.0 | 952 | $1,100 | $1.16 | 45d | 1 | 0.42mi |
| 214 N Ricketts St Sherman, TX | 3.0 | 2.0 | 1211 | $1,550 | $1.28 | 45d | 1 | 0.45mi |
| 820 N Sam Rayburn Fwy Unit 204 Sherman, TX | 2.0 | 1.5 | 1027 | $1,350 | $1.31 | 45d | 1 | 0.49mi |
| 106 N McKown Ave Sherman, TX | 2.0 | 1.0 | 1066 | $1,050 | $0.98 | 23d | 1 | 0.50mi |
| 103 S Highland Ave Sherman, TX | 3.0 | 3.0 | 1766 | $1,950 | $1.10 | 45d | 1 | 0.52mi |
| 1800 W Washington St Sherman, TX | 1.0–3.0 | 1.0–2.0 | 918 | $872 | $0.95 | 23d | 77 | 0.54mi |
| 1404 Park Pl Sherman, TX | 3.0 | 2.0 | 1150 | $1,400 | $1.22 | 45d | 1 | 0.55mi |
| 906 W Houston St Sherman, TX | 2.0 | 1.0 | 989 | $1,175 | $1.19 | 45d | 1 | 0.55mi |
| 908 W Houston St Sherman, TX | 2.0 | 1.0 | 989 | $1,299 | $1.31 | 23d | 1 | 0.55mi |
| 114 S Holly Ave Sherman, TX | 3.0 | 1.5 | 1440 | $1,195 | $0.83 | 45d | 1 | 0.57mi |
| 1505 Park Pl Sherman, TX | 3.0 | 2.0 | 1645 | $1,675 | $1.02 | 45d | 1 | 0.58mi |
| 817 W Lamar St Sherman, TX | 3.0 | 2.0 | 1074 | $1,495 | $1.39 | 45d | 1 | 0.62mi |
| 1712 W Birge St Sherman, TX | 3.0 | 2.0 | 1260 | $1,695 | $1.35 | 45d | 1 | 0.62mi |
| 221 Archer Dr Sherman, TX | 1.0–3.0 | 1.0–2.0 | 1000 | $1,124 | $1.12 | 23d | 9 | 0.64mi |
| 1920 W Shields Dr Sherman, TX | 1.0–2.0 | 1.0–2.0 | 800 | $1,150 | $1.44 | 23d | 2 | 0.65mi |
| 1200 W Taylor St Sherman, TX | 1.0–2.0 | 1.0–2.0 | 814 | $849 | $1.04 | 23d | 42 | 0.66mi |
| 1811 W College St Sherman, TX | 3.0 | 1.0 | 1150 | $1,395 | $1.21 | 45d | 1 | 0.67mi |
| 1706 N Ricketts St Sherman, TX | 3.0 | 2.0 | 1106 | $1,600 | $1.45 | 23d | 1 | 0.71mi |
| 1809 Park Pl Sherman, TX | 3.0 | 2.0 | 1326 | $1,425 | $1.07 | 23d | 1 | 0.71mi |
| 1811 Park Pl Sherman, TX | 3.0 | 2.0 | 1326 | $1,425 | $1.07 | 23d | 1 | 0.72mi |
| 1350 W Taylor St Sherman, TX | 1.0–3.0 | 1.0–2.0 | 1153 | $1,700 | $1.47 | 23d | 129 | 0.78mi |
| 815 N Travis St Sherman, TX | 3.0 | 2.0 | 1536 | $1,550 | $1.01 | 23d | 1 | 0.82mi |
| 1312 N Travis St Sherman, TX | 3.0 | 1.5 | 1086 | $1,325 | $1.22 | 45d | 1 | 0.82mi |
| 620 N Walnut St Sherman, TX | 2.0 | 1.0 | 1100 | $1,050 | $0.95 | 45d | 1 | 0.87mi |
| 2111 Wyldewood Way Sherman, TX | 3.0 | 2.0 | 1433 | $1,950 | $1.36 | 45d | 1 | 0.89mi |
| 1500 N Grant Dr Unit B Sherman, TX | 2.0 | 2.0 | 1256 | $1,250 | $1.00 | 45d | 1 | 0.94mi |
| 1500 N Grant Dr Unit A Sherman, TX | 3.0 | 2.0 | 1256 | $1,500 | $1.19 | 45d | 1 | 0.94mi |
| 1916 N Alexander St Sherman, TX | 3.0 | 2.0 | 1240 | $1,575 | $1.27 | 45d | 1 | 0.99mi |
| 823 N Branch St Sherman, TX | 3.0 | 2.0 | 1357 | $1,650 | $1.22 | 23d | 1 | 1.02mi |
| 110-112 W Fairview St Sherman, TX | 2.0 | 1.5 | 1200 | $1,200 | $1.00 | 45d | 1 | 1.02mi |
| 221 W Taylor St Sherman, TX | 3.0 | 2.0 | 917 | $1,425 | $1.55 | 23d | 1 | 1.04mi |
Listing history 50 events
-
2026-06-21days on market $154,500 Active 62 DOM
-
2026-06-19days on market $154,500 Active 60 DOM
-
2026-06-18days on market $154,500 Active 59 DOM
-
2026-06-17days on market $154,500 Active 58 DOM
-
2026-06-16days on market $154,500 Active 57 DOM
-
2026-06-15pricedays on market $154,500 Active 56 DOM
-
2026-06-14days on market $159,000 Active 54 DOM
-
2026-06-13days on market $159,000 Active 53 DOM
-
2026-06-10days on market $159,000 Active 51 DOM
-
2026-06-09days on market $159,000 Active 50 DOM
-
2026-06-08days on market $159,000 Active 49 DOM
-
2026-06-07days on market $159,000 Active 48 DOM
-
2026-06-03days on market $159,000 Active 44 DOM
-
2026-06-02days on market $159,000 Active 43 DOM
-
2026-06-01days on market $159,000 Active 42 DOM
-
2026-05-31days on market $159,000 Active 41 DOM
-
2026-05-30days on market $159,000 Active 40 DOM
-
2026-04-20$159,000 Active 720-char remark
-
2026-03-13historical
-
2026-02-24price $159,000
-
2026-02-16price $163,000
-
2026-01-28price $165,000
-
2026-01-27price $169,000
-
2026-01-12price $170,000
-
2026-01-01price $174,000
-
2025-12-18price $175,000
-
2025-11-08price $181,000
-
2025-10-29price $182,000
-
2025-10-14price $183,000
-
2025-09-30price $184,000
-
2025-09-23price $185,000
-
2025-09-13price $186,000
-
2025-09-04price $187,000
-
2025-08-26price $188,000
-
2025-08-18price $189,000
-
2025-08-11price $190,000
-
2025-07-21price $195,000
-
2025-06-30price $199,500
-
2025-06-20$204,900 Active
-
2025-06-20historical
-
2025-06-19price $204,900
-
2025-06-12price $205,900
-
2025-06-06price $206,900
-
2025-05-31price $207,900
-
2025-05-17price $208,900
-
2025-04-16price $209,900
-
2025-04-01price $214,900
-
2025-03-19price $219,900
-
2025-01-04price $225,000
-
2024-10-16price $227,000
ⓘ Source: listings_history table (triggers on properties + properties_extension) + one-shot
backfill from property_details.listing_events for pre-trigger history.
Tax reassessment forecast TX · Resets to sale price
- Current annual tax
- $3,702 · $308/mo
- Projected year-2 tax
- $3,702 · $308/mo
- Expected delta
- $0/yr ($0/mo · 0.0%)
ⓘ Screening estimate from a state-policy table — verify with the county assessor before closing.
Climate risk First Street
- Flood 1/10 Low FEMA zone X (unshaded) · 0% chance over 30 yrs
- Wildfire 6/10 Major
- Heat 6/10 Major 7 d/yr ≥108°F today · 22 d/yr by 30 yrs out
- Wind 4/10 Moderate 20% chance of damaging wind over 30 yrs
- Air quality 3/10 Moderate 2 unhealthy d/yr today · 3 by 30 yrs out
Nearby sold comps map
Loading sold comps map…
Walkable amenities ~0.75 mi
Loading nearby amenities…
Taxation est. · year 1
- Rental income
- $16,705
- − Mortgage interest
- −$8,654
- − Property taxes
- −$3,702
- − Insurance
- −$772
- − Repairs & maintenance
- −$1,336
- − Management
- −$1,336
- − Depreciation
- −$4,495
- Taxable loss
- −$3,591
- Est. tax savings @ 24.0%
- +$862
- After-tax cash flow
- $-138/yr
For passive investors: Depreciation is non-cash, so a rental often shows a tax loss while cash-flowing — sheltering income. Rental losses are passive: they offset passive income freely, and up to $25,000/yr can offset ordinary (W-2) income if you actively participate and your MAGI is under $100k (phasing out to $0 by $150k); unused losses carry forward. On sale, claimed depreciation is recaptured at up to 25%, and gains may owe capital-gains tax (a 1031 exchange can defer both). Figures are a year-1 estimate at your 24.0% rate — not tax advice; consult a CPA.
Schools (NCES district)
- District
- Sherman ISD
- NCES district ID
- 4840080
- Math proficiency
- 31% ▼ -9.00%
- Reading proficiency
- 37% ▼ -2.00%
- Median HH income
- $42,587
- Composite
- 28.79/100
- National rank
- #6665
- State rank
- #546 of 826 in TX
Livability — Sherman
- Score
- 61/100
- State rank
- #1027
- US rank
- #18243
Category grades
Schools grade is shown separately in the Schools card above.
Census & demographics
- Census place
- Sherman, TX
- County
- Grayson County · 108,053 people
- City population
- 54,936
- Metro
- Sherman-Denison, TX
- Population (ZIP)
- 28,342
- Household income
- $68,036
- Rent vs Own
- Severe rent burden
- 1278.0
Population outlook (Grayson County) Hauer SSP2
- Today (2025)
- 134,540 people
- By 2030
- 138,653 · +3.1%
- By 2040
- 145,958 · +8.5%
- By 2050
- 151,218 · +12.4%
- By 2075
- 161,802 · +20.3%
- By 2100
- 159,036 · +18.2%
Race, ethnicity, and origin ACS 2023
- Neighborhood character
- Predominantly White (77%)
- Race & ethnicity
- White 77% Hispanic / Latino 10% Two or more races 8% Black 6% Asian 3%
- Hispanic origin (detail)
- Mexican 8%
- Common ancestry
- Italian 3% Slovak 3% Lithuanian 2%
- Foreign-born
- 6% · Canada, South Korea
- Languages at home
- 92% English-only · Spanish 5% Other Indo-European 1%
Political lean MEDSL · Grayson
- 2024 margin
- Solid R (+54.3) · D 22.5% · R 76.7%
- 2008→2024 swing
- -16.4pp toward R · 2008: -37.9pp · 2024: -54.3pp
- All cycles
- 2024: R+54.3 2020: R+49.9 2016: R+53.1 2012: R+48.0 2008: R+37.9
Not yet ingested
- Civics
- —
Market trends
- HPI YoY
- ▼ -201.47%
- Current HPI
- 235.984
- Rent YoY
- ▼ -2.36%
- Metro
- Sherman-Denison, TX
- State GDP YoY
- ▲ 3.95%
- F500 in state
- 110
Industry mix (Fortune 500 HQ in TX)
| Industry | F500 HQs | Revenue |
|---|---|---|
| Energy | 16 | $1,198B |
|
||
| Technology | 5 | $198B |
|
||
| Engineering / Construction | 4 | $72B |
|
||
| Energy Services | 3 | $60B |
|
||
| Utilities | 3 | $41B |
|
||
| Healthcare | 2 | $330B |
|
||
Price history
+10346.2% since first listed40 events — show timeline
- 2026-06-15 Price Changed $154,500 NTREIS
- 2026-04-20 Listed $159,000 NTREIS
- 2026-03-13 Listing Removed — NTREIS
- 2026-02-24 Price Changed $159,000 NTREIS
- 2026-02-16 Price Changed $163,000 NTREIS
- 2026-01-28 Price Changed $165,000 NTREIS
- 2026-01-27 Price Changed $169,000 NTREIS
- 2026-01-12 Price Changed $170,000 NTREIS
- 2026-01-01 Price Changed $174,000 NTREIS
- 2025-12-18 Price Changed $175,000 NTREIS
- 2025-11-08 Price Changed $181,000 NTREIS
- 2025-10-29 Price Changed $182,000 NTREIS
- 2025-10-14 Price Changed $183,000 NTREIS
- 2025-09-30 Price Changed $184,000 NTREIS
- 2025-09-23 Price Changed $185,000 NTREIS
- 2025-09-13 Price Changed $186,000 NTREIS
- 2025-09-04 Price Changed $187,000 NTREIS
- 2025-08-26 Price Changed $188,000 NTREIS
- 2025-08-18 Price Changed $189,000 NTREIS
- 2025-08-11 Price Changed $190,000 NTREIS
- 2025-07-21 Price Changed $195,000 NTREIS
- 2025-06-30 Price Changed $199,500 NTREIS
- 2025-06-20 Listing Removed — NTREIS
- 2025-06-20 Listed $204,900 NTREIS
- 2025-06-19 Price Changed $204,900 NTREIS
- 2025-06-12 Price Changed $205,900 NTREIS
- 2025-06-06 Price Changed $206,900 NTREIS
- 2025-05-31 Price Changed $207,900 NTREIS
- 2025-05-17 Price Changed $208,900 NTREIS
- 2025-04-16 Price Changed $209,900 NTREIS
- 2025-04-01 Price Changed $214,900 NTREIS
- 2025-03-19 Price Changed $219,900 NTREIS
- 2025-01-04 Price Changed $225,000 NTREIS
- 2024-10-16 Price Changed $227,000 NTREIS
- 2024-08-27 Price Changed $229,000 NTREIS
- 2024-08-07 Listed $235,000 NTREIS
- 2024-04-17 Rental Removed $1,479 NTREIS
- 2024-04-04 Listed for Rent $1,479 NTREIS
- 2020-03-06 Sold (Public Records) — Public Records
- 1995-08-31 Sold (Public Records) — Public Records
Property tax history
+5.7%/yrLatest (2025): $3,702 · +4.6% YoY. Source: county tax records.
Cash-flow waterfall
monthlySold comps — $/sqft
last 12 mo · ≤1 miLoading sold comps…