10714 Red Shiner Run · San Antonio, TX
Flood risk No data
- FEMA flood zone
- —
- Chance of flooding over 30 yrs
- —
- Est. flood insurance / yr
- —
Fire risk No data
- Est. fire insurance / yr
- —
Heat risk No data
- Hot days now (above threshold)
- —
- Hot days in 30 yrs
- —
Wind risk No data
- Chance of severe wind over 30 yrs
- —
Air-quality risk No data
- Unhealthy air days now
- —
- Unhealthy air days in 30 yrs
- —
Risk factors via First Street. Map © Google.
Why this score? — see what drove the C- grade
The composite is a weighted blend of 9 inputs, each scored 0–100. Each bar is that input's sub-score; the figure is the points it added to the 100-point composite (weight × sub-score).
- Cash flow +11.9/30.0
- ARV discount +10.5/15.0
- Appreciation +10.0/10.0
- Condition / age +5.0/5.0
- Livability +4.0/5.0
- 1% rule +3.6/10.0
- DSCR +3.5/10.0
- Rent growth +2.7/5.0
- Schools +2.2/10.0
$220,499
🖨 Deal sheet 📄 Offer letter ✓ Due diligence
Listing remarks MLS
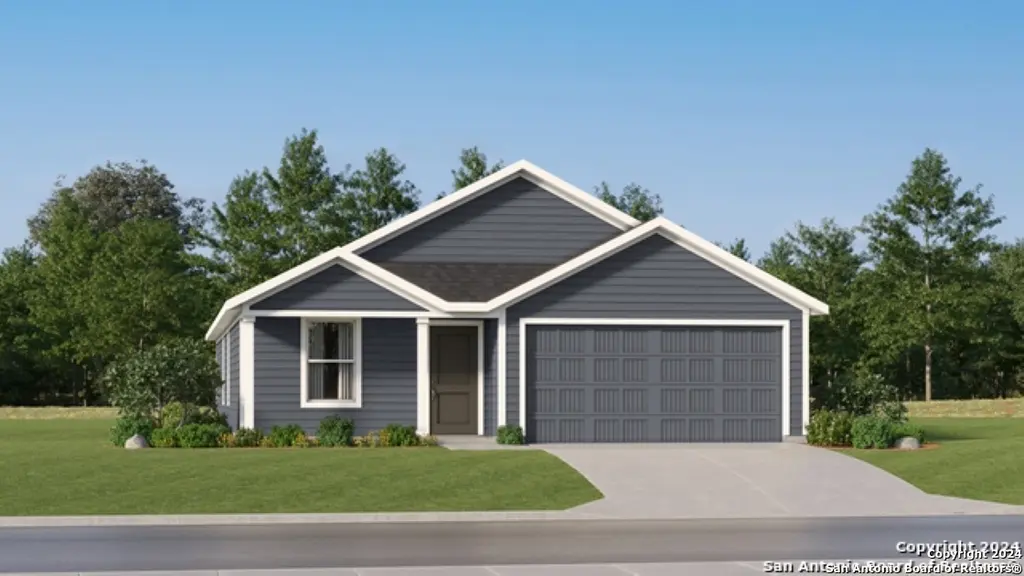
The Ramsey- This new single-story design makes smart use of the space available. At the front are all three secondary bedrooms arranged near a convenient full-sized bathroom. Down the foyer is a modern layout connecting a peninsula-style kitchen made for inspired meals, an intimate dining area and a family room ideal for gatherings. Tucked in a quiet corner is the owner's suite with an attached bathroom and walk-in closet. Estimated Completion June 2026. The completion date, prices and features may vary and are subject to change. Please verify with Lennar directly. Photos are for illustrative purposes only.
Key facts
- Intimate dining area
- Walk-in closet
- Single-story design
Tags
Neighborhood map
What this means for you Summary
Snapshot
- This is a 4-bed/2.0-bath single-family listed at $220k. Condition is rated excellent.
Deal economics
- At list price, monthly cash flow is $-58 ($-693/yr) — negative.
- To cash-flow at today's rent, offer at most $212k (3.8% below list).
- To meet the 1% rule (rent ≥ 1% of price), the offer needs to be $190k (13.9% below list).
- Recommended offer: $190k (13.9% below list) — sets the bar for 1% rule.
- Cap rate 6.0% vs local median 3.8% in San Antonio — top-decile yield for the area; either an underpriced asset or a hidden risk that comps aren't pricing in. Stress-test before assuming the spread holds.
Location & tenants
- Location reads 80/100 on livability (#31 in TX, #1,616 nationally) — a professional / high-income tenant draw. Strengths: amenities A+, commute A+, cost of living A+; Watch: schools C-, crime F.
- Southwest ISD (rural): math 21% / reading 31% proficiency, ranked #701 of 826 in TX (top 85%) — low school quality limits family demand, transient renter base, plan for 1-2y turnover; 75% free/reduced lunch — lower-income household profile, screen leases tightly.
- Market conditions: Rents flat; 274 active listings in the ZIP; 40 comparable units currently listed for rent nearby; rentals at typical pace (median 24d on market — plan ~3-4 weeks tenant-placement turnaround); 45% of comp listings sitting > 30 days — soft ceiling on asking rent; 8,308 units permitted in Bexar County in 2024 (2,506 in 5+ unit buildings).
- This rent runs 38% of the median local income ($60k/yr) — at the standard rent-burdened threshold; future hikes will face affordability resistance.
Forward outlook
- In year one you build about $24k of equity ($2k loan paydown + $22k appreciation (10.0% local appreciation)).
- Bexar County population projected at +50% by 2050 — long-run rental-demand tailwind backs the buy-and-hold thesis.
- At projected returns (10.0% appreciation + 0.8% rent growth), your $62k cash investment doubles in ~3 years — after that, you're playing with house money.
- By year 2, paydown + projected appreciation supports a ~$38k cash-out refi (75% LTV) — recoverable capital for the next deal without selling this one.
Negotiation context
- It's been on market 63 days — a 6% lower offer ($207k) is reasonable based on typical stale-listing flexibility.
Questions for the listing agent
- What do current leases actually rent for vs. the listed asking? Can we see a recent rent roll and the last 12 months of T-12 income?
- It's been on market 63 days. Have you received any prior offers? Is the seller open to a 14% concession, seller financing, or rate buy-down credit?
- What does the HOA fee cover, when was the last increase, and are there any pending special assessments or reserve-fund shortfalls?
- Why hasn't it sold? Are there any deal-killer items the seller is aware of (foundation, flood, title, zoning, code violations)?
- Is there a deadline driving the sale (1031 exchange, divorce, estate, relocation)? That informs how much negotiation room exists.
- Crime grade is F in this area — have there been break-ins, vandalism, or insurance claims at this property in the last 3 years? What carrier currently insures it and at what premium?
- What's the average days-on-market for RENTAL listings here right now (not sales)? A rising rental-DOM trend means longer vacancies and softer asking-rent achievability than the comps imply.
- What's the recent tenant-quality profile in this submarket — average credit score on applications, eviction rate, late-payment / NSF rate, and stable-employment percentage? A property-management company in the area should have these aggregated.
- How much new for-sale + rental construction is in the pipeline within 1–3 miles? Heavy new supply typically softens prices + rents 12–24 months out; constrained supply supports both.
Investment metrics
- 1% rule
- 0.86% ✗
- Cap rate
- 5.98%
- Cash-on-cash
- -1.12%
- DSCR
- 0.95
- GRM
- 9.7
CMA / ARV
- ARV (median comp)
- $235,999
- List price
- $220,499
- Delta
- -6.57%
- Verdict
- FAIR
- Comps
- 20 within 1.0 mi
Show comp detail 12 sales within ~0.75 mi
| Address | Dist | Beds/Ba | Sqft | Sold | Price | $/sf | Match |
|---|---|---|---|---|---|---|---|
| 10707 Red Shiner Run | 0.05mi | 4/2.0 | 1,676 (0%) | 1mo | $220,499 | $132 | 97 |
| 10711 Red Shiner Run | 0.05mi | 4/2.5 | 1,885 (+12%) | 1mo | $264,999 | $141 | 74 |
| 10703 Red Shiner Run | 0.06mi | 3/2.0 (-1) | 1,484 (-12%) | 1mo | $206,999 | $139 | 73 |
| 10714 Marlin Pond | 0.06mi | 3/2.0 (-1) | 1,484 (-12%) | 1mo | $226,999 | $153 | 73 |
| 1439 Leticia Gln | 0.45mi | 3/2.0 (-1) | 1,657 (-1%) | 1mo | $255,999 | $154 | 71 |
| 10843 Bernal Cv | 0.41mi | 4/2.0 | 1,575 (-6%) | 1mo | $223,999 | $142 | 70 |
| 10807 Bernal Cv | 0.41mi | 4/2.0 | 1,575 (-6%) | 1mo | $248,999 | $158 | 70 |
| 1427 Althea Bnd | 0.49mi | 3/2.0 (-1) | 1,657 (-1%) | 1mo | $240,999 | $145 | 69 |
| 1419 Althea Bnd | 0.51mi | 3/2.0 (-1) | 1,657 (-1%) | 1mo | $261,999 | $158 | 69 |
| 1435 Leticia Gln | 0.46mi | 4/3.0 | 1,795 (+7%) | 0mo | $267,999 | $149 | 62 |
| 10315 Bluegill Way | 0.26mi | 3/2.0 (-1) | 1,896 (+13%) | 1mo | $248,999 | $131 | 60 |
| 10826 Apple Pie Rd | 0.42mi | 4/2.5 | 1,900 (+13%) | 0mo | $312,851 | $165 | 56 |
Match score weights: distance 35% · size 25% · config 20% · recency 20%. Top-matched comps best support the ARV.
Projected returns pro-forma
10.0% appreciation · 0.83% rent growth · sell at horizon
- IRR
- 22.8%
- Equity multiple
- 2.82×
- Total profit
- $112,407
- Equity at exit
- $198,643
- IRR
- 19.9%
- Equity multiple
- 6.29×
- Total profit
- $326,487
- Equity at exit
- $428,381
Cash invested: $61,740 (down + closing). Projections, not guarantees.
Landlord ↔ Tenant lean methodology
- Overall (STATE)
- 87 Strongly Landlord-Friendly
- State Texas
- 87 Strongly Landlord-Friendly · R+5
- County
- — inherits STATE
- City
- — inherits STATE
ZIP-level market 78224
- Home prices YoY
- 12.4%
- Rents YoY
- 0.8%
- Active inventory
- 274
- Price-to-rent
- 9.7×
Monthly cashflow live
- Estimated rent
- $1,898 high interval (Pro) →
- Mortgage (P&I)
- −$1,156
- Tax est. 1.5%
- −$276 /mo · $3,307/yr
- Insurance
- −$92
- HOA
- −$33
- Vacancy / Maint / Mgmt
- −$398
- Net cashflow
- $-58
Break-even live
UW: 25.0% down · 7.5% · 30yr · 1.5% tax · 5.0% vac · 8.0% maint · 8.0% mgmt
Financing live
Cash to close
- Down payment
- $55,125
- Closing costs
- $6,615
- Reserves months
- —
- Total cash needed
- —
Loan-product check · same deal, 3 products live
Conventional
25% down · 7.5% · 30yr
- Down + closing
- —
- Monthly P&I
- —
- Monthly cashflow
- —
- DSCR
- —
- Eligible?
- —
Personal DTI + credit; lowest rate.
DSCR
20% down · 8.5% · 30yr
- Down + closing
- —
- Monthly P&I
- —
- Monthly cashflow
- —
- DSCR
- —
- Eligible?
- —
No personal income docs; deal must DSCR.
Hard money
10% down · 12.0% · 12mo
- Down + closing
- —
- Monthly P&I
- —
- Monthly cashflow
- —
- DSCR
- —
- Eligible?
- —
Short-term bridge; refi at stabilization.
Rent comps 40 comps
| Address | Beds | Baths | Sqft | Rent | $/sqft | DOM | Units | Dist |
|---|---|---|---|---|---|---|---|---|
| 10811 Soupe CV San Antonio, TX | 4.0 | 2.5 | 2173 | $1,995 | $0.92 | 2d | 1 | 0.18mi |
| 1347 Neria LOOP San Antonio, TX | 4.0 | 2.5 | 2173 | $1,699 | $0.78 | 43d | 1 | 0.18mi |
| 10723 Goose Way San Antonio, TX | 4.0 | 2.5 | 1917 | $1,785 | $0.93 | 43d | 1 | 0.19mi |
| 10523 Goose Way San Antonio, TX | 4.0 | 2.5 | 1917 | $1,785 | $0.93 | 43d | 1 | 0.20mi |
| 10710 Butterfly Pass San Antonio, TX | 4.0 | 2.5 | 1917 | $1,785 | $0.93 | 43d | 1 | 0.21mi |
| 10719 Butterfly Pass San Antonio, TX | 3.0 | 2.5 | 1645 | $1,640 | $1.00 | 43d | 1 | 0.24mi |
| 10723 Butterfly Pass San Antonio, TX | 4.0 | 2.5 | 1687 | $1,675 | $0.99 | 43d | 1 | 0.24mi |
| 10527 Hunters Pond San Antonio, TX | 4.0 | 2.5 | 1510 | $1,395 | $0.92 | 43d | 1 | 0.32mi |
| 2222 Fishing Trl San Antonio, TX | 4.0 | 2.5 | 1917 | $1,785 | $0.93 | 23d | 1 | 0.37mi |
| 2026 Bigmouth Rod San Antonio, TX | 4.0 | 2.5 | 1383 | $1,650 | $1.19 | 4d | 1 | 0.37mi |
| 1451 Neria Loop Unit 3 San Antonio, TX | 4.0 | 3.0 | 1867 | $700 | $0.37 | 12d | 1 | 0.38mi |
| 2226 Fishing Trl San Antonio, TX | 3.0 | 2.5 | 1777 | $1,650 | $0.93 | 23d | 1 | 0.38mi |
| 10807 Bernal Cv San Antonio, TX | 4.0 | 2.0 | 1575 | $1,700 | $1.08 | 16d | 1 | 0.39mi |
| 10823 Bernal Cv San Antonio, TX | 4.0 | 2.0 | 1600 | $2,000 | $1.25 | 1d | 1 | 0.39mi |
| 2230 Fishing Trl San Antonio, TX | 4.0 | 2.5 | 1847 | $1,755 | $0.95 | 23d | 1 | 0.39mi |
| 10815 Bernal Cv San Antonio, TX | 3.0 | 2.0 | 1266 | $1,550 | $1.22 | 23d | 1 | 0.39mi |
| 2107 Bigmouth Rod San Antonio, TX | 3.0 | 2.5 | 1777 | $1,675 | $0.94 | 43d | 1 | 0.41mi |
| 10507 Padron Bnd San Antonio, TX | 3.0 | 2.0 | 1266 | $1,600 | $1.26 | 43d | 1 | 0.41mi |
| 2111 Bigmouth Rod San Antonio, TX | 4.0 | 2.5 | 1917 | $1,700 | $0.89 | 43d | 1 | 0.42mi |
| 2115 Bigmouth Rod San Antonio, TX | 4.0 | 2.5 | 1847 | $1,755 | $0.95 | 43d | 1 | 0.42mi |
| 10611 Vesta Curv San Antonio, TX | 4.0 | 2.0 | 1627 | $1,735 | $1.07 | 4d | 1 | 0.42mi |
| 2242 Fishing Trl San Antonio, TX | 4.0 | 2.5 | 1917 | $1,785 | $0.93 | 43d | 1 | 0.42mi |
| 2235 Fishing Trl San Antonio, TX | 4.0 | 2.5 | 1847 | $1,755 | $0.95 | 43d | 1 | 0.42mi |
| 10210 S Zarzamora St San Antonio, TX | 2.0–4.0 | 2.0 | 1139 | $1,894 | $1.66 | 1d | 1 | 0.43mi |
| 10622 Vesta Curv San Antonio, TX | 4.0 | 2.0 | 1627 | $1,725 | $1.06 | 4d | 1 | 0.45mi |
| 10610 Apple Pie Rd San Antonio, TX | 3.0 | 2.5 | 1272 | $1,595 | $1.25 | 23d | 1 | 0.47mi |
| 1442 Mira Ml San Antonio, TX | 3.0 | 2.0 | 1266 | $1,545 | $1.22 | 43d | 1 | 0.48mi |
| 10542 Nye Pass San Antonio, TX | 3.0 | 2.0 | 1440 | $1,595 | $1.11 | 43d | 1 | 0.51mi |
| 2307 Applewhite Mdw San Antonio, TX | 4.0 | 2.5 | 1798 | $1,750 | $0.97 | 43d | 1 | 0.52mi |
| 1355 Neria Loop San Antonio, TX | 3.0 | 2.0 | 1266 | $1,575 | $1.24 | 43d | 1 | 0.52mi |
| 2318 Applewhite Mdw San Antonio, TX | 4.0 | 2.5 | 1798 | $1,795 | $1.00 | 23d | 1 | 0.53mi |
| 11327 Clearmine San Antonio, TX | 3.0 | 2.5 | 1362 | $1,650 | $1.21 | 1d | 2 | 0.53mi |
| 1407 Mira Ml San Antonio, TX | 4.0 | 2.0 | 1600 | $2,000 | $1.25 | 16d | 1 | 0.55mi |
| 1402 Bertha Br San Antonio, TX | 3.0 | 2.0 | 1276 | $1,700 | $1.33 | 23d | 1 | 0.56mi |
| 2335 Applewhite Mdw San Antonio, TX | 3.0 | 2.5 | 1529 | $1,550 | $1.01 | 4d | 1 | 0.57mi |
| 2330 Redlove Dr San Antonio, TX | 3.0 | 2.5 | 1420 | $1,600 | $1.13 | 4d | 1 | 0.57mi |
| 2350 Dry Moss Way San Antonio, TX | 3.0 | 2.5 | 1420 | $1,650 | $1.16 | 43d | 1 | 0.58mi |
| 2343 Applewhite Mdw San Antonio, TX | 4.0 | 2.5 | 1798 | $1,795 | $1.00 | 23d | 1 | 0.58mi |
| 10151 Asta Trl San Antonio, TX | 4.0 | 2.0 | 1625 | $1,650 | $1.02 | 12d | 1 | 0.59mi |
| 2350 Redlove Dr San Antonio, TX | 3.0 | 2.5 | 1420 | $1,675 | $1.18 | 23d | 1 | 0.61mi |
HOA detail
- Monthly dues
- $33 · $396/yr
Listing history 18 events
-
2026-06-18days on market $220,499 Active 63 DOM
-
2026-06-17days on market $220,499 Active 62 DOM
-
2026-06-16days on market $220,499 Active 61 DOM
-
2026-06-15days on market $220,499 Active 60 DOM
-
2026-06-13days on market $220,499 Active 58 DOM
-
2026-06-09days on market $220,499 Active 54 DOM
-
2026-06-08days on market $220,499 Active 53 DOM
-
2026-06-07days on market $220,499 Active 52 DOM
-
2026-06-04days on market $220,499 Active 49 DOM
-
2026-06-03days on market $220,499 Active 48 DOM
-
2026-06-02days on market $220,499 Active 47 DOM
-
2026-06-01days on market $220,499 Active 46 DOM
-
2026-05-31days on market $220,499 Active 45 DOM
-
2026-05-12price $220,499 614-char remark
Show marketing remark (614 chars)
The Ramsey- This new single-story design makes smart use of the space available. At the front are all three secondary bedrooms arranged near a convenient full-sized bathroom. Down the foyer is a modern layout connecting a peninsula-style kitchen made for inspired meals, an intimate dining area and a family room ideal for gatherings. Tucked in a quiet corner is the owner's suite with an attached bathroom and walk-in closet. Estimated Completion June 2026. The completion date, prices and features may vary and are subject to change. Please verify with Lennar directly. Photos are for illustrative purposes only.
-
2026-05-01price $219,999 614-char remark
Show marketing remark (614 chars)
The Ramsey- This new single-story design makes smart use of the space available. At the front are all three secondary bedrooms arranged near a convenient full-sized bathroom. Down the foyer is a modern layout connecting a peninsula-style kitchen made for inspired meals, an intimate dining area and a family room ideal for gatherings. Tucked in a quiet corner is the owner's suite with an attached bathroom and walk-in closet. Estimated Completion June 2026. The completion date, prices and features may vary and are subject to change. Please verify with Lennar directly. Photos are for illustrative purposes only.
-
2026-04-30price $225,999 614-char remark
Show marketing remark (614 chars)
The Ramsey- This new single-story design makes smart use of the space available. At the front are all three secondary bedrooms arranged near a convenient full-sized bathroom. Down the foyer is a modern layout connecting a peninsula-style kitchen made for inspired meals, an intimate dining area and a family room ideal for gatherings. Tucked in a quiet corner is the owner's suite with an attached bathroom and walk-in closet. Estimated Completion June 2026. The completion date, prices and features may vary and are subject to change. Please verify with Lennar directly. Photos are for illustrative purposes only.
-
2026-04-22price $233,999 614-char remark
Show marketing remark (614 chars)
The Ramsey- This new single-story design makes smart use of the space available. At the front are all three secondary bedrooms arranged near a convenient full-sized bathroom. Down the foyer is a modern layout connecting a peninsula-style kitchen made for inspired meals, an intimate dining area and a family room ideal for gatherings. Tucked in a quiet corner is the owner's suite with an attached bathroom and walk-in closet. Estimated Completion June 2026. The completion date, prices and features may vary and are subject to change. Please verify with Lennar directly. Photos are for illustrative purposes only.
-
2026-04-16$235,999 New 614-char remark
Show marketing remark (614 chars)
The Ramsey- This new single-story design makes smart use of the space available. At the front are all three secondary bedrooms arranged near a convenient full-sized bathroom. Down the foyer is a modern layout connecting a peninsula-style kitchen made for inspired meals, an intimate dining area and a family room ideal for gatherings. Tucked in a quiet corner is the owner's suite with an attached bathroom and walk-in closet. Estimated Completion June 2026. The completion date, prices and features may vary and are subject to change. Please verify with Lennar directly. Photos are for illustrative purposes only.
ⓘ Source: listings_history table (triggers on properties + properties_extension) + one-shot
backfill from property_details.listing_events for pre-trigger history.
Nearby sold comps map
Loading sold comps map…
Walkable amenities ~0.75 mi
Loading nearby amenities…
Taxation est. · year 1
- Rental income
- $22,771
- − Mortgage interest
- −$12,351
- − Property taxes
- −$3,307
- − Insurance
- −$1,102
- − Repairs & maintenance
- −$1,822
- − Management
- −$1,822
- − HOA
- −$396
- − Depreciation
- −$6,415
- Taxable loss
- −$4,444
- Est. tax savings @ 24.0%
- +$1,067
- After-tax cash flow
- $374/yr
For passive investors: Depreciation is non-cash, so a rental often shows a tax loss while cash-flowing — sheltering income. Rental losses are passive: they offset passive income freely, and up to $25,000/yr can offset ordinary (W-2) income if you actively participate and your MAGI is under $100k (phasing out to $0 by $150k); unused losses carry forward. On sale, claimed depreciation is recaptured at up to 25%, and gains may owe capital-gains tax (a 1031 exchange can defer both). Figures are a year-1 estimate at your 24.0% rate — not tax advice; consult a CPA.
Condition & rehab AI · 12 photos
This single-story home is move-in ready with excellent condition and modern design, making it an attractive option for both resale and rental markets.
Value-add opportunities
- Both Painting the exterior and interior walls — Fresh paint enhances curb appeal and interior aesthetics.
- Both Landscaping improvements — Enhanced landscaping can increase both resale and rental value.
- Both Adding smart home features — Smart home features can increase both resale and rental value by making the home more modern and convenient.
Renovation cost estimate screening
Value-add ROI direction
- Both Painting the exterior and interior walls — Fresh paint enhances curb appeal and interior aesthetics. ↑
- Both Landscaping improvements — Enhanced landscaping can increase both resale and rental value. ↑
- Both Adding smart home features — Smart home features can increase both resale and rental value by making the home more modern and convenient. ↑
ⓘ Cost ranges are severity-bucket heuristics (US national rule-of-thumb). Get contractor quotes + a written scope before underwriting a rehab budget.
Schools (NCES district)
- District
- Southwest ISD
- NCES district ID
- 4840950
- Math proficiency
- 21% ▼ -21.00%
- Reading proficiency
- 31% ▼ -5.00%
- Median HH income
- $43,362
- Composite
- 22.22/100
- National rank
- #8153
- State rank
- #701 of 826 in TX
Livability — San Antonio
- Score
- 80/100
- State rank
- #31
- US rank
- #1616
Category grades
Schools grade is shown separately in the Schools card above.
Census & demographics
- Census place
- San Antonio, TX
- County
- Bexar County · 1,990,555 people
- City population
- 1,806,925
- Metro
- San Antonio-New Braunfels, TX
- Population (ZIP)
- 22,232
- Household income
- $59,891
- Rent vs Own
- Severe rent burden
- 721.0
Population outlook (Bexar County) Hauer SSP2
- Today (2025)
- 2,336,851 people
- By 2030
- 2,560,728 · +9.6%
- By 2040
- 3,020,569 · +29.3%
- By 2050
- 3,493,522 · +49.5%
- By 2075
- 4,668,459 · +99.8%
- By 2100
- 5,533,242 · +136.8%
Race, ethnicity, and origin ACS 2023
- Neighborhood character
- Predominantly Hispanic (90%)
- Race & ethnicity
- Hispanic / Latino 90% Two or more races 24% White 6% Native American 2% Asian 2%
- Hispanic origin (detail)
- Mexican 75%
- Common ancestry
- Italian 1%
- Foreign-born
- 18% · Canada, Vietnam, China
- Languages at home
- 44% English-only · Spanish 55% Chinese 1%
Political lean MEDSL · Bexar
- 2024 margin
- Lean D (+9.8) · D 54.3% · R 44.6% · Other 1.1%
- 2008→2024 swing
- +4.2pp toward D · 2008: 5.6pp · 2024: 9.8pp
- All cycles
- 2024: D+9.8 2020: D+18.2 2016: D+13.5 2012: D+4.6 2008: D+5.6
Not yet ingested
- Civics
- —
Market trends
- HPI YoY
- ▲ 29.95%
- Current HPI
- 272.0709
- Rent YoY
- ▲ 0.83%
- Metro
- San Antonio-New Braunfels, TX
- State GDP YoY
- ▲ 3.95%
- F500 in state
- 110
Industry mix (Fortune 500 HQ in TX)
| Industry | F500 HQs | Revenue |
|---|---|---|
| Energy | 16 | $1,198B |
|
||
| Technology | 5 | $198B |
|
||
| Engineering / Construction | 4 | $72B |
|
||
| Energy Services | 3 | $60B |
|
||
| Utilities | 3 | $41B |
|
||
| Healthcare | 2 | $330B |
|
||
Price history
-6.6% since first listed5 events — show timeline
- 2026-05-12 Price Changed $220,499 LERA
- 2026-05-01 Price Changed $219,999 LERA
- 2026-04-30 Price Changed $225,999 LERA
- 2026-04-22 Price Changed $233,999 LERA
- 2026-04-16 Listed $235,999 LERA
Cash-flow waterfall
monthlySold comps — $/sqft
last 12 mo · ≤1 miLoading sold comps…