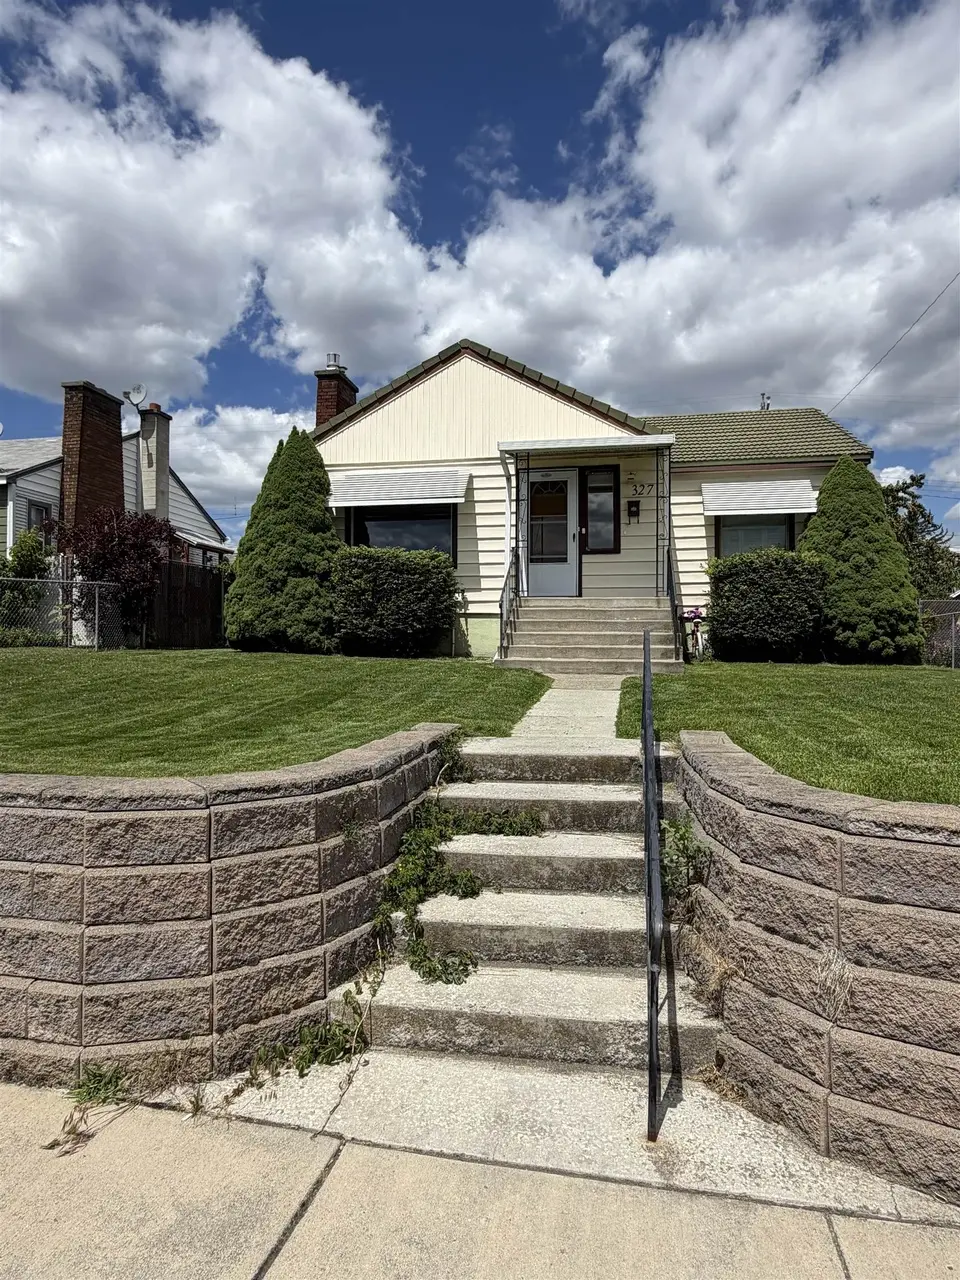
327 E Garland Ave · Spokane, WA
Flood risk 1/10 · Minimal
- FEMA flood zone
- X (unshaded)
- Chance of flooding over 30 yrs
- 0.0%
- Est. flood insurance / yr
- $473 – $860
Fire risk 1/10 · Minimal
- Est. fire insurance / yr
- $604 – $1,122
Heat risk 3/10 · Minor
- Hot days now (above 94°F)
- 7 days/yr
- Hot days in 30 yrs
- 15 days/yr
Wind risk 1/10 · Minimal
- Chance of severe wind over 30 yrs
- —
Air-quality risk 10/10 · Severe
- Unhealthy air days now
- 19 days/yr
- Unhealthy air days in 30 yrs
- 21 days/yr
Risk factors via First Street. Map © Google.
Why this score? — see what drove the D- grade
The composite is a weighted blend of 9 inputs, each scored 0–100. Each bar is that input's sub-score; the figure is the points it added to the 100-point composite (weight × sub-score).
- ARV discount +14.9/15.0
- Cash flow +5.6/30.0
- Schools +4.6/10.0
- Livability +4.0/5.0
- Rent growth +3.3/5.0
- Condition / age +2.5/5.0
- 1% rule +0.8/10.0
- DSCR +0.0/10.0
- Appreciation +0.0/10.0
$225,500
🖨 Deal sheet 📄 Offer letter ✓ Due diligence
Listing remarks
Investment opportunity in Spokane! This tucked-away 3-bedroom, 2-bath home offers strong potential for rental income or value-add improvements. Conveniently located near amenities, schools, and major routes, this property is ready for its next owner to unlock its full potential. Don't miss this chance to invest in a growing market.
Key facts
- 5,227 sq ft lot
- Garage
- Built 1948
Neighborhood map
What this means for you Summary
Snapshot
- This is a 2-bed/1.0-bath single-family listed at $226k.
Deal economics
- At list price, monthly cash flow is $-473 ($-6k/yr) — negative.
- To cash-flow at today's rent, offer at most $142k (37.0% below list).
- To meet the 1% rule (rent ≥ 1% of price), the offer needs to be $130k (42.2% below list).
- Recommended offer: $130k (42.2% below list) — sets the bar for 1% rule.
Location & tenants
- Location reads 80/100 on livability (#93 in WA, #1,822 nationally) — a professional / high-income tenant draw. Strengths: amenities A+, commute A+, housing A+; Watch: crime F.
- Spokane School District (urban): math 47% / reading 58% proficiency, ranked #136 of 291 in WA (top 47%) — acceptable for families but not a draw, mixed tenant base, ~2y average lease.
- Market conditions: Rents rising (+3.2%/yr); 236 active listings in the ZIP; 31 comparable units currently listed for rent nearby; rentals at typical pace (median 24d on market — plan ~3-4 weeks tenant-placement turnaround); 3,608 units permitted in Spokane County in 2024 (1,792 in 5+ unit buildings).
Forward outlook
- Local home prices are declining (-3.0%/yr); year-one equity from $2k of loan paydown is wiped out by about $7k of value loss. Plan a longer hold.
- Spokane County population projected at +13% by 2050 — modest demand growth; plan on rents tracking national, not racing it.
Negotiation context
- Only 0 days on market — expect competitive offers; lowballing is unlikely to land.
- Current owner paid $138k; list at $226k implies a 63% gain — meaningful room to come down on a strong offer.
Risks & watch-outs
- Watch-outs: built in 1948 — expect roof / HVAC / electrical / plumbing capex.
Questions for the listing agent
- What do current leases actually rent for vs. the listed asking? Can we see a recent rent roll and the last 12 months of T-12 income?
- Built in 1948 — when were the roof, HVAC, electrical panel, plumbing, and water heater last replaced?
- Is there a deadline driving the sale (1031 exchange, divorce, estate, relocation)? That informs how much negotiation room exists.
- Schools are B-rated — typically a magnet for longer-tenancy family renters. What's the average tenant stay here, and is there a school-zone premium baked into asking?
- Crime grade is F in this area — have there been break-ins, vandalism, or insurance claims at this property in the last 3 years? What carrier currently insures it and at what premium?
- The area grade is low — what's the realistic commute time and amenity access for the typical tenant pool here? Any planned neighborhood developments (good or bad) we should know about?
- What's the average days-on-market for RENTAL listings here right now (not sales)? A rising rental-DOM trend means longer vacancies and softer asking-rent achievability than the comps imply.
- What's the recent tenant-quality profile in this submarket — average credit score on applications, eviction rate, late-payment / NSF rate, and stable-employment percentage? A property-management company in the area should have these aggregated.
- How much new for-sale + rental construction is in the pipeline within 1–3 miles? Heavy new supply typically softens prices + rents 12–24 months out; constrained supply supports both.
Investment metrics
- 1% rule
- 0.58% ✗
- Cap rate
- 3.78%
- Cash-on-cash
- -8.98%
- DSCR
- 0.60
- GRM
- 14.4
CMA / ARV
- ARV (on-the-fly)
- $269,988
- Comps found
- 12
Show comp detail 12 sales within ~0.75 mi
| Address | Dist | Beds/Ba | Sqft | Sold | Price | $/sf | Match |
|---|---|---|---|---|---|---|---|
| 3919 N Washington St | 0.63mi | 2/1.0 | 892 (-0%) | 2mo | $290,000 | $325 | 68 |
| 222 E Hoffman Ave | 0.40mi | 2/1.0 | 984 (+10%) | 3mo | $250,000 | $254 | 62 |
| 4009 N Calispel St | 0.50mi | 2/1.0 | 966 (+8%) | 2mo | $260,000 | $269 | 62 |
| 508 E Wabash St | 0.56mi | 2/1.0 | 857 (-4%) | 10mo | $258,500 | $302 | 59 |
| 923 E Walton Ave | 0.43mi | 2/1.0 | 1,014 (+13%) | 2mo | $257,500 | $254 | 56 |
| 801 E Longfellow Ave | 0.43mi | 3/1.0 (+1) | 948 (+6%) | 11mo | $277,000 | $292 | 56 |
| 311 E Liberty Ave | 0.42mi | 2/1.0 | 816 (-9%) | 13mo | $270,000 | $331 | 55 |
| 1117 E Garland Ave | 0.55mi | 2/1.0 | 803 (-10%) | 7mo | $250,000 | $311 | 52 |
| 511 E Euclid Ave | 0.54mi | 3/1.0 (+1) | 983 (+10%) | 2mo | $293,999 | $299 | 52 |
| 617 E Wabash Ave | 0.62mi | 2/1.0 | 808 (-10%) | 10mo | $285,000 | $353 | 47 |
| 1313 E Walton Ave | 0.66mi | 2/1.0 | 792 (-11%) | 5mo | $160,000 | $202 | 46 |
| 1307 E Bridgeport Ave | 0.75mi | 2/1.0 | 774 (-13%) | 8mo | $246,267 | $318 | 36 |
Match score weights: distance 35% · size 25% · config 20% · recency 20%. Top-matched comps best support the ARV.
Projected returns pro-forma
-3.0% appreciation · 3.25% rent growth · sell at horizon
- IRR
- -32.0%
- Equity multiple
- -0.05×
- Total profit
- $-66,332
- Equity at exit
- $33,623
- IRR
- -35.6%
- Equity multiple
- -0.51×
- Total profit
- $-95,229
- Equity at exit
- $19,497
Cash invested: $63,140 (down + closing). Projections, not guarantees.
Landlord ↔ Tenant lean methodology
- Overall (STATE)
- 28 Tenant-Leaning
- State Washington
- 28 Tenant-Leaning · D+8
- County
- — inherits STATE
- City
- — inherits STATE
ZIP-level market 99207
- Home prices YoY
- -21.3%
- Rents YoY
- 3.2%
- Active inventory
- 236
- Price-to-rent
- 14.4×
Monthly cashflow live
- Estimated rent
- $1,304 high interval (Pro) →
- Mortgage (P&I)
- −$1,183
- Tax from tax record
- −$226 /mo · $2,715/yr
- Insurance
- −$94
- HOA
- −$0
- Vacancy / Maint / Mgmt
- −$274
- Net cashflow
- $-473
Break-even live
UW: 25.0% down · 7.5% · 30yr · 1.5% tax · 5.0% vac · 8.0% maint · 8.0% mgmt
Financing live
Cash to close
- Down payment
- $56,375
- Closing costs
- $6,765
- Reserves months
- —
- Total cash needed
- —
Loan-product check · same deal, 3 products live
Conventional
25% down · 7.5% · 30yr
- Down + closing
- —
- Monthly P&I
- —
- Monthly cashflow
- —
- DSCR
- —
- Eligible?
- —
Personal DTI + credit; lowest rate.
DSCR
20% down · 8.5% · 30yr
- Down + closing
- —
- Monthly P&I
- —
- Monthly cashflow
- —
- DSCR
- —
- Eligible?
- —
No personal income docs; deal must DSCR.
Hard money
10% down · 12.0% · 12mo
- Down + closing
- —
- Monthly P&I
- —
- Monthly cashflow
- —
- DSCR
- —
- Eligible?
- —
Short-term bridge; refi at stabilization.
Rent comps 31 comps
| Address | Beds | Baths | Sqft | Rent | $/sqft | DOM | Units | Dist |
|---|---|---|---|---|---|---|---|---|
| 709 E Kiernan Ave Spokane, WA | 1.0 | 1.0 | 728 | $1,250 | $1.72 | 23d | 1 | 0.33mi |
| 911 E Bridgeport Ave Unit A Spokane, WA | 2.0 | 1.0 | 800 | $1,120 | $1.40 | 23d | 1 | 0.55mi |
| 120 E Euclid Ave Unit 3 Spokane, WA | 2.0 | 1.0 | 640 | $1,095 | $1.71 | 23d | 1 | 0.56mi |
| 139 W Gray Ct Unit 110 Spokane, WA | 2.0 | 1.0 | 935 | $1,295 | $1.39 | 23d | 1 | 0.60mi |
| 139 W Gray Ct Unit 201 Spokane, WA | 1.0 | 1.0 | 605 | $995 | $1.64 | 23d | 1 | 0.60mi |
| 2915 N Mayfair St Unit 16 Spokane, WA | 2.0 | 1.0 | 700 | $1,050 | $1.50 | 23d | 1 | 0.63mi |
| 2915 N Mayfair St Unit 15 Spokane, WA | 2.0 | 1.0 | 700 | $1,050 | $1.50 | 14d | 1 | 0.63mi |
| 155 E Cleveland Ave Spokane, WA | 2.0 | 2.0 | 830 | $1,395 | $1.68 | 23d | 1 | 0.64mi |
| 2918 N Hamilton St Spokane, WA | 2.0 | 1.0 | 672 | $1,495 | $2.22 | 23d | 1 | 0.74mi |
| 3909 N Wall St Spokane, WA | 1.0–2.0 | 1.0–2.0 | 775 | $2,340 | $3.02 | 14d | 4 | 0.80mi |
| 951 W Walton Ave Spokane, WA | 1.0 | 1.0 | 601 | $1,450 | $2.41 | 14d | 10 | 0.94mi |
| 824 E North Ave Unit 824 Spokane, WA | 2.0 | 1.0 | 770 | $1,195 | $1.55 | 23d | 1 | 0.99mi |
| 2914 N Hogan St Spokane, WA | 2.0 | 1.0 | 650 | $1,100 | $1.69 | 23d | 1 | 1.04mi |
| 1104 W Kiernan Ave Unit 02 Spokane, WA | 2.0 | 1.0 | 585 | $1,100 | $1.88 | 23d | 1 | 1.10mi |
| 406 E Montgomery Ave Spokane, WA | 1.0 | 1.0 | 490 | $986 | $2.01 | 14d | 3 | 1.10mi |
| 1503 E Marietta Ave Spokane, WA | 2.0 | 1.5 | 993 | $1,775 | $1.79 | 14d | 1 | 1.19mi |
| 220 E Ermina Ave Apt 1 Spokane, WA | 1.0 | 1.0 | 805 | $1,050 | $1.30 | 23d | 1 | 1.19mi |
| 1910 E Wellesley Ave Unit 1912 Spokane, WA | 2.0 | 1.0 | 800 | $1,125 | $1.41 | 23d | 1 | 1.20mi |
| 827 E Ermina Ave Unit 5 Spokane, WA | 1.0 | 1.0 | 650 | $1,075 | $1.65 | 23d | 1 | 1.24mi |
| 827 E Ermina Ave Unit 1 Spokane, WA | 2.0 | 1.0 | 850 | $1,150 | $1.35 | 23d | 1 | 1.24mi |
| 2213 N Perry St Spokane, WA | 2.0 | 1.0 | 672 | $950 | $1.41 | 23d | 1 | 1.26mi |
| 2018 N Cincinnati St Rm 1 Spokane, WA | 3.0 | 1.0 | 820 | $625 | $0.76 | 23d | 1 | 1.27mi |
| 6018 N Ruby St #8 Spokane, WA | 2.0 | 1.0 | 600 | $995 | $1.66 | 14d | 1 | 1.32mi |
| 6029 N Mayfair St Unit 7 Spokane, WA | 1.0 | 1.0 | 725 | $1,025 | $1.41 | 14d | 1 | 1.33mi |
| 1601 E Illinois Ave Unit 1603 Spokane, WA | 2.0 | 1.0 | 840 | $1,295 | $1.54 | 23d | 1 | 1.33mi |
| 6107 N Standard St Spokane, WA | 2.0 | 1.5 | 850 | $2,350 | $2.76 | 23d | 1 | 1.37mi |
| 911 E Indiana Ave #7 Spokane, WA | 2.0 | 1.0 | 600 | $1,095 | $1.82 | 21d | 1 | 1.38mi |
| 6203 N Astor St Unit 2 Spokane, WA | 2.0 | 1.5 | 1100 | $1,400 | $1.27 | 21d | 1 | 1.40mi |
| 6203 N Astor St Spokane, WA | 2.0 | 1.0 | 1100 | $1,400 | $1.27 | 14d | 1 | 1.40mi |
| 3218 N Maple St Spokane, WA | 2.0 | 1.0 | 660 | $1,495 | $2.27 | 14d | 1 | 1.44mi |
| 3010 N Stone St Unit 6 Spokane, WA | 2.0 | 1.0 | 800 | $1,300 | $1.62 | 23d | 1 | 1.46mi |
Listing history 2 events
-
2026-06-10remarks 333-char remark
-
2026-06-10$225,500 Pending
ⓘ Source: listings_history table (triggers on properties + properties_extension) + one-shot
backfill from property_details.listing_events for pre-trigger history.
Tax reassessment forecast WA · Resets to sale price
- Current annual tax
- $2,715 · $226/mo
- Projected year-2 tax
- $2,715 · $226/mo
- Expected delta
- $0/yr ($0/mo · 0.0%)
ⓘ Screening estimate from a state-policy table — verify with the county assessor before closing.
Climate risk First Street
- Flood 1/10 Low FEMA zone X (unshaded) · 0% chance over 30 yrs
- Wildfire 1/10 Low
- Heat 3/10 Moderate 7 d/yr ≥94°F today · 15 d/yr by 30 yrs out
- Wind 1/10 Low
- Air quality 10/10 Extreme 19 unhealthy d/yr today · 21 by 30 yrs out
Nearby sold comps map
Loading sold comps map…
Walkable amenities ~0.75 mi
Loading nearby amenities…
Taxation est. · year 1
- Rental income
- $15,647
- − Mortgage interest
- −$12,632
- − Property taxes
- −$2,715
- − Insurance
- −$1,128
- − Repairs & maintenance
- −$1,252
- − Management
- −$1,252
- − Depreciation
- −$6,560
- Taxable loss
- −$9,891
- Est. tax savings @ 24.0%
- +$2,374
- After-tax cash flow
- $-3,298/yr
For passive investors: Depreciation is non-cash, so a rental often shows a tax loss while cash-flowing — sheltering income. Rental losses are passive: they offset passive income freely, and up to $25,000/yr can offset ordinary (W-2) income if you actively participate and your MAGI is under $100k (phasing out to $0 by $150k); unused losses carry forward. On sale, claimed depreciation is recaptured at up to 25%, and gains may owe capital-gains tax (a 1031 exchange can defer both). Figures are a year-1 estimate at your 24.0% rate — not tax advice; consult a CPA.
Schools (NCES district)
- District
- Spokane School District
- NCES district ID
- 5308250
- Math proficiency
- 47% ▲ 1.00%
- Reading proficiency
- 58% ▲ 1.00%
- Median HH income
- $43,187
- Composite
- 46.1/100
- National rank
- #5477
- State rank
- #136 of 291 in WA
Livability — Spokane
- Score
- 80/100
- State rank
- #93
- US rank
- #1822
Category grades
Schools grade is shown separately in the Schools card above.
Census & demographics
- Census place
- Spokane, WA
- County
- Spokane County · 496,401 people
- City population
- 298,820
- Metro
- Spokane-Spokane Valley, WA
- Population (ZIP)
- 32,770
- Household income
- $60,452
- Rent vs Own
- Severe rent burden
- 1557.0
Population outlook (Spokane County) Hauer SSP2
- Today (2025)
- 531,314 people
- By 2030
- 549,278 · +3.4%
- By 2040
- 577,822 · +8.8%
- By 2050
- 598,188 · +12.6%
- By 2075
- 630,744 · +18.7%
- By 2100
- 622,360 · +17.1%
Race, ethnicity, and origin ACS 2023
- Neighborhood character
- Predominantly White (76%)
- Race & ethnicity
- White 76% Two or more races 10% Hispanic / Latino 8% Black 4% Asian 3% Native American 1%
- Hispanic origin (detail)
- Mexican 5%
- Common ancestry
- Portuguese 3% Lithuanian 3% Slovak 3%
- Foreign-born
- 6% · Canada, Vietnam, Philippines
- Languages at home
- 90% English-only · Spanish 3% Russian/Polish/Slavic 1% Other Asian/Pacific 1%
Political lean MEDSL · Spokane
- 2024 margin
- Toss-up / Even · D 46.0% · R 51.0% · Other 3.0%
- 2008→2024 swing
- -3.8pp toward R · 2008: -1.1pp · 2024: -5.0pp
- All cycles
- 2024: R+5.0 2020: R+4.3 2016: R+8.3 2012: R+6.3 2008: R+1.1
Not yet ingested
- Civics
- —
Market trends
- HPI YoY
- ▼ -103.43%
- Current HPI
- 381.758
- Rent YoY
- ▲ 3.25%
- Metro
- Spokane-Spokane Valley, WA
- State GDP YoY
- ▲ 4.65%
- F500 in state
- 22
Industry mix (Fortune 500 HQ in WA)
| Industry | F500 HQs | Revenue |
|---|---|---|
| Retail | 2 | $269B |
|
||
| Technology / Retail | 1 | $638B |
|
||
| Technology | 1 | $245B |
|
||
| Telecommunications | 1 | $38B |
|
||
| Food / Beverage | 1 | $36B |
|
||
| Automotive / Trucks | 1 | $34B |
|
||
Price history
+63.4% since first listed3 events — show timeline
- 2026-06-09 Listed $225,500 SPOKANEMLS as Distributed by MLS Grid
- 2026-06-09 Listing Removed — SPOKANEMLS as Distributed by MLS Grid
- 2018-01-22 Sold (Public Records) $138,000 Public Records
Property tax history
+6.9%/yrLatest (2026): $2,715 · +6.3% YoY. Source: county tax records.
Cash-flow waterfall
monthlySold comps — $/sqft
last 12 mo · ≤1 miLoading sold comps…