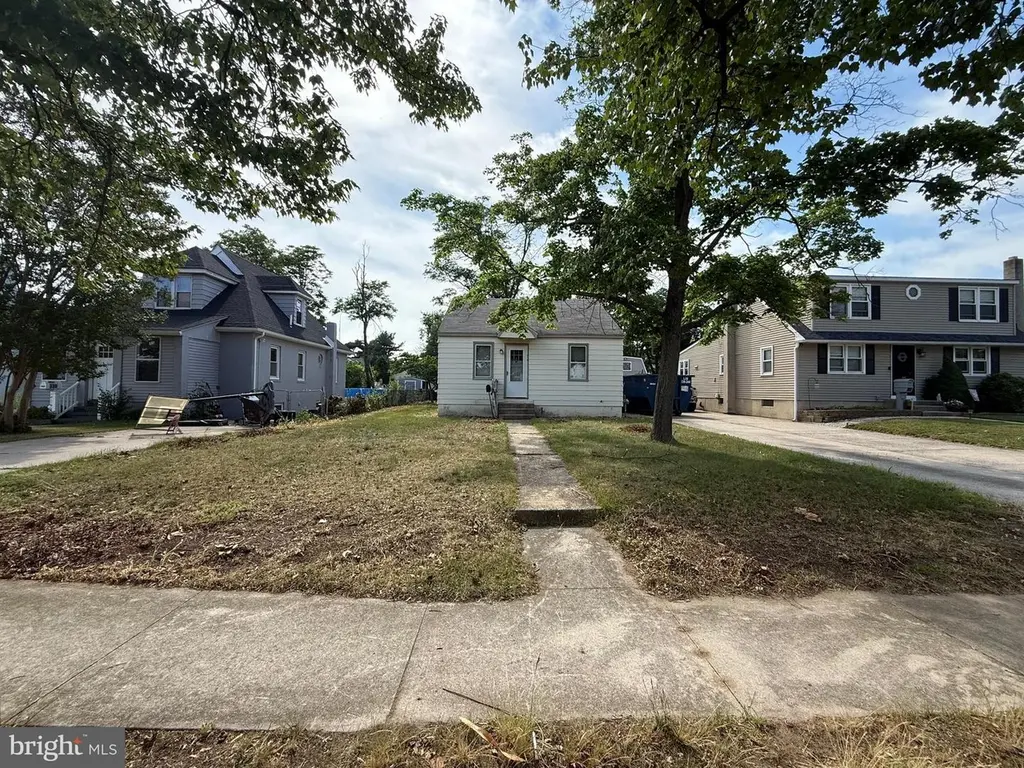
316 Beacon Ave · Paulsboro, NJ
Flood risk 1/10 · Minimal
- FEMA flood zone
- X (unshaded)
- Chance of flooding over 30 yrs
- 0.0%
- Est. flood insurance / yr
- $507 – $1,088
Fire risk 1/10 · Minimal
- Est. fire insurance / yr
- $526 – $976
Heat risk 7/10 · Major
- Hot days now (above 103°F)
- 7 days/yr
- Hot days in 30 yrs
- 15 days/yr
Wind risk 6/10 · Moderate
- Chance of severe wind over 30 yrs
- 27.0%
Air-quality risk 3/10 · Minor
- Unhealthy air days now
- 2 days/yr
- Unhealthy air days in 30 yrs
- 5 days/yr
Risk factors via First Street. Map © Google.
Why this score? — see what drove the C- grade
The composite is a weighted blend of 9 inputs, each scored 0–100. Each bar is that input's sub-score; the figure is the points it added to the 100-point composite (weight × sub-score).
- Cash flow +17.6/30.0
- ARV discount +13.1/15.0
- 1% rule +5.7/10.0
- DSCR +5.5/10.0
- Livability +3.1/5.0
- Rent growth +2.5/5.0
- Condition / age +2.5/5.0
- Schools +1.3/10.0
- Appreciation +0.0/10.0
$169,999
🖨 Deal sheet (PDF) 📄 Offer letter ✓ Due diligence
Listing remarks
Investor Special! Opportunity awaits with this 3-bedroom, 1-bath home ready for renovation. Ideal for investors, contractors, or buyers looking to build equity. Property is being sold strictly as-is. Bring your vision and transform this home into a great rental, flip, or long-term investment. Conveniently located near shopping, schools, and major roadways.
Key facts
- 6,752 sq ft lot
- 3 parking spots
- Built 1947
Property features AI
Finance
- Other: Year built source: Assessor; Improvement and land assessed values available (financial details excluded)
- Financial info: Ownership: Fee simple
Exterior
- Parking: Three total garage/parking spaces; Driveway with space for three vehicles
- Utilities: Public water; Public sewer
- Home design: Detached single-family; Above-grade finished area approximately 1,200 (source: estimated); Entry/stories information not specified; Facing direction not specified
- Construction: Frame construction; Block foundation; Above-grade and below-grade structures
- Exterior features: Concrete driveway; Lot dimensions approximately 50 x 135
Interior
- Kitchen: Kitchen (appliances not specified)
- Bedrooms: Two bedrooms on the main level; One bedroom on the upper level
- Bathrooms: One full bathroom on the main level; One full bathroom total
- Heating & cooling: Forced air heating; Heating fuel: Oil
- Interior features: Unfinished basement; Living room; Kitchen; Basement
- Laundry & utility: Hot water: Natural gas
Neighborhood map
What this means for you Summary
Snapshot
- This is a 3-bed/1.0-bath single-family listed at $170k.
Deal economics
- At list price, monthly cash flow is $135 ($2k/yr) — positive.
- The deal already cash-flows at list — no discount required.
- Meets the 1% rule at list price ($2k rent vs $170k).
- Cap rate 7.2% vs local median 5.1% in Paulsboro — top-decile yield for the area; either an underpriced asset or a hidden risk that comps aren't pricing in. Stress-test before assuming the spread holds.
Location & tenants
- Location reads 62/100 on livability (#445 in NJ) — a middle-class / working-renter tenant base. Strengths: cost of living A+, housing A+; Watch: employment D+, schools F, crime F.
- Paulsboro School District (suburban): math 5% / reading 26% proficiency, ranked #455 of 472 in NJ (top 96%) — low school quality limits family demand, transient renter base, plan for 1-2y turnover; 67% free/reduced lunch — lower-income household profile, screen leases tightly.
- Market conditions: 57 active listings in the ZIP; 1 comparable units currently listed for rent nearby; 1,047 units permitted in Gloucester County in 2024 (183 in 5+ unit buildings).
- This rent runs 34% of the median local income ($65k/yr) — at the standard rent-burdened threshold; future hikes will face affordability resistance.
Forward outlook
- Local home prices are declining (-3.0%/yr); year-one equity from $1k of loan paydown is wiped out by about $5k of value loss. Plan a longer hold.
- Gloucester County population projected to shrink 5% by 2050 — rents likely to lag national; underwrite the cash flow, not the appreciation.
Negotiation context
- Only 12 days on market — expect competitive offers; lowballing is unlikely to land.
Risks & watch-outs
- Watch-outs: built in 1947 — expect roof / HVAC / electrical / plumbing capex.
- Climate carrying-cost: major wind risk, 27% chance of damaging wind over 30y; extreme-heat days projected 7→15/yr by 2055 (HVAC capex compounding) — expect insurance premiums to compound above CPI over the hold.
Questions for the listing agent
- Built in 1947 — when were the roof, HVAC, electrical panel, plumbing, and water heater last replaced?
- Is there a deadline driving the sale (1031 exchange, divorce, estate, relocation)? That informs how much negotiation room exists.
- Schools are F-rated, which usually means shorter tenancies and higher turnover. Who's the typical renter profile here, and what's been the actual vacancy rate?
- Crime grade is F in this area — have there been break-ins, vandalism, or insurance claims at this property in the last 3 years? What carrier currently insures it and at what premium?
- What's the average days-on-market for RENTAL listings here right now (not sales)? A rising rental-DOM trend means longer vacancies and softer asking-rent achievability than the comps imply.
- What's the recent tenant-quality profile in this submarket — average credit score on applications, eviction rate, late-payment / NSF rate, and stable-employment percentage? A property-management company in the area should have these aggregated.
- How much new for-sale + rental construction is in the pipeline within 1–3 miles? Heavy new supply typically softens prices + rents 12–24 months out; constrained supply supports both.
Investment metrics
- 1% rule
- 1.07% ✓
- Cap rate
- 7.24%
- Cash-on-cash
- 3.40%
- DSCR
- 1.15
- GRM
- 7.8
CMA / ARV
- ARV (on-the-fly)
- $194,400
- Comps found
- 1
Show comp detail 1 sale within ~0.75 mi
| Address | Dist | Beds/Ba | Sqft | Sold | Price | $/sf | Match |
|---|---|---|---|---|---|---|---|
| 331 Greenwich Ave | 0.10mi | 2/1.0 (-1) | 740 (+3%) | 8mo | $200,000 | $270 | 79 |
Match score weights: distance 35% · size 25% · config 20% · recency 20%. Top-matched comps best support the ARV.
Projected returns pro-forma
-3.0% appreciation · 3.0% rent growth · sell at horizon
- IRR
- -10.9%
- Equity multiple
- 0.60×
- Total profit
- $-18,857
- Equity at exit
- $25,347
- IRR
- -1.5%
- Equity multiple
- 0.90×
- Total profit
- $-4,938
- Equity at exit
- $14,698
Cash invested: $47,600 (down + closing). Projections, not guarantees.
Landlord ↔ Tenant lean methodology
- Overall (STATE)
- 21 Tenant-Leaning
- State New Jersey
- 21 Tenant-Leaning · D+6
- County
- — inherits STATE
- City
- — inherits STATE
ZIP-level market 08066
- Home prices YoY
- -19.0%
- Active inventory
- 57
- Price-to-rent
- 7.8×
Monthly cashflow live
- Estimated rent
- $1,819 medium interval (Pro) →
- Mortgage (P&I)
- −$891
- Tax from tax record
- −$340 /mo · $4,077/yr
- Insurance
- −$71
- HOA
- −$0
- Vacancy / Maint / Mgmt
- −$382
- Net cashflow
- $135
Break-even live
Sensitivity live
| Price | -10% $231 | -5% $183 | +0% $135 | +5% $87 | +10% $39 |
|---|---|---|---|---|---|
| Rent | -10% $-9 | -5% $63 | +0% $135 | +5% $207 | +10% $278 |
| Rate | -1.0pp $220 | -0.5pp $178 | base $135 | +0.5pp $91 | +1.0pp $46 |
UW: 25.0% down · 7.5% · 30yr · 1.5% tax · 5.0% vac · 8.0% maint · 8.0% mgmt
Financing live
Cash to close
- Down payment
- $42,500
- Closing costs
- $5,100
- Reserves months
- —
- Total cash needed
- —
Loan-product check · same deal, 3 products live
Conventional
25% down · 7.5% · 30yr
- Down + closing
- —
- Monthly P&I
- —
- Monthly cashflow
- —
- DSCR
- —
- Eligible?
- —
Personal DTI + credit; lowest rate.
DSCR
20% down · 8.5% · 30yr
- Down + closing
- —
- Monthly P&I
- —
- Monthly cashflow
- —
- DSCR
- —
- Eligible?
- —
No personal income docs; deal must DSCR.
Hard money
10% down · 12.0% · 12mo
- Down + closing
- —
- Monthly P&I
- —
- Monthly cashflow
- —
- DSCR
- —
- Eligible?
- —
Short-term bridge; refi at stabilization.
Rent comps 1 comps
| Address | Beds | Baths | Sqft | Rent | $/sqft | DOM | Units | Dist |
|---|---|---|---|---|---|---|---|---|
| 221 Berkley Rd Paulsboro, NJ | 1.0–2.0 | 1.0 | 750 | $1,650 | $2.20 | 0d | 7 | 1.48mi |
Listing history 9 events
-
2026-06-21days on market $169,999 Active 12 DOM
-
2026-06-18days on market $169,999 Active 9 DOM
-
2026-06-17days on market $169,999 Active 8 DOM
-
2026-06-16days on market $169,999 Active 7 DOM
-
2026-06-15price $169,999 Active 6 DOM
-
2026-06-15days on market $175,000 Active 6 DOM
-
2026-06-13days on market $175,000 Active 4 DOM
-
2026-06-10remarks 358-char remark
-
2026-06-10$175,000 Active 1 DOM
ⓘ Source: listings_history table (triggers on properties + properties_extension) + one-shot
backfill from property_details.listing_events for pre-trigger history.
Tax reassessment forecast NJ · Partial reset (capped growth)
- Current annual tax
- $4,077 · $340/mo
- Projected year-2 tax
- $4,155 · $346/mo
- Expected delta
- +$78/yr (+$6/mo · 1.9%)
ⓘ Screening estimate from a state-policy table — verify with the county assessor before closing.
Climate risk First Street
- Flood 1/10 Low FEMA zone X (unshaded) · 0% chance over 30 yrs
- Wildfire 1/10 Low
- Heat 7/10 Severe 7 d/yr ≥103°F today · 15 d/yr by 30 yrs out
- Wind 6/10 Major 27% chance of damaging wind over 30 yrs
- Air quality 3/10 Moderate 2 unhealthy d/yr today · 5 by 30 yrs out
Nearby sold comps map
Loading sold comps map…
Walkable amenities ~0.75 mi
Loading nearby amenities…
Taxation est. · year 1
- Rental income
- $21,826
- − Mortgage interest
- −$9,523
- − Property taxes
- −$4,077
- − Insurance
- −$850
- − Repairs & maintenance
- −$1,746
- − Management
- −$1,746
- − Depreciation
- −$4,945
- Taxable loss
- −$1,061
- Est. tax savings @ 24.0%
- +$255
- After-tax cash flow
- $1,872/yr
For passive investors: Depreciation is non-cash, so a rental often shows a tax loss while cash-flowing — sheltering income. Rental losses are passive: they offset passive income freely, and up to $25,000/yr can offset ordinary (W-2) income if you actively participate and your MAGI is under $100k (phasing out to $0 by $150k); unused losses carry forward. On sale, claimed depreciation is recaptured at up to 25%, and gains may owe capital-gains tax (a 1031 exchange can defer both). Figures are a year-1 estimate at your 24.0% rate — not tax advice; consult a CPA.
Schools (NCES district)
- District
- Paulsboro School District
- NCES district ID
- 3412720
- Math proficiency
- 5% ▼ -9.00%
- Reading proficiency
- 26% ▲ 3.00%
- Median HH income
- $43,261
- Composite
- 13.46/100
- National rank
- #9521
- State rank
- #455 of 472 in NJ
Livability — Paulsboro
- Score
- 62/100
- State rank
- #445
- US rank
- #16559
Category grades
Schools grade is shown separately in the Schools card above.
Census & demographics
- Census place
- Paulsboro, NJ
- County
- Gloucester County · 160,422 people
- Metro
- Philadelphia-Camden-Wilmington, PA-NJ-DE-MD
- Population (ZIP)
- 7,760
- Household income
- $65,070
- Rent vs Own
- Severe rent burden
- 304.0
Population outlook (Gloucester County) Hauer SSP2
- Today (2025)
- 298,895 people
- By 2030
- 299,031 · +0.0%
- By 2040
- 294,020 · -1.6%
- By 2050
- 284,188 · -4.9%
- By 2075
- 260,720 · -12.8%
- By 2100
- 229,565 · -23.2%
Race, ethnicity, and origin ACS 2023
- Neighborhood character
- Diverse neighborhood (Simpson 0.66)
- Race & ethnicity
- White 47% Black 30% Hispanic / Latino 16% Two or more races 14%
- Hispanic origin (detail)
- Mexican 3% Puerto Rican 10%
- Common ancestry
- Romanian 6% Serbian 3% Armenian 2%
- Foreign-born
- 4% · Canada, Dominican Republic
- Languages at home
- 84% English-only · Spanish 11% Arabic 2% Russian/Polish/Slavic 1%
Political lean MEDSL · Gloucester
- 2024 margin
- Toss-up / Even · D 47.8% · R 50.6% · Other 1.6%
- 2008→2024 swing
- -15.0pp toward R · 2008: 12.2pp · 2024: -2.8pp
- All cycles
- 2024: R+2.8 2020: D+1.9 2016: R+0.4 2012: D+10.5 2008: D+12.2
Not yet ingested
- Civics
- —
Market trends
- HPI YoY
- ▼ -79.33%
- Current HPI
- 337.4363
- Rent YoY
- —
- Metro
- Philadelphia-Camden-Wilmington, PA-NJ-DE-MD
- State GDP YoY
- ▲ 2.05%
- F500 in state
- 34
Industry mix (Fortune 500 HQ in NJ)
| Industry | F500 HQs | Revenue |
|---|---|---|
| Consumer Goods | 3 | $31B |
|
||
| Pharmaceuticals | 2 | $153B |
|
||
| Technology | 2 | $21B |
|
||
| Insurance | 2 | $20B |
|
||
| Healthcare | 2 | $19B |
|
||
| Financial Services | 1 | $70B |
|
||
Price history
1 event — show timeline
- 2026-06-09 Listed $175,000 BRIGHT MLS
Property tax history
+1.8%/yrLatest (2025): $4,077 · +10.3% YoY. Source: county tax records.
Cash-flow waterfall
monthlySold comps — $/sqft
last 12 mo · ≤1 miLoading sold comps…