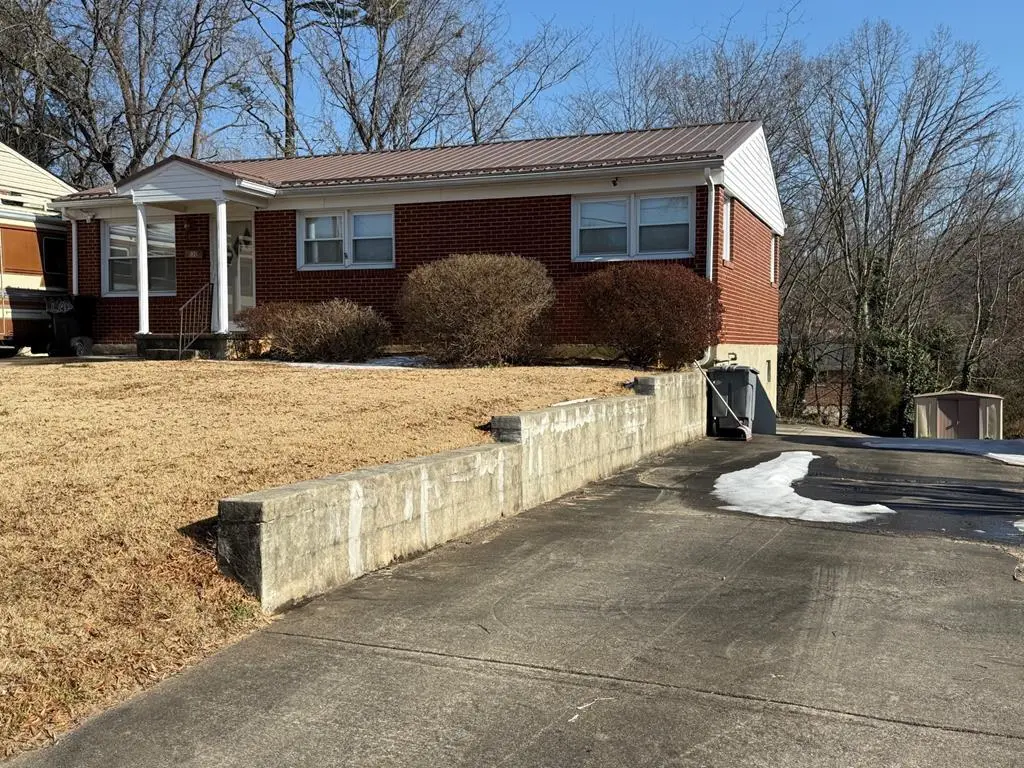
130 Greenwood Ln · Danville, VA
Flood risk 1/10 · Minimal
- FEMA flood zone
- X (unshaded)
- Chance of flooding over 30 yrs
- 0.0%
- Est. flood insurance / yr
- $473 – $860
Fire risk 2/10 · Minimal
- Est. fire insurance / yr
- $666 – $1,236
Heat risk 6/10 · Moderate
- Hot days now (above 105°F)
- 7 days/yr
- Hot days in 30 yrs
- 18 days/yr
Wind risk 4/10 · Minor
- Chance of severe wind over 30 yrs
- 9.0%
Air-quality risk 2/10 · Minimal
- Unhealthy air days now
- 0 days/yr
- Unhealthy air days in 30 yrs
- 1 days/yr
Risk factors via First Street. Map © Google.
Why this score? — see what drove the D+ grade
The composite is a weighted blend of 9 inputs, each scored 0–100. Each bar is that input's sub-score; the figure is the points it added to the 100-point composite (weight × sub-score).
- Cash flow +15.0/30.0
- ARV discount +13.1/15.0
- DSCR +4.6/10.0
- Livability +3.9/5.0
- 1% rule +3.1/10.0
- Schools +3.0/10.0
- Rent growth +2.5/5.0
- Condition / age +2.5/5.0
- Appreciation +0.0/10.0
$169,000
🖨 Deal sheet 📄 Offer letter ✓ Due diligence
Listing remarks MLS
Well-maintained brick ranch offering more than meets the eye, conveniently located near main artery roads and all town amenities. Private drive leads to a two-car garage with a beautiful great room above, accessible from the main house and ideal for added living or entertaining space. Main level features an oversized living room and charming galley kitchen, plus a third bedroom in the partially finished basement. Newer metal roof and dual HVAC units provide separate climate control. Home is older and needs updates, with some repairs evident. Sold as-is; seller will make no repairs and has never occupied the property. Schedule in NAVICA; showing instructions will be texted. Under contract with kick out clause, seller wants remain active on MLS
Key facts
- Galley kitchen
- Great room
- Two-car garage
Tags
Neighborhood map
What this means for you Summary
Snapshot
- This is a 2-bed/1.0-bath single-family listed at $169k.
Deal economics
- At list price, monthly cash flow is $52 ($626/yr) — positive.
- The deal already cash-flows at list — no discount required.
- To meet the 1% rule (rent ≥ 1% of price), the offer needs to be $137k (18.8% below list).
- Recommended offer: $137k (18.8% below list) — sets the bar for 1% rule.
- Cap rate 6.7% vs local median 5.3% in Danville — meaningfully above typical; check what's discounted (condition, days-on-market, listing class) to confirm the premium yield is real.
Location & tenants
- Location reads 77/100 on livability (#91 in VA, #2,952 nationally) — a middle-class / working-renter tenant base. Strengths: cost of living A+, housing A+, health & safety A+; Watch: amenities D+, crime D-, commute F.
- Danville City Public School District (town): math 30% / reading 44% proficiency, ranked #128 of 131 in VA (top 98%) — families likely to look elsewhere, expect single-tenant / working-renter base with shorter leases; 71% free/reduced lunch — lower-income household profile, screen leases tightly.
- Market conditions: 211 active listings in the ZIP; 2 comparable units currently listed for rent nearby; 54 units permitted in Danville city in 2024 (40 in 5+ unit buildings).
- This rent runs 34% of the median local income ($48k/yr) — at the standard rent-burdened threshold; future hikes will face affordability resistance.
Forward outlook
- Local home prices are declining (-3.0%/yr); year-one equity from $1k of loan paydown is wiped out by about $5k of value loss. Plan a longer hold.
- Danville County population projected to shrink 7% by 2050 — rents likely to lag national; underwrite the cash flow, not the appreciation.
Negotiation context
- It's been on market 126 days — a 12% lower offer ($149k) is reasonable based on typical stale-listing flexibility.
Risks & watch-outs
- Watch-outs: built in 1958 — expect roof / HVAC / electrical / plumbing capex.
- Climate carrying-cost: extreme-heat days projected 7→18/yr by 2055 (HVAC capex compounding) — expect insurance premiums to compound above CPI over the hold.
Questions for the listing agent
- It's been on market 126 days. Have you received any prior offers? Is the seller open to a 19% concession, seller financing, or rate buy-down credit?
- Built in 1958 — when were the roof, HVAC, electrical panel, plumbing, and water heater last replaced?
- Why hasn't it sold? Are there any deal-killer items the seller is aware of (foundation, flood, title, zoning, code violations)?
- Is there a deadline driving the sale (1031 exchange, divorce, estate, relocation)? That informs how much negotiation room exists.
- Schools are B-rated — typically a magnet for longer-tenancy family renters. What's the average tenant stay here, and is there a school-zone premium baked into asking?
- Crime grade is D in this area — have there been break-ins, vandalism, or insurance claims at this property in the last 3 years? What carrier currently insures it and at what premium?
- The area grade is low — what's the realistic commute time and amenity access for the typical tenant pool here? Any planned neighborhood developments (good or bad) we should know about?
- What's the average days-on-market for RENTAL listings here right now (not sales)? A rising rental-DOM trend means longer vacancies and softer asking-rent achievability than the comps imply.
- What's the recent tenant-quality profile in this submarket — average credit score on applications, eviction rate, late-payment / NSF rate, and stable-employment percentage? A property-management company in the area should have these aggregated.
- How much new for-sale + rental construction is in the pipeline within 1–3 miles? Heavy new supply typically softens prices + rents 12–24 months out; constrained supply supports both.
Investment metrics
- 1% rule
- 0.81% ✗
- Cap rate
- 6.66%
- Cash-on-cash
- 1.32%
- DSCR
- 1.06
- GRM
- 10.3
CMA / ARV
- ARV (median comp)
- $192,914
- List price
- $169,000
- Delta
- -12.40%
- Verdict
- UNDERPRICED
- Comps
- 20 within 1.0 mi
Show comp detail 12 sales within ~0.75 mi
| Address | Dist | Beds/Ba | Sqft | Sold | Price | $/sf | Match |
|---|---|---|---|---|---|---|---|
| 427 Granville Dr | 0.06mi | 3/1.0 (+1) | 1,587 (+4%) | 9mo | $205,000 | $129 | 78 |
| 154 Orchard Dr | 0.37mi | 2/2.0 | 1,550 (+1%) | 2mo | $269,000 | $174 | 75 |
| 702 Franklin Tpke | 0.45mi | 2/1.0 | 1,560 (+2%) | 3mo | $164,000 | $105 | 73 |
| 212 Westview Dr | 0.33mi | 2/1.0 | 1,392 (-9%) | 1mo | $135,000 | $97 | 69 |
| 128 Brantley Pl | 0.25mi | 3/2.0 (+1) | 1,568 (+3%) | 8mo | $209,000 | $133 | 69 |
| 209 Parrish Rd | 0.11mi | 3/2.0 (+1) | 1,731 (+13%) | 2mo | $255,000 | $147 | 62 |
| 301 Northmont Blvd | 0.40mi | 3/1.5 (+1) | 1,456 (-5%) | 8mo | $232,500 | $160 | 60 |
| 886 Arnett Blvd | 0.35mi | 2/1.0 | 1,340 (-12%) | 11mo | $185,000 | $138 | 54 |
| 869 Arnett Blvd | 0.38mi | 3/1.5 (+1) | 1,329 (-13%) | 5mo | $111,000 | $84 | 49 |
| 190 Nelson Ave | 0.61mi | 3/2.0 (+1) | 1,428 (-6%) | 8mo | $209,500 | $147 | 45 |
| 207 Northmont Blvd | 0.49mi | 3/1.0 (+1) | 1,719 (+12%) | 9mo | $190,000 | $111 | 43 |
| 7316 Other | 0.72mi | 3/2.0 (+1) | 1,624 (+6%) | 9mo | $257,000 | $158 | 40 |
Match score weights: distance 35% · size 25% · config 20% · recency 20%. Top-matched comps best support the ARV.
Projected returns pro-forma
-3.0% appreciation · 3.0% rent growth · sell at horizon
- IRR
- -14.2%
- Equity multiple
- 0.49×
- Total profit
- $-24,125
- Equity at exit
- $25,198
- IRR
- -5.5%
- Equity multiple
- 0.64×
- Total profit
- $-16,983
- Equity at exit
- $14,612
Cash invested: $47,320 (down + closing). Projections, not guarantees.
Landlord ↔ Tenant lean methodology
- Overall (STATE)
- 55 Moderately Landlord-Leaning
- State Virginia
- 55 Moderately Landlord-Leaning · D+2
- County
- — inherits STATE
- City
- — inherits STATE
ZIP-level market 24540
- Home prices YoY
- -20.0%
- Active inventory
- 211
- Price-to-rent
- 10.3×
Monthly cashflow live
- Estimated rent
- $1,373 medium interval (Pro) →
- Mortgage (P&I)
- −$886
- Tax from tax record
- −$76 /mo · $909/yr
- Insurance
- −$70
- HOA
- −$0
- Vacancy / Maint / Mgmt
- −$288
- Net cashflow
- $52
Break-even live
UW: 25.0% down · 7.5% · 30yr · 1.5% tax · 5.0% vac · 8.0% maint · 8.0% mgmt
Financing live
Cash to close
- Down payment
- $42,250
- Closing costs
- $5,070
- Reserves months
- —
- Total cash needed
- —
Loan-product check · same deal, 3 products live
Conventional
25% down · 7.5% · 30yr
- Down + closing
- —
- Monthly P&I
- —
- Monthly cashflow
- —
- DSCR
- —
- Eligible?
- —
Personal DTI + credit; lowest rate.
DSCR
20% down · 8.5% · 30yr
- Down + closing
- —
- Monthly P&I
- —
- Monthly cashflow
- —
- DSCR
- —
- Eligible?
- —
No personal income docs; deal must DSCR.
Hard money
10% down · 12.0% · 12mo
- Down + closing
- —
- Monthly P&I
- —
- Monthly cashflow
- —
- DSCR
- —
- Eligible?
- —
Short-term bridge; refi at stabilization.
Rent comps 2 comps
| Address | Beds | Baths | Sqft | Rent | $/sqft | DOM | Units | Dist |
|---|---|---|---|---|---|---|---|---|
| 713 Springfield Rd Unit K Danville, VA | 3.0 | 2.0 | 1200 | $1,200 | $1.00 | 43d | 1 | 0.94mi |
| 248 Lakeside Dr Danville, VA | 3.0 | 1.5 | 1134 | $2,200 | $1.94 | 43d | 1 | 1.48mi |
Listing history 17 events
-
2026-06-19days on market $169,000 Active 126 DOM
-
2026-06-18days on market $169,000 Active 125 DOM
-
2026-06-17days on market $169,000 Active 124 DOM
-
2026-06-16days on market $169,000 Active 123 DOM
-
2026-06-15days on market $169,000 Active 122 DOM
-
2026-06-14days on market $169,000 Active 120 DOM
-
2026-06-13days on market $169,000 Active 119 DOM
-
2026-06-10days on market $169,000 Active 117 DOM
-
2026-06-09days on market $169,000 Active 116 DOM
-
2026-06-08days on market $169,000 Active 115 DOM
-
2026-06-07days on market $169,000 Active 114 DOM
-
2026-06-05days on market $169,000 Active 111 DOM
-
2026-06-02days on market $169,000 Active 109 DOM
-
2026-06-01days on market $169,000 Active 108 DOM
-
2026-05-31days on market $169,000 Active 107 DOM
-
2026-05-30days on market $169,000 Active 106 DOM
-
2026-02-13$169,000 Active 752-char remark
Show marketing remark (752 chars)
Well-maintained brick ranch offering more than meets the eye, conveniently located near main artery roads and all town amenities. Private drive leads to a two-car garage with a beautiful great room above, accessible from the main house and ideal for added living or entertaining space. Main level features an oversized living room and charming galley kitchen, plus a third bedroom in the partially finished basement. Newer metal roof and dual HVAC units provide separate climate control. Home is older and needs updates, with some repairs evident. Sold as-is; seller will make no repairs and has never occupied the property. Schedule in NAVICA; showing instructions will be texted. Under contract with kick out clause, seller wants remain active on MLS
ⓘ Source: listings_history table (triggers on properties + properties_extension) + one-shot
backfill from property_details.listing_events for pre-trigger history.
Tax reassessment forecast VA · Resets to sale price
- Current annual tax
- $909 · $76/mo
- Projected year-2 tax
- $1,386 · $115/mo
- Expected delta
- +$477/yr (+$40/mo · 52.5%)
ⓘ Screening estimate from a state-policy table — verify with the county assessor before closing.
Climate risk First Street
- Flood 1/10 Low FEMA zone X (unshaded) · 0% chance over 30 yrs
- Wildfire 2/10 Low
- Heat 6/10 Major 7 d/yr ≥105°F today · 18 d/yr by 30 yrs out
- Wind 4/10 Moderate 9% chance of damaging wind over 30 yrs
- Air quality 2/10 Low 0 unhealthy d/yr today · 1 by 30 yrs out
Nearby sold comps map
Loading sold comps map…
Walkable amenities ~0.75 mi
Loading nearby amenities…
Taxation est. · year 1
- Rental income
- $16,475
- − Mortgage interest
- −$9,467
- − Property taxes
- −$909
- − Insurance
- −$845
- − Repairs & maintenance
- −$1,318
- − Management
- −$1,318
- − Depreciation
- −$4,916
- Taxable loss
- −$2,298
- Est. tax savings @ 24.0%
- +$552
- After-tax cash flow
- $1,178/yr
For passive investors: Depreciation is non-cash, so a rental often shows a tax loss while cash-flowing — sheltering income. Rental losses are passive: they offset passive income freely, and up to $25,000/yr can offset ordinary (W-2) income if you actively participate and your MAGI is under $100k (phasing out to $0 by $150k); unused losses carry forward. On sale, claimed depreciation is recaptured at up to 25%, and gains may owe capital-gains tax (a 1031 exchange can defer both). Figures are a year-1 estimate at your 24.0% rate — not tax advice; consult a CPA.
Schools (NCES district)
- District
- Danville City Public School District
- NCES district ID
- 5101110
- Math proficiency
- 30% ▼ -22.00%
- Reading proficiency
- 44% ▼ -8.00%
- Median HH income
- $31,952
- Composite
- 30.23/100
- National rank
- #6298
- State rank
- #128 of 131 in VA
Livability — Danville
- Score
- 77/100
- State rank
- #91
- US rank
- #2952
Category grades
Schools grade is shown separately in the Schools card above.
Census & demographics
- Census place
- Danville, VA
- County
- Danville City · 59,055 people
- City population
- 59,055
- Metro
- Danville, VA
- Population (ZIP)
- 31,013
- Household income
- $47,924
- Rent vs Own
- Severe rent burden
- 1170.0
Population outlook (Danville County) Hauer SSP2
- Today (2025)
- 40,989 people
- By 2030
- 40,432 · -1.4%
- By 2040
- 39,255 · -4.2%
- By 2050
- 38,035 · -7.2%
- By 2075
- 35,612 · -13.1%
- By 2100
- 30,365 · -25.9%
Race, ethnicity, and origin ACS 2023
- Neighborhood character
- Diverse neighborhood (Simpson 0.57)
- Race & ethnicity
- White 50% Black 42% Two or more races 5% Hispanic / Latino 4%
- Common ancestry
- Slovak 1% Lithuanian 1% Serbian 1%
- Foreign-born
- 2% · Canada
- Languages at home
- 97% English-only · Spanish 2%
Political lean MEDSL · Danville
- 2024 margin
- Strong D (+21.1) · D 60.1% · R 39.0%
- 2008→2024 swing
- +1.9pp toward D · 2008: 19.1pp · 2024: 21.1pp
- All cycles
- 2024: D+21.1 2020: D+22.1 2016: D+19.9 2012: D+22.1 2008: D+19.1
Not yet ingested
- Civics
- —
Market trends
- HPI YoY
- ▼ -58.79%
- Current HPI
- 235.1746
- Rent YoY
- —
- Metro
- Danville, VA
- State GDP YoY
- ▲ 2.40%
- F500 in state
- 50
Industry mix (Fortune 500 HQ in VA)
| Industry | F500 HQs | Revenue |
|---|---|---|
| Aerospace / Defense | 4 | $236B |
|
||
| Technology / Defense | 3 | $32B |
|
||
| Financial Services | 2 | $176B |
|
||
| Utilities | 2 | $27B |
|
||
| Insurance | 2 | $25B |
|
||
| Technology | 2 | $15B |
|
||
Price history
1 event — show timeline
- 2026-02-13 Listed $169,000 DRRAR
Property tax history
+2.6%/yrLatest (2025): $909 · +0.0% YoY. Source: county tax records.
Cash-flow waterfall
monthlySold comps — $/sqft
last 12 mo · ≤1 miLoading sold comps…