 Multi-family
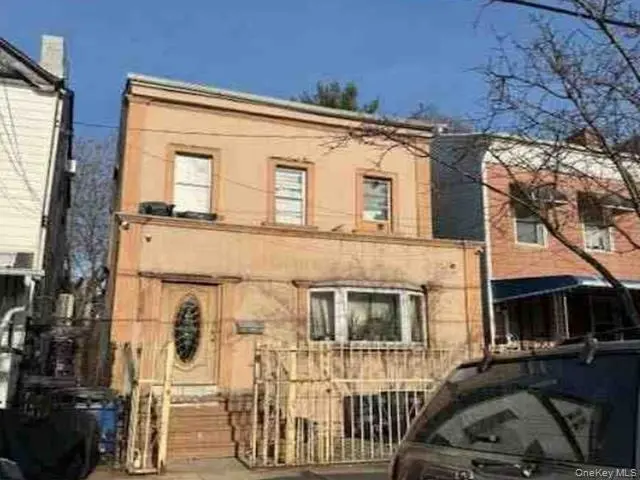
239 Warwick St · New York, NY
Flood risk 9/10 · Severe
- FEMA flood zone
- X (unshaded)
- Chance of flooding over 30 yrs
- 0.99%
- Est. flood insurance / yr
- $507 – $1,088
Fire risk 1/10 · Minimal
- Est. fire insurance / yr
- $691 – $1,283
Heat risk 7/10 · Major
- Hot days now (above 99°F)
- 7 days/yr
- Hot days in 30 yrs
- 15 days/yr
Wind risk 6/10 · Moderate
- Chance of severe wind over 30 yrs
- 39.0%
Air-quality risk 5/10 · Moderate
- Unhealthy air days now
- 6 days/yr
- Unhealthy air days in 30 yrs
- 8 days/yr
Risk factors via First Street. Map © Google.
Why this score? — see what drove the B+ grade
The composite is a weighted blend of 9 inputs, each scored 0–100. Each bar is that input's sub-score; the figure is the points it added to the 100-point composite (weight × sub-score).
- Cash flow +30.0/30.0
- ARV discount +15.0/15.0
- DSCR +10.0/10.0
- 1% rule +9.4/10.0
- Schools +5.0/10.0
- Rent growth +3.8/5.0
- Livability +3.8/5.0
- Condition / age +2.5/5.0
- Appreciation +0.0/10.0
$438,900
🖨 Deal sheet 📄 Offer letter ✓ Due diligence
Multi-family units
County records classify this as Multi-Family (2-4 Unit). Listing-text estimate: 1 unit. estimate disagrees with records
Listing remarks
This brick duplex in East New York offers a compelling value-add opportunity in a stable Brooklyn market. Featuring approximately 1,700+ square feet across multiple bedrooms, plus a finished basement, the property supports strong multifamily utility. Recent nearby duplex sales support as-is pricing in the low-to-mid $400,000s, providing clear market validation. The home is currently occupied and in fair condition, with upside potential through future improvements reflected in the price. Located near major transportation corridors and neighborhood amenities, the asset benefits from solid long-term market fundamentals and typical 3–6 month absorption. Ideal for investors or end users se
Key facts
- 2,375 sq ft lot
- Built 1910
- Listed 11 days
Property features AI
Exterior
- Parking: No carport; No designated parking features
- Utilities: Public sewer; Utilities: see remarks
- Home design: Single family residence; Living area verified by appraiser
- Construction: Frame construction
- Exterior features: Frame construction; Not waterfront
Interior
- Kitchen: No appliances reported
- Bedrooms: 10 total rooms (bedroom count not specified)
- Bathrooms: 2 full bathrooms
- Heating & cooling: Forced air heating; Natural gas heating; Other heating; No cooling
- Interior features: Other interior features; Full unfinished basement
- Laundry & utility: No laundry appliances reported
Neighborhood map
What this means for you Summary
Snapshot
- This is a 4-bed/2.0-bath multifamily listed at $439k.
Deal economics
- At list price, monthly cash flow is $2k ($24k/yr) — positive.
- The deal already cash-flows at list — no discount required.
- Meets the 1% rule at list price ($6k rent vs $439k).
- Cap rate 12.0% vs local median 2.6% in New York — top-decile yield for the area; either an underpriced asset or a hidden risk that comps aren't pricing in. Stress-test before assuming the spread holds.
Location & tenants
- Location reads 75/100 on livability (#268 in NY, #4,188 nationally) — a middle-class / working-renter tenant base. Strengths: amenities A+, commute A+, health & safety A; Watch: crime F, cost of living F.
- Market conditions: Rents rising fast (+5.3%/yr); 251 active listings in the ZIP; 7 comparable units currently listed for rent nearby; rentals at typical pace (median 25d on market — plan ~3-4 weeks tenant-placement turnaround); 10,063 units permitted in Kings County in 2024 (9,789 in 5+ unit buildings).
- At $6,317/mo this rent would consume 134% of the median local household income ($57k/yr) (locally 7510% of renters already pay >50% of income on rent) — very limited rent-growth headroom before tenants either downsize or default.
Forward outlook
- Local home prices are declining (-3.0%/yr); year-one equity from $3k of loan paydown is wiped out by about $13k of value loss. Plan a longer hold.
- Kings County population projected at +13% by 2050 — modest demand growth; plan on rents tracking national, not racing it.
- At projected returns (-3.0% appreciation + 5.3% rent growth), your $123k cash investment doubles in ~6 years — after that, you're playing with house money.
Negotiation context
- Only 11 days on market — expect competitive offers; lowballing is unlikely to land.
Risks & watch-outs
- Watch-outs: flood insurance adds $66/mo; built in 1910 — expect roof / HVAC / electrical / plumbing capex.
- Climate carrying-cost: severe flood risk; major wind risk, 39% chance of damaging wind over 30y; extreme-heat days projected 7→15/yr by 2055 (HVAC capex compounding) — expect insurance premiums to compound above CPI over the hold.
Questions for the listing agent
- Built in 1910 — when were the roof, HVAC, electrical panel, plumbing, and water heater last replaced?
- What's the actual annual flood-insurance premium (NFIP or private), and is the property in a SFHA with mandatory coverage?
- Is there a deadline driving the sale (1031 exchange, divorce, estate, relocation)? That informs how much negotiation room exists.
- Schools are B-rated — typically a magnet for longer-tenancy family renters. What's the average tenant stay here, and is there a school-zone premium baked into asking?
- Crime grade is F in this area — have there been break-ins, vandalism, or insurance claims at this property in the last 3 years? What carrier currently insures it and at what premium?
- What's the average days-on-market for RENTAL listings here right now (not sales)? A rising rental-DOM trend means longer vacancies and softer asking-rent achievability than the comps imply.
- What's the recent tenant-quality profile in this submarket — average credit score on applications, eviction rate, late-payment / NSF rate, and stable-employment percentage? A property-management company in the area should have these aggregated.
- How much new apartment / multifamily construction is in the pipeline within 1–3 miles? Heavy new supply (>2% of stock underway) typically softens rents 12–24 months out; light construction supports rent growth.
Investment metrics
- 1% rule
- 1.44% ✓
- Cap rate
- 12.01%
- Cash-on-cash
- 20.42%
- DSCR
- 1.91
- GRM
- 5.8
CMA / ARV
- ARV (on-the-fly)
- $689,319
- Comps found
- 7
Show comp detail 7 sales within ~0.75 mi
| Address | Dist | Beds/Ba | Sqft | Sold | Price | $/sf | Match |
|---|---|---|---|---|---|---|---|
| 399 Warwick St | 0.30mi | 4/2.0 | 1,800 (+5%) | 8mo | $455,000 | $253 | 71 |
| 551 Liberty Ave | 0.23mi | 5/2.0 (+1) | 1,676 (-2%) | 12mo | $672,001 | $401 | 70 |
| 74 Fountain Ave | 0.55mi | 5/3.0 (+1) | 1,728 (+0%) | 8mo | $910,000 | $527 | 58 |
| 215 Warwick St | 0.04mi | 5/3.0 (+1) | 1,964 (+14%) | 10mo | $975,000 | $496 | 57 |
| 210 Barbey St | 0.12mi | 5/2.0 (+1) | 1,920 (+12%) | 22mo | $640,000 | $333 | 52 |
| 361 Chestnut Ct | 0.67mi | 5/3.0 (+1) | 1,680 (-2%) | 10mo | $999,990 | $595 | 48 |
| 545 Logan St | 0.71mi | 5/3.0 (+1) | 1,640 (-5%) | 4mo | $630,000 | $384 | 46 |
Match score weights: distance 35% · size 25% · config 20% · recency 20%. Top-matched comps best support the ARV.
Projected returns pro-forma
-3.0% appreciation · 5.29% rent growth · sell at horizon
- IRR
- 14.4%
- Equity multiple
- 1.59×
- Total profit
- $72,800
- Equity at exit
- $65,441
- IRR
- 24.8%
- Equity multiple
- 3.39×
- Total profit
- $293,717
- Equity at exit
- $37,948
Cash invested: $122,892 (down + closing). Projections, not guarantees.
Landlord ↔ Tenant lean methodology
- Overall (CITY)
- 0 Strongly Tenant-Friendly
- State New York
- 15 Strongly Tenant-Friendly · D+10
- County
- — inherits STATE
- City New York
- 0 Strongly Tenant-Friendly · D+34
ZIP-level market 11207
- Home prices YoY
- -26.3%
- Rents YoY
- 5.3%
- Active inventory
- 251
- Price-to-rent
- 11.6×
Monthly cashflow live
- Estimated rent
- $6,317 high interval (Pro) →
- Mortgage (P&I)
- −$2,302
- Tax from tax record
- −$414 /mo · $4,972/yr
- Insurance
- −$183
- Flood insurance flood zone
- −$66 /mo · $798/yr
- HOA
- −$0
- Vacancy / Maint / Mgmt
- −$1,327
- Net cashflow
- $2,025
Break-even live
2-unit breakdown (identical units grouped — click to expand)
| Units | Beds | Baths | Est. rent |
|---|---|---|---|
| 2× units | 2 | 1 | $6,318 |
| #1 | 2 | 1 | $3,159 |
| #2 | 2 | 1 | $3,159 |
| Total (2 units) | $6,317 | ||
UW: 25.0% down · 7.5% · 30yr · 1.5% tax · 5.0% vac · 8.0% maint · 8.0% mgmt
Financing live
Cash to close
- Down payment
- $109,725
- Closing costs
- $13,167
- Reserves months
- —
- Total cash needed
- —
Loan-product check · same deal, 3 products live
Conventional
25% down · 7.5% · 30yr
- Down + closing
- —
- Monthly P&I
- —
- Monthly cashflow
- —
- DSCR
- —
- Eligible?
- —
Personal DTI + credit; lowest rate.
DSCR
20% down · 8.5% · 30yr
- Down + closing
- —
- Monthly P&I
- —
- Monthly cashflow
- —
- DSCR
- —
- Eligible?
- —
No personal income docs; deal must DSCR.
Hard money
10% down · 12.0% · 12mo
- Down + closing
- —
- Monthly P&I
- —
- Monthly cashflow
- —
- DSCR
- —
- Eligible?
- —
Short-term bridge; refi at stabilization.
Rent comps 7 comps
| Address | Beds | Baths | Sqft | Rent | $/sqft | DOM | Units | Dist |
|---|---|---|---|---|---|---|---|---|
| 294 Ridgewood Ave Brooklyn, NY | 4.0 | 2.0 | 1200 | $3,500 | $2.92 | 24d | 1 | 0.63mi |
| 22 Granite St Brooklyn, NY | 4.0 | 2.0 | 586 | $1,150 | $1.96 | 5d | 1 | 1.13mi |
| 60-08 78th Ave Unit 2 Glendale, NY | 3.0 | 1.0 | 2200 | $3,099 | $1.41 | 5d | 1 | 1.33mi |
| 7801 64th St Glendale, NY | 4.0 | 1.0 | 1175 | $3,200 | $2.72 | 24d | 1 | 1.34mi |
| 8825 75th St Woodhaven, NY | 4.0 | 1.5 | 1140 | $4,000 | $3.51 | 24d | 1 | 1.34mi |
| 8825 75th St Woodhaven, NY | 4.0 | 1.5 | 1140 | $4,000 | $3.51 | 8d | 1 | 1.34mi |
| 8836 77th St Woodhaven, NY | 4.0 | 2.0 | 1500 | $4,200 | $2.80 | 24d | 1 | 1.40mi |
Listing history 10 events
-
2026-05-01status Pending
-
2026-04-20$438,900 Active
-
2005-03-25soldstatus $425,200
-
2003-07-01soldstatus $380,000
-
2001-10-03soldstatus $256,000
-
1997-12-10soldstatus $181,000
-
1996-09-19soldstatus $160,000
-
1995-10-06soldstatus $115,000
-
1984-09-01soldstatus $63,500
-
1983-10-01soldstatus $29,000
ⓘ Source: listings_history table (triggers on properties + properties_extension) + one-shot
backfill from property_details.listing_events for pre-trigger history.
Tax reassessment forecast NY · Partial reset (capped growth)
- Current annual tax
- $4,972 · $414/mo
- Projected year-2 tax
- $6,195 · $516/mo
- Expected delta
- +$1,223/yr (+$102/mo · 24.6%)
ⓘ Screening estimate from a state-policy table — verify with the county assessor before closing.
Climate risk First Street
- Flood 9/10 Extreme FEMA zone X (unshaded) · 99% chance over 30 yrs
- Wildfire 1/10 Low
- Heat 7/10 Severe 7 d/yr ≥99°F today · 15 d/yr by 30 yrs out
- Wind 6/10 Major 39% chance of damaging wind over 30 yrs
- Air quality 5/10 Major 6 unhealthy d/yr today · 8 by 30 yrs out
Nearby sold comps map
Loading sold comps map…
Walkable amenities ~0.75 mi
Loading nearby amenities…
Taxation est. · year 1
- Rental income
- $75,804
- − Mortgage interest
- −$24,585
- − Property taxes
- −$4,972
- − Insurance
- −$2,992
- − Repairs & maintenance
- −$6,064
- − Management
- −$6,064
- − Depreciation
- −$12,768
- Taxable income
- $18,358
- Est. tax owed @ 24.0%
- −$4,406
- After-tax cash flow
- $19,895/yr
For passive investors: Depreciation is non-cash, so a rental often shows a tax loss while cash-flowing — sheltering income. Rental losses are passive: they offset passive income freely, and up to $25,000/yr can offset ordinary (W-2) income if you actively participate and your MAGI is under $100k (phasing out to $0 by $150k); unused losses carry forward. On sale, claimed depreciation is recaptured at up to 25%, and gains may owe capital-gains tax (a 1031 exchange can defer both). Figures are a year-1 estimate at your 24.0% rate — not tax advice; consult a CPA.
Schools (NCES district)
No district data.
Livability — New York
- Score
- 75/100
- State rank
- #268
- US rank
- #4188
Category grades
Schools grade is shown separately in the Schools card above.
Census & demographics
- Census place
- New York, NY
- County
- Kings County · 2,614,986 people
- City population
- 7,731,280
- Metro
- New York-Newark-Jersey City, NY-NJ-PA
- Population (ZIP)
- 93,198
- Household income
- $56,523
- Rent vs Own
- Severe rent burden
- 7510.0
Population outlook (Kings County) Hauer SSP2
- Today (2025)
- 2,847,441 people
- By 2030
- 2,937,006 · +3.1%
- By 2040
- 3,095,491 · +8.7%
- By 2050
- 3,228,968 · +13.4%
- By 2075
- 3,321,723 · +16.7%
- By 2100
- 3,111,387 · +9.3%
Race, ethnicity, and origin ACS 2023
- Neighborhood character
- Diverse neighborhood (Simpson 0.59)
- Race & ethnicity
- Black 54% Hispanic / Latino 33% Two or more races 10% White 5% Asian 2%
- Hispanic origin (detail)
- Mexican 3% Puerto Rican 11% Dominican 11%
- Common ancestry
- Hispanic 1% Swiss 1%
- Foreign-born
- 31% · Canada, Mexico, Jamaica
- Languages at home
- 67% English-only · Spanish 27% French/Haitian/Cajun 2% Other Indo-European 1%
Political lean MEDSL · Kings
- 2024 margin
- Solid D (+44.0) · D 72.0% · R 28.0%
- 2008→2024 swing
- -15.5pp toward R · 2008: 59.4pp · 2024: 44.0pp
- All cycles
- 2024: D+44.0 2020: D+54.8 2016: D+61.8 2012: D+63.9 2008: D+59.4
Not yet ingested
- Civics
- —
Market trends
- HPI YoY
- ▼ -138.76%
- Current HPI
- 388.434
- Rent YoY
- ▲ 5.29%
- Metro
- New York-Newark-Jersey City, NY-NJ-PA
- State GDP YoY
- ▲ 2.60%
- F500 in state
- 92
Industry mix (Fortune 500 HQ in NY)
| Industry | F500 HQs | Revenue |
|---|---|---|
| Financial Services | 10 | $950B |
|
||
| Consumer Goods | 9 | $162B |
|
||
| Insurance | 4 | $225B |
|
||
| Telecommunications | 2 | $144B |
|
||
| Pharmaceuticals | 2 | $112B |
|
||
| Media / Entertainment | 2 | $69B |
|
||
Price history
+1413.4% since first listed10 events — show timeline
- 2026-05-01 Pending — OneKey® MLS as Distributed by MLS Grid
- 2026-04-20 Listed $438,900 OneKey® MLS as Distributed by MLS Grid
- 2005-03-25 Sold (Public Records) $425,200 Public Records
- 2003-07-01 Sold (Public Records) $380,000 Public Records
- 2001-10-03 Sold (Public Records) $256,000 Public Records
- 1997-12-10 Sold (Public Records) $181,000 Public Records
- 1996-09-19 Sold (Public Records) $160,000 Public Records
- 1995-10-06 Sold (Public Records) $115,000 Public Records
- 1984-09-01 Sold (Public Records) $63,500 Public Records
- 1983-10-01 Sold (Public Records) $29,000 Public Records
Property tax history
+4.9%/yrLatest (2025): $4,972 · +1.0% YoY. Source: county tax records.
Cash-flow waterfall
monthlySold comps — $/sqft
last 12 mo · ≤1 miLoading sold comps…