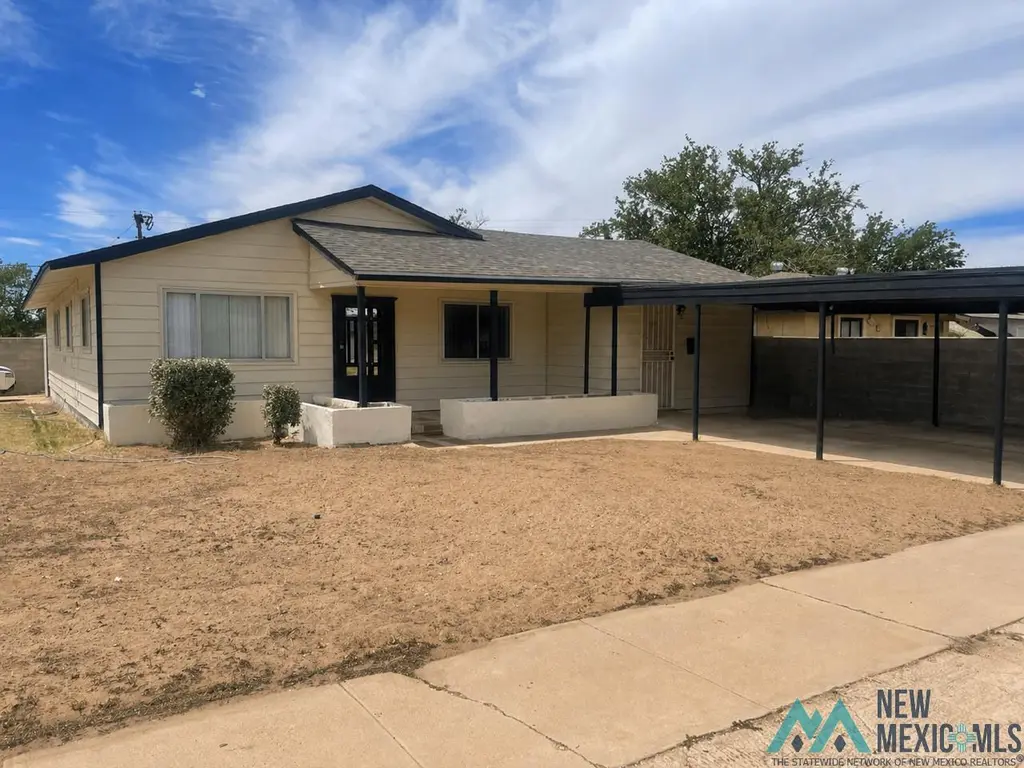
1101 N Llano Dr · Hobbs, NM
Flood risk 7/10 · Major
- FEMA flood zone
- AO
- Chance of flooding over 30 yrs
- 0.98%
- Est. flood insurance / yr
- $848 – $2,087
Fire risk 8/10 · Major
- Est. fire insurance / yr
- $706 – $1,312
Heat risk 5/10 · Moderate
- Hot days now (above 100°F)
- 6 days/yr
- Hot days in 30 yrs
- 16 days/yr
Wind risk 2/10 · Minimal
- Chance of severe wind over 30 yrs
- 1.0%
Air-quality risk 2/10 · Minimal
- Unhealthy air days now
- 1 days/yr
- Unhealthy air days in 30 yrs
- 1 days/yr
Risk factors via First Street. Map © Google.
Why this score? — see what drove the C grade
The composite is a weighted blend of 9 inputs, each scored 0–100. Each bar is that input's sub-score; the figure is the points it added to the 100-point composite (weight × sub-score).
- Cash flow +26.3/30.0
- DSCR +8.9/10.0
- ARV discount +7.5/15.0
- 1% rule +6.0/10.0
- Livability +3.3/5.0
- Rent growth +2.5/5.0
- Schools +2.5/10.0
- Condition / age +2.5/5.0
- Appreciation +0.0/10.0
$200,000
🖨 Deal sheet (PDF) 📄 Offer letter ✓ Due diligence
Listing remarks MLS
Very nice home with lots of space. Roof 2 years old. Water Softener, front sprinkler system. New floors, dishwasher, doors, bathrooms, paint. 2 living areas. Extra large back yard.
Key facts
- 8,145 sq ft lot
- 2 garage spots
- Built 1955
Property features AI
Exterior
- Parking: 2 total parking spaces; 2 covered spaces; Attached carport; 2-car garage
- Utilities: Public water; Electricity connected; Sewer connected
- Home design: Single-family residence; One story / single level
- Construction: Construction materials not specified
- Exterior features: Shingle roof; Irregular lot
Interior
- Kitchen: Dishwasher; Free-standing range
- Flooring: Carpet; Laminate
- Bathrooms: 1 full bathroom; 1 half bathroom
- Heating & cooling: Forced air heating; Electric central air conditioning
- Interior features: Dishwasher; Free-standing range; Gas water heater
- Laundry & utility: Gas water heater
Neighborhood map
What this means for you Summary
Snapshot
- This is a 3-bed/1.5-bath single-family listed at $200k.
Deal economics
- At list price, monthly cash flow is $392 ($5k/yr) — positive.
- The deal already cash-flows at list — no discount required.
- Meets the 1% rule at list price ($2k rent vs $200k).
Location & tenants
- Location reads 66/100 on livability (#37 in NM) — a middle-class / working-renter tenant base. Strengths: cost of living A+, housing A+; Watch: employment D+, crime F, commute F.
- Hobbs Municipal Schools (town): math 17% / reading 31% proficiency, ranked #45 of 95 in NM (top 47%) — low school quality limits family demand, transient renter base, plan for 1-2y turnover.
- Zoned schools: Taylor Elementary (421 students, 100% FRL); Highland Middle School (840 students, 100% FRL); Hobbs High (math 22% / reading 52%, grade F, #70 of 110 statewide, top 63%, 2,216 students, 100% FRL) — zoned schools average 100% FRL vs 52% district-wide (48 pts higher); higher-poverty schools than district average — tighter screening recommended.
- Zoned-school proficiency averages 37% at this address vs 24% district-wide (+13 pts) — the actual schools serving this property are materially stronger than the Hobbs Municipal Schools average implies; a family-tenant draw the district grade alone would hide.
- Market conditions: 235 active listings in the ZIP; 2 comparable units currently listed for rent nearby; 172 units permitted in Lea County in 2024 (0 in 5+ unit buildings).
- This rent runs 42% of the median local income ($63k/yr) — at the standard rent-burdened threshold; future hikes will face affordability resistance.
Forward outlook
- Local home prices are declining (-3.0%/yr); year-one equity from $1k of loan paydown is wiped out by about $6k of value loss. Plan a longer hold.
- Lea County population projected at +50% by 2050 — long-run rental-demand tailwind backs the buy-and-hold thesis.
Negotiation context
- Only 2 days on market — expect competitive offers; lowballing is unlikely to land.
- 2 sale attempts since 10y ago with the ask held roughly flat each time — persistent listings suggest the price (not the market) is what's stuck; bring a comps-based counter.
Risks & watch-outs
- Watch-outs: flood insurance adds $122/mo; built in 1955 — expect roof / HVAC / electrical / plumbing capex.
- Climate carrying-cost: in FEMA flood zone AO (mandatory federal flood insurance); severe wildfire risk; extreme-heat days projected 6→16/yr by 2055 (HVAC capex compounding) — expect insurance premiums to compound above CPI over the hold.
Questions for the listing agent
- Built in 1955 — when were the roof, HVAC, electrical panel, plumbing, and water heater last replaced?
- What's the actual annual flood-insurance premium (NFIP or private), and is the property in a SFHA with mandatory coverage?
- Is there a deadline driving the sale (1031 exchange, divorce, estate, relocation)? That informs how much negotiation room exists.
- Schools are F-rated, which usually means shorter tenancies and higher turnover. Who's the typical renter profile here, and what's been the actual vacancy rate?
- Crime grade is F in this area — have there been break-ins, vandalism, or insurance claims at this property in the last 3 years? What carrier currently insures it and at what premium?
- What's the average days-on-market for RENTAL listings here right now (not sales)? A rising rental-DOM trend means longer vacancies and softer asking-rent achievability than the comps imply.
- What's the recent tenant-quality profile in this submarket — average credit score on applications, eviction rate, late-payment / NSF rate, and stable-employment percentage? A property-management company in the area should have these aggregated.
- How much new for-sale + rental construction is in the pipeline within 1–3 miles? Heavy new supply typically softens prices + rents 12–24 months out; constrained supply supports both.
Investment metrics
- 1% rule
- 1.10% ✓
- Cap rate
- 9.38%
- Cash-on-cash
- 11.03%
- DSCR
- 1.49
- GRM
- 7.6
CMA / ARV
No comps found within radius.
Projected returns pro-forma
-3.0% appreciation · 3.0% rent growth · sell at horizon
- IRR
- -3.5%
- Equity multiple
- 0.87×
- Total profit
- $-7,418
- Equity at exit
- $29,821
- IRR
- 6.2%
- Equity multiple
- 1.46×
- Total profit
- $25,746
- Equity at exit
- $17,292
Cash invested: $56,000 (down + closing). Projections, not guarantees.
Landlord ↔ Tenant lean methodology
- Overall (STATE)
- 55 Moderately Landlord-Leaning
- State New Mexico
- 55 Moderately Landlord-Leaning · D+3
- County
- — inherits STATE
- City
- — inherits STATE
ZIP-level market 88240
- Active inventory
- 235
- Price-to-rent
- 7.6×
Monthly cashflow live
- Estimated rent
- $2,197 medium interval (Pro) →
- Mortgage (P&I)
- −$1,049
- Tax from tax record
- −$89 /mo · $1,067/yr
- Insurance
- −$83
- Flood insurance flood zone
- −$122 /mo · $1,468/yr
- HOA
- −$0
- Vacancy / Maint / Mgmt
- −$461
- Net cashflow
- $392
Break-even live
Sensitivity live
| Price | -10% $505 | -5% $449 | +0% $392 | +5% $336 | +10% $279 |
|---|---|---|---|---|---|
| Rent | -10% $219 | -5% $305 | +0% $392 | +5% $479 | +10% $566 |
| Rate | -1.0pp $493 | -0.5pp $443 | base $392 | +0.5pp $340 | +1.0pp $288 |
UW: 25.0% down · 7.5% · 30yr · 1.5% tax · 5.0% vac · 8.0% maint · 8.0% mgmt
Financing live
Cash to close
- Down payment
- $50,000
- Closing costs
- $6,000
- Reserves months
- —
- Total cash needed
- —
Loan-product check · same deal, 3 products live
Conventional
25% down · 7.5% · 30yr
- Down + closing
- —
- Monthly P&I
- —
- Monthly cashflow
- —
- DSCR
- —
- Eligible?
- —
Personal DTI + credit; lowest rate.
DSCR
20% down · 8.5% · 30yr
- Down + closing
- —
- Monthly P&I
- —
- Monthly cashflow
- —
- DSCR
- —
- Eligible?
- —
No personal income docs; deal must DSCR.
Hard money
10% down · 12.0% · 12mo
- Down + closing
- —
- Monthly P&I
- —
- Monthly cashflow
- —
- DSCR
- —
- Eligible?
- —
Short-term bridge; refi at stabilization.
Rent comps 2 comps
| Address | Beds | Baths | Sqft | Rent | $/sqft | DOM | Units | Dist |
|---|---|---|---|---|---|---|---|---|
| 211 E Alto Dr Hobbs, NM | 3.0 | 2.0 | 2066 | $2,400 | $1.16 | 45d | 1 | 1.06mi |
| 1107 E La Brea Ave Hobbs, NM | 4.0 | 2.0 | 1900 | $3,200 | $1.68 | 45d | 1 | 1.46mi |
Listing history 5 events
-
2026-04-30status Pending
-
2026-04-27$200,000 Active
-
2017-08-24soldstatus 180-char remark
Show marketing remark (180 chars)
Very nice home with lots of space. Roof 2 years old. Water Softener, front sprinkler system. New floors, dishwasher, doors, bathrooms, paint. 2 living areas. Extra large back yard.
-
2016-10-07$120,000 180-char remark
Show marketing remark (180 chars)
Very nice home with lots of space. Roof 2 years old. Water Softener, front sprinkler system. New floors, dishwasher, doors, bathrooms, paint. 2 living areas. Extra large back yard.
-
1997-09-05soldstatus
ⓘ Source: listings_history table (triggers on properties + properties_extension) + one-shot
backfill from property_details.listing_events for pre-trigger history.
Tax reassessment forecast NM · Resets to sale price
- Current annual tax
- $1,067 · $89/mo
- Projected year-2 tax
- $1,600 · $133/mo
- Expected delta
- +$533/yr (+$44/mo · 49.9%)
ⓘ Screening estimate from a state-policy table — verify with the county assessor before closing.
Climate risk First Street
- Flood 7/10 Severe FEMA zone AO · 98% chance over 30 yrs
- Wildfire 8/10 Severe
- Heat 5/10 Major 6 d/yr ≥100°F today · 16 d/yr by 30 yrs out
- Wind 2/10 Low 100% chance of damaging wind over 30 yrs
- Air quality 2/10 Low 1 unhealthy d/yr today · 1 by 30 yrs out
Nearby sold comps map
Loading sold comps map…
Walkable amenities ~0.75 mi
Loading nearby amenities…
Taxation est. · year 1
- Rental income
- $26,364
- − Mortgage interest
- −$11,203
- − Property taxes
- −$1,067
- − Insurance
- −$2,468
- − Repairs & maintenance
- −$2,109
- − Management
- −$2,109
- − Depreciation
- −$5,818
- Taxable income
- $1,589
- Est. tax owed @ 24.0%
- −$381
- After-tax cash flow
- $4,325/yr
For passive investors: Depreciation is non-cash, so a rental often shows a tax loss while cash-flowing — sheltering income. Rental losses are passive: they offset passive income freely, and up to $25,000/yr can offset ordinary (W-2) income if you actively participate and your MAGI is under $100k (phasing out to $0 by $150k); unused losses carry forward. On sale, claimed depreciation is recaptured at up to 25%, and gains may owe capital-gains tax (a 1031 exchange can defer both). Figures are a year-1 estimate at your 24.0% rate — not tax advice; consult a CPA.
Schools (NCES district)
- District
- Hobbs Municipal Schools
- NCES district ID
- 3501260
- Math proficiency
- 17% —
- Reading proficiency
- 31% —
- Median HH income
- $52,575
- Composite
- 24.53/100
- National rank
- #13068
- State rank
- #45 of 95 in NM
Livability — Hobbs
- Score
- 66/100
- State rank
- #37
- US rank
- #11817
Category grades
Schools grade is shown separately in the Schools card above.
Census & demographics
- Census place
- Hobbs, NM
- County
- Lea County · 41,557 people
- City population
- 41,557
- Metro
- Hobbs, NM
- Population (ZIP)
- 41,557
- Household income
- $63,270
- Rent vs Own
- Severe rent burden
- 968.0
Population outlook (Lea County) Hauer SSP2
- Today (2025)
- 84,268 people
- By 2030
- 91,695 · +8.8%
- By 2040
- 108,366 · +28.6%
- By 2050
- 126,264 · +49.8%
- By 2075
- 170,606 · +102.5%
- By 2100
- 199,235 · +136.4%
Race, ethnicity, and origin ACS 2023
- Neighborhood character
- Majority Hispanic (63%)
- Race & ethnicity
- Hispanic / Latino 63% Two or more races 32% White 29% Black 5%
- Hispanic origin (detail)
- Mexican 55%
- Common ancestry
- Italian 2% Lithuanian 1% Slovak 1%
- Foreign-born
- 18% · Canada
- Languages at home
- 57% English-only · Spanish 41% German/W. Germanic 1%
Political lean MEDSL · Lea
- 2024 margin
- Solid R (+61.6) · D 18.5% · R 80.1% · Other 1.3%
- 2008→2024 swing
- -17.4pp toward R · 2008: -44.2pp · 2024: -61.6pp
- All cycles
- 2024: R+61.6 2020: R+59.6 2016: R+48.5 2012: R+49.7 2008: R+44.2
Not yet ingested
- Civics
- —
Market trends
- HPI YoY
- ▼ -246.71%
- Current HPI
- 100.9905
- Rent YoY
- —
- Metro
- Hobbs, NM
- State GDP YoY
- —
- F500 in state
- 0
Price history
+66.7% since first listed5 events — show timeline
- 2026-04-30 Pending — NMMLS
- 2026-04-27 Listed $200,000 NMMLS
- 2017-08-24 Sold (MLS) — NMMLS
- 2016-10-07 Listed $120,000 NMMLS
- 1997-09-05 Sold (Public Records) — Public Records
Property tax history
+3.1%/yrLatest (2025): $1,067 · +1.7% YoY. Source: county tax records.
Cash-flow waterfall
monthlySold comps — $/sqft
last 12 mo · ≤1 miLoading sold comps…