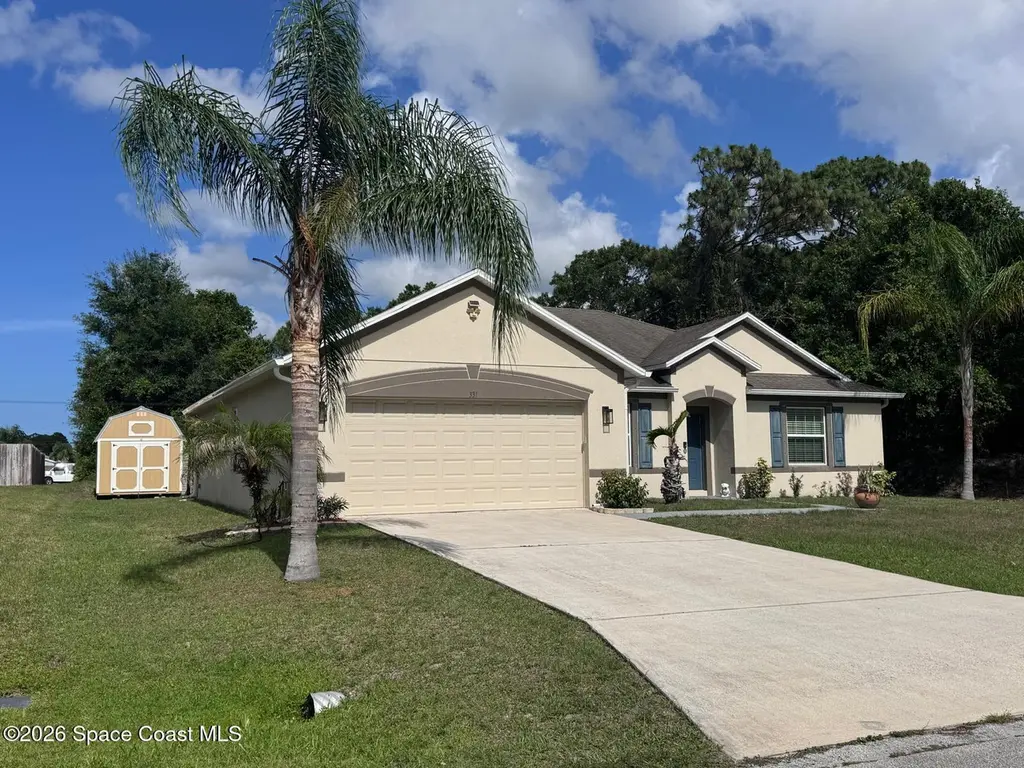
331 Alder Ave SE · Palm Bay, FL
Flood risk 1/10 · Minimal
- FEMA flood zone
- X (unshaded)
- Chance of flooding over 30 yrs
- 0.0%
- Est. flood insurance / yr
- $507 – $1,088
Fire risk 1/10 · Minimal
- Est. fire insurance / yr
- $947 – $1,759
Heat risk 10/10 · Severe
- Hot days now (above 106°F)
- 7 days/yr
- Hot days in 30 yrs
- 22 days/yr
Wind risk 10/10 · Severe
- Chance of severe wind over 30 yrs
- 99.0%
Air-quality risk 1/10 · Minimal
- Unhealthy air days now
- 0 days/yr
- Unhealthy air days in 30 yrs
- 0 days/yr
Risk factors via First Street. Map © Google.
Why this score? — see what drove the D- grade
The composite is a weighted blend of 9 inputs, each scored 0–100. Each bar is that input's sub-score; the figure is the points it added to the 100-point composite (weight × sub-score).
- Appreciation +10.0/10.0
- ARV discount +7.5/15.0
- Cash flow +6.1/30.0
- Schools +4.7/10.0
- Livability +3.6/5.0
- Rent growth +3.4/5.0
- Condition / age +2.5/5.0
- 1% rule +1.4/10.0
- DSCR +0.4/10.0
$339,900
🖨 Deal sheet 📄 Offer letter ✓ Due diligence
Listing remarks MLS
CITY WATER & SEWER! This 2016 home has inviting curb appeal. Upon entering this home you have both a dining room and den/flex space with plenty of natural light on both sides of the foyer. The kitchen boasts cherry cabinets, black appliances and is open concept. Split plan layout and includes a spacious laundry room off the kitchen. The master bath offers double vanity & double sinks. Plenty of storage space between the vanity, walk-in closet and linen closet. The master bedroom has sufficient space for a king size bed and additional furnishings. On the other side of the house are two roomy guest bedrooms. You also have a separate linen closet and additional storage with a double vanity in the guest bathroom. The living space recently received a fresh coat of paint.
Key facts
- 0.23 acre lot
- 2 garage spots
- Built 2016
Neighborhood map
What this means for you Summary
Snapshot
- This is a 3-bed/2.0-bath single-family listed at $340k.
Deal economics
- At list price, monthly cash flow is $-639 ($-8k/yr) — negative.
- To cash-flow at today's rent, offer at most $227k (33.2% below list).
- To meet the 1% rule (rent ≥ 1% of price), the offer needs to be $218k (35.9% below list).
- Recommended offer: $218k (35.9% below list) — sets the bar for 1% rule.
Location & tenants
- Location reads 72/100 on livability (#366 in FL) — a middle-class / working-renter tenant base. Strengths: cost of living A+, housing A+; Watch: employment D+, amenities F, health & safety D-.
- Brevard (suburban): math 53% / reading 57% proficiency, ranked #19 of 73 in FL (top 26%) — acceptable for families but not a draw, mixed tenant base, ~2y average lease.
- Zoned schools: John F. Turner Senior Elementary School (math 38% / reading 43%, grade F, #1,471 of 2,144 statewide, top 69%, 543 students, 69% FRL); Southwest Middle School (math 40% / reading 39%, grade F, #373 of 571 statewide, top 66%, 920 students, 58% FRL); Heritage High School (math 30% / reading 44%, grade F, #340 of 667 statewide, top 52%, 2,007 students, 62% FRL) — zoned schools average 63% FRL vs 43% district-wide (20 pts higher); higher-poverty schools than district average — tighter screening recommended.
- Zoned-school proficiency averages 39% at this address vs 55% district-wide (-16 pts) — the specific schools serving this property underperform the Brevard average; the district grade overstates school quality for this exact location.
- Market conditions: Rents rising (+3.7%/yr); 1111 active listings in the ZIP; 27 comparable units currently listed for rent nearby; rentals at typical pace (median 21d on market — plan ~3-4 weeks tenant-placement turnaround); solid renter incomes; 4,602 units permitted in Brevard County in 2024 (702 in 5+ unit buildings).
- This rent runs 33% of the median local income ($80k/yr) — at the standard rent-burdened threshold; future hikes will face affordability resistance.
Forward outlook
- In year one you build about $36k of equity ($2k loan paydown + $34k appreciation (10.0% local appreciation)).
- Brevard County population projected at +15% by 2050 — modest demand growth; plan on rents tracking national, not racing it.
- By year 2, paydown + projected appreciation supports a ~$58k cash-out refi (75% LTV) — recoverable capital for the next deal without selling this one.
Negotiation context
- Only 10 days on market — expect competitive offers; lowballing is unlikely to land.
- 5 sale attempts since 22y ago; this cycle's ask is 48% above the opening price — seller raised mid-cycle; expect resistance to lowballs.
- Current owner paid $188k; list at $340k implies a 81% gain — meaningful room to come down on a strong offer.
Risks & watch-outs
- Climate carrying-cost: severe wind risk, 99% chance of damaging wind over 30y; extreme-heat days projected 7→22/yr by 2055 (HVAC capex compounding) — expect insurance premiums to compound above CPI over the hold.
Questions for the listing agent
- What do current leases actually rent for vs. the listed asking? Can we see a recent rent roll and the last 12 months of T-12 income?
- Is there a deadline driving the sale (1031 exchange, divorce, estate, relocation)? That informs how much negotiation room exists.
- The area grade is low — what's the realistic commute time and amenity access for the typical tenant pool here? Any planned neighborhood developments (good or bad) we should know about?
- What's the average days-on-market for RENTAL listings here right now (not sales)? A rising rental-DOM trend means longer vacancies and softer asking-rent achievability than the comps imply.
- What's the recent tenant-quality profile in this submarket — average credit score on applications, eviction rate, late-payment / NSF rate, and stable-employment percentage? A property-management company in the area should have these aggregated.
- How much new for-sale + rental construction is in the pipeline within 1–3 miles? Heavy new supply typically softens prices + rents 12–24 months out; constrained supply supports both.
Investment metrics
- 1% rule
- 0.64% ✗
- Cap rate
- 4.04%
- Cash-on-cash
- -8.06%
- DSCR
- 0.64
- GRM
- 13.0
CMA / ARV
No comps found within radius.
Projected returns pro-forma
10.0% appreciation · 3.67% rent growth · sell at horizon
- IRR
- 18.8%
- Equity multiple
- 2.53×
- Total profit
- $145,909
- Equity at exit
- $306,209
- IRR
- 17.5%
- Equity multiple
- 5.88×
- Total profit
- $464,867
- Equity at exit
- $660,351
Cash invested: $95,172 (down + closing). Projections, not guarantees.
Landlord ↔ Tenant lean methodology
- Overall (STATE)
- 87 Strongly Landlord-Friendly
- State Florida
- 87 Strongly Landlord-Friendly · R+3
- County
- — inherits STATE
- City
- — inherits STATE
ZIP-level market 32909
- Home prices YoY
- 6.0%
- Rents YoY
- 3.7%
- Active inventory
- 1111
- Price-to-rent
- 13.0×
Monthly cashflow live
- Estimated rent
- $2,178 high interval (Pro) →
- Mortgage (P&I)
- −$1,782
- Tax from tax record
- −$436 /mo · $5,232/yr
- Insurance
- −$142
- HOA
- −$0
- Vacancy / Maint / Mgmt
- −$457
- Net cashflow
- $-639
Break-even live
UW: 25.0% down · 7.5% · 30yr · 1.5% tax · 5.0% vac · 8.0% maint · 8.0% mgmt
Financing live
Cash to close
- Down payment
- $84,975
- Closing costs
- $10,197
- Reserves months
- —
- Total cash needed
- —
Loan-product check · same deal, 3 products live
Conventional
25% down · 7.5% · 30yr
- Down + closing
- —
- Monthly P&I
- —
- Monthly cashflow
- —
- DSCR
- —
- Eligible?
- —
Personal DTI + credit; lowest rate.
DSCR
20% down · 8.5% · 30yr
- Down + closing
- —
- Monthly P&I
- —
- Monthly cashflow
- —
- DSCR
- —
- Eligible?
- —
No personal income docs; deal must DSCR.
Hard money
10% down · 12.0% · 12mo
- Down + closing
- —
- Monthly P&I
- —
- Monthly cashflow
- —
- DSCR
- —
- Eligible?
- —
Short-term bridge; refi at stabilization.
Rent comps 27 comps
| Address | Beds | Baths | Sqft | Rent | $/sqft | DOM | Units | Dist |
|---|---|---|---|---|---|---|---|---|
| 741 Fairhaven St NE Palm Bay, FL | 2.0 | 2.0 | 1336 | $1,900 | $1.42 | 23d | 1 | 0.47mi |
| 490 Hatcher St SE Palm Bay, FL | 4.0 | 2.0 | 1833 | $2,150 | $1.17 | 21d | 1 | 0.53mi |
| 907 Algardi St SE Palm Bay, FL | 4.0 | 2.0 | 1943 | $2,330 | $1.20 | 23d | 1 | 0.58mi |
| 272 Aquarius Ave SE Palm Bay, FL | 4.0 | 2.0 | 1650 | $1,995 | $1.21 | 23d | 1 | 0.65mi |
| 743 Andrew St SE Palm Bay, FL | 3.0 | 2.0 | 1252 | $1,895 | $1.51 | 23d | 1 | 0.69mi |
| 320 Algiers Ave SE Palm Bay, FL | 3.0 | 2.0 | 1306 | $1,825 | $1.40 | 23d | 1 | 0.75mi |
| 334 Bordeaux Ave NE Palm Bay, FL | 4.0 | 2.0 | 2083 | $2,250 | $1.08 | 14d | 1 | 0.79mi |
| 84 San Filippo Dr SE Palm Bay, FL | 1.0–3.0 | 1.0–2.0 | 1052 | $2,044 | $1.94 | 14d | 30 | 0.93mi |
| 214 Eldron Blvd NE Palm Bay, FL | 3.0 | 2.0 | 1646 | $2,075 | $1.26 | 23d | 1 | 0.97mi |
| 309 Cactus St SE Palm Bay, FL | 4.0 | 2.0 | 1846 | $2,195 | $1.19 | 14d | 1 | 0.98mi |
| 154 Anderson Ave NE Unit 154 Palm Bay, FL | 3.0 | 2.0 | 1414 | $1,800 | $1.27 | 14d | 1 | 1.07mi |
| 481 Firestone St NE Palm Bay, FL | 4.0 | 2.0 | 1504 | $2,100 | $1.40 | 23d | 1 | 1.10mi |
| 1205 Jaslo St SE Palm Bay, FL | 1.0–3.0 | 1.0–2.0 | 992 | $2,245 | $2.26 | 14d | 8 | 1.15mi |
| 171 Okeefe St SE Palm Bay, FL | 3.0 | 2.0 | 1288 | $1,855 | $1.44 | 14d | 1 | 1.19mi |
| 431 Brantley St SE Palm Bay, FL | 3.0 | 2.0 | 1326 | $2,050 | $1.55 | 19d | 1 | 1.22mi |
| 194 Holiday Park Blvd NE Palm Bay, FL | 3.0 | 2.0 | 1404 | $1,695 | $1.21 | 23d | 1 | 1.22mi |
| 296 Croquet Ave NE Palm Bay, FL | 4.0 | 2.0 | 2028 | $2,300 | $1.13 | 21d | 1 | 1.27mi |
| 721 Taluga Ave SE Palm Bay, FL | 3.0 | 2.0 | 1556 | $1,800 | $1.16 | 23d | 1 | 1.28mi |
| 463 Eldron Blvd NE Palm Bay, FL | 4.0 | 2.0 | 1870 | $2,800 | $1.50 | 23d | 1 | 1.29mi |
| 857 Buchanan Ave SE Palm Bay, FL | 3.0 | 2.0 | 1257 | $1,950 | $1.55 | 23d | 1 | 1.32mi |
| 549 Burlington Ave NE Palm Bay, FL | 3.0 | 2.0 | 1608 | $2,075 | $1.29 | 14d | 1 | 1.32mi |
| 710 Avalon St SE Palm Bay, FL | 3.0 | 2.0 | 1378 | $1,995 | $1.45 | 23d | 1 | 1.33mi |
| 896 Talmadge Ave SE Palm Bay, FL | 3.0 | 2.0 | 1263 | $1,900 | $1.50 | 14d | 1 | 1.37mi |
| 885 Talmadge Ave SE Palm Bay, FL | 3.0 | 2.0 | 1787 | $2,300 | $1.29 | 21d | 1 | 1.38mi |
| 829 Tampa Ave SE Palm Bay, FL | 3.0 | 2.0 | 1303 | $1,740 | $1.34 | 23d | 1 | 1.46mi |
| 647 Airoso Rd SE Palm Bay, FL | 4.0 | 3.0 | 2365 | $2,900 | $1.23 | 13d | 1 | 1.49mi |
| 347 Americana Blvd NE Palm Bay, FL | 3.0 | 2.0 | 1372 | $1,900 | $1.38 | 14d | 1 | 1.50mi |
Listing history 8 events
-
2026-06-18days on market $339,900 Coming Soon 10 DOM
-
2026-06-17days on market $339,900 Coming Soon 9 DOM
-
2026-06-16days on market $339,900 Coming Soon 8 DOM
-
2026-06-15days on market $339,900 Coming Soon 7 DOM
-
2026-06-14days on market $339,900 Coming Soon 5 DOM
-
2026-06-10days on market $339,900 Coming Soon 2 DOM
-
2026-06-09remarks 699-char remark
-
2026-06-09$339,900 Coming Soon 1 DOM
ⓘ Source: listings_history table (triggers on properties + properties_extension) + one-shot
backfill from property_details.listing_events for pre-trigger history.
Tax reassessment forecast FL · Resets to sale price
- Current annual tax
- $5,232 · $436/mo
- Projected year-2 tax
- $5,232 · $436/mo
- Expected delta
- $0/yr ($0/mo · 0.0%)
ⓘ Screening estimate from a state-policy table — verify with the county assessor before closing.
Climate risk First Street
- Flood 1/10 Low FEMA zone X (unshaded) · 0% chance over 30 yrs
- Wildfire 1/10 Low
- Heat 10/10 Extreme 7 d/yr ≥106°F today · 22 d/yr by 30 yrs out
- Wind 10/10 Extreme 99% chance of damaging wind over 30 yrs
- Air quality 1/10 Low 0 unhealthy d/yr today · 0 by 30 yrs out
Nearby sold comps map
Loading sold comps map…
Walkable amenities ~0.75 mi
Loading nearby amenities…
Taxation est. · year 1
- Rental income
- $26,136
- − Mortgage interest
- −$19,040
- − Property taxes
- −$5,232
- − Insurance
- −$1,700
- − Repairs & maintenance
- −$2,091
- − Management
- −$2,091
- − Depreciation
- −$9,888
- Taxable loss
- −$13,905
- Est. tax savings @ 24.0%
- +$3,337
- After-tax cash flow
- $-4,336/yr
For passive investors: Depreciation is non-cash, so a rental often shows a tax loss while cash-flowing — sheltering income. Rental losses are passive: they offset passive income freely, and up to $25,000/yr can offset ordinary (W-2) income if you actively participate and your MAGI is under $100k (phasing out to $0 by $150k); unused losses carry forward. On sale, claimed depreciation is recaptured at up to 25%, and gains may owe capital-gains tax (a 1031 exchange can defer both). Figures are a year-1 estimate at your 24.0% rate — not tax advice; consult a CPA.
Schools (NCES district)
- District
- Brevard
- NCES district ID
- 1200150
- Math proficiency
- 53% ▼ -9.00%
- Reading proficiency
- 57% ▼ -4.00%
- Median HH income
- $49,426
- Composite
- 46.86/100
- National rank
- #2370
- State rank
- #19 of 73 in FL
Livability — Palm Bay
- Score
- 72/100
- State rank
- #366
- US rank
- #6458
Category grades
Schools grade is shown separately in the Schools card above.
Census & demographics
- Census place
- Palm Bay, FL
- County
- Brevard County · 602,871 people
- City population
- 132,211
- Metro
- Palm Bay-Melbourne-Titusville, FL
- Population (ZIP)
- 41,804
- Household income
- $79,977
- Rent vs Own
- Severe rent burden
- 697.0
Population outlook (Brevard County) Hauer SSP2
- Today (2025)
- 623,254 people
- By 2030
- 648,420 · +4.0%
- By 2040
- 690,009 · +10.7%
- By 2050
- 715,669 · +14.8%
- By 2075
- 775,744 · +24.5%
- By 2100
- 776,687 · +24.6%
Race, ethnicity, and origin ACS 2023
- Neighborhood character
- Diverse neighborhood (Simpson 0.70)
- Race & ethnicity
- White 46% Black 21% Hispanic / Latino 20% Two or more races 16% Asian 4%
- Hispanic origin (detail)
- Mexican 2% Puerto Rican 8% Cuban 5%
- Common ancestry
- Hispanic 3% Slovak 2% Lithuanian 2%
- Foreign-born
- 17% · Canada, China, Jamaica
- Languages at home
- 84% English-only · Spanish 9% French/Haitian/Cajun 4% Chinese 1%
Political lean MEDSL · Brevard
- 2024 margin
- Strong R (+20.8) · D 39.1% · R 59.9% · Other 1.0%
- 2008→2024 swing
- -10.4pp toward R · 2008: -10.4pp · 2024: -20.8pp
- All cycles
- 2024: R+20.8 2020: R+16.4 2016: R+19.8 2012: R+12.7 2008: R+10.4
Not yet ingested
- Civics
- —
Market trends
- HPI YoY
- ▲ 18.81%
- Current HPI
- 330.8595
- Rent YoY
- ▲ 3.67%
- Metro
- Palm Bay-Melbourne-Titusville, FL
- State GDP YoY
- ▲ 3.28%
- F500 in state
- 36
Industry mix (Fortune 500 HQ in FL)
| Industry | F500 HQs | Revenue |
|---|---|---|
| Industrial Technology | 2 | $29B |
|
||
| Insurance | 2 | $17B |
|
||
| Retail | 1 | $60B |
|
||
| Technology Distribution | 1 | $58B |
|
||
| Homebuilding | 1 | $35B |
|
||
| Technology Manufacturing | 1 | $35B |
|
||
Price history
+782.9% since first listed13 events — show timeline
- 2026-06-08 Coming Soon $339,900 SCMLS
- 2020-03-26 Listing Removed — SCMLS
- 2019-10-02 Listed $229,900 SCMLS
- 2016-08-16 Listing Removed — SCMLS
- 2016-06-24 Sold (MLS) $187,811 SCMLS
- 2015-11-11 Listed $187,990 SCMLS
- 2015-09-25 Sold (Public Records) $13,500 Public Records
- 2015-09-24 Sold (MLS) $13,500 SCMLS
- 2015-07-15 Listed $14,900 SCMLS
- 2010-09-17 Listed $12,000 SCMLS
- 2005-05-26 Sold (Public Records) $35,000 Public Records
- 2005-05-18 Sold (MLS) $35,000 SCMLS
- 2004-12-11 Listed $38,500 SCMLS
Property tax history
+39.5%/yrLatest (2025): $5,232 · -0.7% YoY. Source: county tax records.
Cash-flow waterfall
monthlySold comps — $/sqft
last 12 mo · ≤1 miLoading sold comps…