 Multi-family
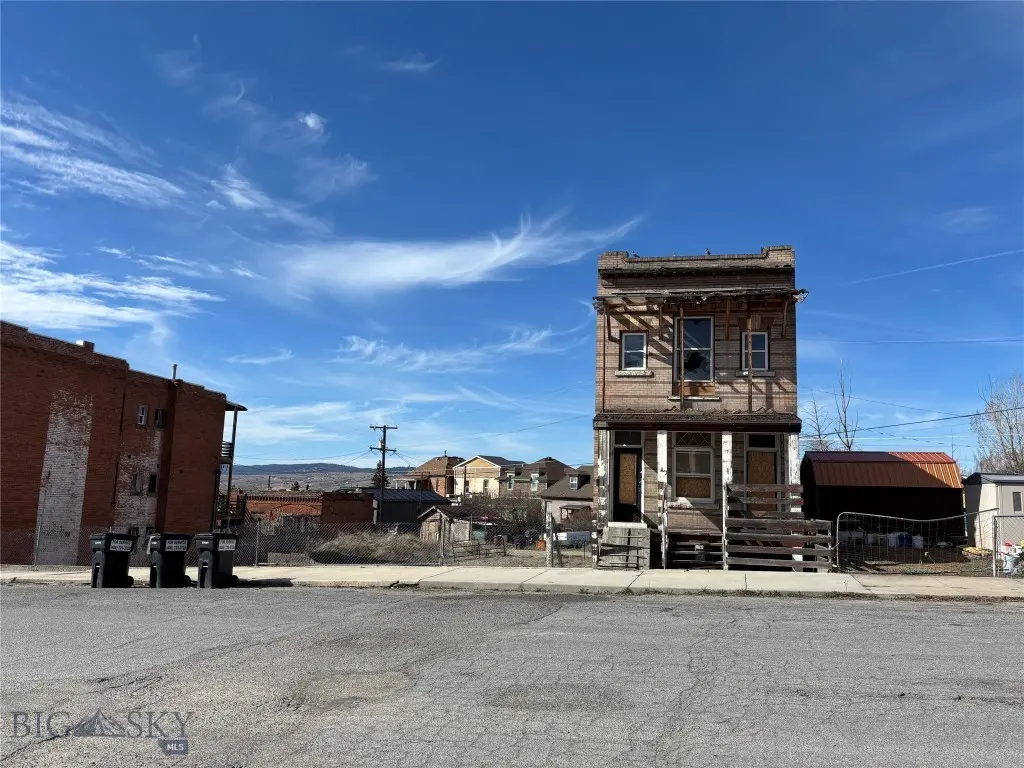
711 Maryland Ave · Butte-Silver Bow (balance), MT
Flood risk 1/10 · Minimal
- FEMA flood zone
- X (unshaded)
- Chance of flooding over 30 yrs
- 0.0%
- Est. flood insurance / yr
- $473 – $860
Fire risk 5/10 · Moderate
- Est. fire insurance / yr
- $918 – $1,706
Heat risk 2/10 · Minimal
- Hot days now (above 86°F)
- 7 days/yr
- Hot days in 30 yrs
- 17 days/yr
Wind risk 1/10 · Minimal
- Chance of severe wind over 30 yrs
- —
Air-quality risk 9/10 · Severe
- Unhealthy air days now
- 19 days/yr
- Unhealthy air days in 30 yrs
- 26 days/yr
Risk factors via First Street. Map © Google.
Why this score? — see what drove the B grade
The composite is a weighted blend of 9 inputs, each scored 0–100. Each bar is that input's sub-score; the figure is the points it added to the 100-point composite (weight × sub-score).
- Cash flow +30.0/30.0
- 1% rule +10.0/10.0
- DSCR +10.0/10.0
- ARV discount +7.5/15.0
- Rent growth +5.0/5.0
- Schools +3.1/10.0
- Livability +2.5/5.0
- Condition / age +2.5/5.0
- Appreciation +0.0/10.0
$125,000
🖨 Deal sheet (PDF) 📄 Offer letter ✓ Due diligence
Multi-family units
County records classify this as Multi-Family (2-4 Unit). Listing-text estimate: 1 unit. estimate disagrees with records
Listing remarks MLS
711 Maryland Ave presents a triplex located on lots 4-6, totalling over 10,000 sf of land and plenty of potential for its next chapter. The property is ready for a full remodel and may also appeal to those exploring redevelopment possibilities. There is an engineer report available for review. Buyers to verify Zoning, condition and any future use plans. Property is being offered in "as-is" condition.
Key facts
- Full remodel
- Engineer report
- Triplex
Tags
Property features AI
Exterior
- Parking: One parking space per unit
- Utilities: Public water; Public sewer; Sewer and water service available
- Home design: Residential income property — triplex; Three or more levels
- Exterior features: Partial fencing; South-facing
Interior
- Heating & cooling: Natural gas heating; No air conditioning
- Interior features: Middle unit, ground unit, and end unit configuration (triplex units)
Neighborhood map
What this means for you Summary
Snapshot
- This is a 3-bed/3.0-bath multifamily listed at $125k.
Deal economics
- At list price, monthly cash flow is $2k ($25k/yr) — positive.
- The deal already cash-flows at list — no discount required.
- Meets the 1% rule at list price ($4k rent vs $125k).
- Recommended offer: $118k (6.0% below list) — sets the bar for market timing.
- Cap rate 26.5% vs local median 2.9% in Butte-Silver Bow (balance) — top-decile yield for the area; either an underpriced asset or a hidden risk that comps aren't pricing in. Stress-test before assuming the spread holds.
Location & tenants
- Location reads: area grade B — affects rentability + tenant quality, not the cash-flow math above.
- Butte H S (town): math 24% / reading 50% proficiency, ranked #73 of 116 in MT (top 63%) — families likely to look elsewhere, expect single-tenant / working-renter base with shorter leases.
- Zoned schools: Kennedy School (math 22% / reading 37%, grade F, #223 of 293 statewide, top 79%, 246 students, 0% FRL); East Middle School (math 26% / reading 44%, grade F, #85 of 146 statewide, top 59%, 660 students, 0% FRL); Butte High School (math 24% / reading 50%, grade F, #48 of 132 statewide, top 37%, 1,317 students, 0% FRL).
- Market conditions: Rents rising fast (+10.4%/yr); 325 active listings in the ZIP; 109 units permitted in Silver Bow County in 2024 (25 in 5+ unit buildings).
- At $3,640/mo this rent would consume 72% of the median local household income ($60k/yr) (locally 1060% of renters already pay >50% of income on rent) — very limited rent-growth headroom before tenants either downsize or default.
Forward outlook
- Local home prices are declining (-3.0%/yr); year-one equity from $864 of loan paydown is wiped out by about $4k of value loss. Plan a longer hold.
- Silver Bow County population projected at +8% by 2050 — modest demand growth; plan on rents tracking national, not racing it.
- At projected returns (-3.0% appreciation + 8.0% rent growth), your $35k cash investment doubles in ~2 years — after that, you're playing with house money.
Negotiation context
- It's been on market 74 days — a 6% lower offer ($118k) is reasonable based on typical stale-listing flexibility.
- 4 sale attempts since 5y ago with the ask held roughly flat each time — persistent listings suggest the price (not the market) is what's stuck; bring a comps-based counter.
Risks & watch-outs
- Watch-outs: built in 1910 — expect roof / HVAC / electrical / plumbing capex.
- Climate carrying-cost: moderate wildfire risk — expect insurance premiums to compound above CPI over the hold.
Questions for the listing agent
- It's been on market 74 days. Have you received any prior offers? Is the seller open to a 6% concession, seller financing, or rate buy-down credit?
- Built in 1910 — when were the roof, HVAC, electrical panel, plumbing, and water heater last replaced?
- Why hasn't it sold? Are there any deal-killer items the seller is aware of (foundation, flood, title, zoning, code violations)?
- Is there a deadline driving the sale (1031 exchange, divorce, estate, relocation)? That informs how much negotiation room exists.
- What's the average days-on-market for RENTAL listings here right now (not sales)? A rising rental-DOM trend means longer vacancies and softer asking-rent achievability than the comps imply.
- What's the recent tenant-quality profile in this submarket — average credit score on applications, eviction rate, late-payment / NSF rate, and stable-employment percentage? A property-management company in the area should have these aggregated.
- How much new apartment / multifamily construction is in the pipeline within 1–3 miles? Heavy new supply (>2% of stock underway) typically softens rents 12–24 months out; light construction supports rent growth.
Investment metrics
- 1% rule
- 2.91% ✓
- Cap rate
- 26.53%
- Cash-on-cash
- 72.26%
- DSCR
- 4.22
- GRM
- 2.9
CMA / ARV
No comps found within radius.
Projected returns pro-forma
-3.0% appreciation · 8.0% rent growth · sell at horizon
- IRR
- 77.4%
- Equity multiple
- 4.81×
- Total profit
- $133,216
- Equity at exit
- $18,638
- IRR
- 82.3%
- Equity multiple
- 11.75×
- Total profit
- $376,394
- Equity at exit
- $10,808
Cash invested: $35,000 (down + closing). Projections, not guarantees.
Landlord ↔ Tenant lean methodology
- Overall (STATE)
- 82 Strongly Landlord-Friendly
- State Montana
- 82 Strongly Landlord-Friendly · R+11
- County
- — inherits STATE
- City
- — inherits STATE
ZIP-level market 59701
- Home prices YoY
- -30.7%
- Rents YoY
- 10.4%
- Active inventory
- 325
- Price-to-rent
- 8.6×
Monthly cashflow live
- Estimated rent
- $3,640 medium interval (Pro) →
- Mortgage (P&I)
- −$656
- Tax from tax record
- −$60 /mo · $724/yr
- Insurance
- −$52
- HOA
- −$0
- Lot rent
- −$0
- Vacancy / Maint / Mgmt
- −$764
- Net cashflow
- $2,108
Break-even live
Sensitivity live
| Price | -10% $2,178 | -5% $2,143 | +0% $2,108 | +5% $2,072 | +10% $2,037 |
|---|---|---|---|---|---|
| Rent | -10% $1,820 | -5% $1,964 | +0% $2,108 | +5% $2,251 | +10% $2,395 |
| Rate | -1.0pp $2,171 | -0.5pp $2,139 | base $2,108 | +0.5pp $2,075 | +1.0pp $2,042 |
3-unit breakdown (identical units grouped — click to expand)
| Units | Beds | Baths | Est. rent |
|---|---|---|---|
| 3× units | 1 | 1 | $3,639 |
| #1 | 1 | 1 | $1,213 |
| #2 | 1 | 1 | $1,213 |
| #3 | 1 | 1 | $1,213 |
| Total (3 units) | $3,640 | ||
UW: 25.0% down · 7.5% · 30yr · 1.5% tax · 5.0% vac · 8.0% maint · 8.0% mgmt
Financing live
Cash to close
- Down payment
- $31,250
- Closing costs
- $3,750
- Reserves months
- —
- Total cash needed
- —
Loan-product check · same deal, 3 products live
Conventional
25% down · 7.5% · 30yr
- Down + closing
- —
- Monthly P&I
- —
- Monthly cashflow
- —
- DSCR
- —
- Eligible?
- —
Personal DTI + credit; lowest rate.
DSCR
20% down · 8.5% · 30yr
- Down + closing
- —
- Monthly P&I
- —
- Monthly cashflow
- —
- DSCR
- —
- Eligible?
- —
No personal income docs; deal must DSCR.
Hard money
10% down · 12.0% · 12mo
- Down + closing
- —
- Monthly P&I
- —
- Monthly cashflow
- —
- DSCR
- —
- Eligible?
- —
Short-term bridge; refi at stabilization.
Listing history 30 events
-
2026-06-22days on market $125,000 Active 74 DOM
-
2026-06-21days on market $125,000 Active 73 DOM
-
2026-06-19days on market $125,000 Active 71 DOM
-
2026-06-18days on market $125,000 Active 70 DOM
-
2026-06-17days on market $125,000 Active 69 DOM
-
2026-06-16days on market $125,000 Active 68 DOM
-
2026-06-15days on market $125,000 Active 67 DOM
-
2026-06-14days on market $125,000 Active 65 DOM
-
2026-06-12days on market $125,000 Active 64 DOM
-
2026-06-09days on market $125,000 Active 61 DOM
-
2026-06-08days on market $125,000 Active 60 DOM
-
2026-06-07days on market $125,000 Active 59 DOM
-
2026-06-05days on market $125,000 Active 56 DOM
-
2026-06-03days on market $125,000 Active 55 DOM
-
2026-06-02days on market $125,000 Active 54 DOM
-
2026-06-01days on market $125,000 Active 53 DOM
-
2026-05-31days on market $125,000 Active 52 DOM
-
2026-05-30days on market $125,000 Active 51 DOM
-
2026-04-09$125,000 Active
Show marketing remark (413 chars)
711 Maryland Ave presents a triplex located on lots 4-6, totalling over 10,000 sf of land and plenty of potential for its next chapter. The property is ready for a full remodel and may also appeal to those exploring redevelopment possibilities. There is an engineer report available for review. Buyers to verify Zoning, condition and any future use plans. Property is being offered in "as-is" condition.
-
2026-04-09$125,000 Active 413-char remark
Show marketing remark (413 chars)
711 Maryland Ave presents a triplex located on lots 4-6, totalling over 10,000 sf of land and plenty of potential for its next chapter. The property is ready for a full remodel and may also appeal to those exploring redevelopment possibilities. There is an engineer report available for review. Buyers to verify Zoning, condition and any future use plans. Property is being offered in "as-is" condition.
-
2024-05-24soldstatus Closed 360-char remark
Show marketing remark (360 chars)
So many possibilities. This could be a building site, or you could renovate this triplex its all up to you. If you decide to renovate, the tri plex has new electric to all three units. This property could be perfect for single family homes or a duplex. The choice is yours! With some hard work and imagination, you could have a great income producing property.
-
2024-05-24soldstatus
Show marketing remark (360 chars)
So many possibilities. This could be a building site, or you could renovate this triplex its all up to you. If you decide to renovate, the tri plex has new electric to all three units. This property could be perfect for single family homes or a duplex. The choice is yours! With some hard work and imagination, you could have a great income producing property.
-
2024-05-22status Pending 360-char remark
Show marketing remark (360 chars)
So many possibilities. This could be a building site, or you could renovate this triplex its all up to you. If you decide to renovate, the tri plex has new electric to all three units. This property could be perfect for single family homes or a duplex. The choice is yours! With some hard work and imagination, you could have a great income producing property.
-
2024-04-06$110,000 Active 360-char remark
Show marketing remark (360 chars)
So many possibilities. This could be a building site, or you could renovate this triplex its all up to you. If you decide to renovate, the tri plex has new electric to all three units. This property could be perfect for single family homes or a duplex. The choice is yours! With some hard work and imagination, you could have a great income producing property.
-
2021-09-24soldstatus
-
2021-09-24soldstatus
-
2021-04-12$89,000
-
2020-06-19soldstatus
-
2008-02-14soldstatus
-
2003-08-22soldstatus
ⓘ Source: listings_history table (triggers on properties + properties_extension) + one-shot
backfill from property_details.listing_events for pre-trigger history.
Tax reassessment forecast MT · Resets to sale price
- Current annual tax
- $724 · $60/mo
- Projected year-2 tax
- $1,050 · $88/mo
- Expected delta
- +$326/yr (+$27/mo · 45.0%)
ⓘ Screening estimate from a state-policy table — verify with the county assessor before closing.
Climate risk First Street
- Flood 1/10 Low FEMA zone X (unshaded) · 0% chance over 30 yrs
- Wildfire 5/10 Major
- Heat 2/10 Low 7 d/yr ≥86°F today · 17 d/yr by 30 yrs out
- Wind 1/10 Low
- Air quality 9/10 Extreme 19 unhealthy d/yr today · 26 by 30 yrs out
Nearby sold comps map
Loading sold comps map…
Walkable amenities ~0.75 mi
Loading nearby amenities…
Taxation est. · year 1
- Rental income
- $43,680
- − Mortgage interest
- −$7,002
- − Property taxes
- −$724
- − Insurance
- −$625
- − Repairs & maintenance
- −$3,494
- − Management
- −$3,494
- − Depreciation
- −$3,636
- Taxable income
- $24,704
- Est. tax owed @ 24.0%
- −$5,929
- After-tax cash flow
- $19,363/yr
For passive investors: Depreciation is non-cash, so a rental often shows a tax loss while cash-flowing — sheltering income. Rental losses are passive: they offset passive income freely, and up to $25,000/yr can offset ordinary (W-2) income if you actively participate and your MAGI is under $100k (phasing out to $0 by $150k); unused losses carry forward. On sale, claimed depreciation is recaptured at up to 25%, and gains may owe capital-gains tax (a 1031 exchange can defer both). Figures are a year-1 estimate at your 24.0% rate — not tax advice; consult a CPA.
Schools (NCES district)
- District
- Butte H S
- NCES district ID
- 3005310
- Math proficiency
- 24% ▼ -7.00%
- Reading proficiency
- 50% ▲ 1.00%
- Median HH income
- $37,852
- Composite
- 30.74/100
- National rank
- #6162
- State rank
- #73 of 116 in MT
Livability — Butte-Silver Bow (balance)
No livability data for this city. (Only ~50 U.S. cities are tracked.)
Census & demographics
- Census place
- Butte-Silver Bow (balance), MT
- County
- Silver Bow County · 34,232 people
- City population
- 35,306
- Metro
- Butte-Silver Bow, MT
- Population (ZIP)
- 34,232
- Household income
- $60,437
- Rent vs Own
- Severe rent burden
- 1060.0
Population outlook (Silver Bow County) Hauer SSP2
- Today (2025)
- 35,745 people
- By 2030
- 36,359 · +1.7%
- By 2040
- 37,490 · +4.9%
- By 2050
- 38,593 · +8.0%
- By 2075
- 43,773 · +22.5%
- By 2100
- 48,513 · +35.7%
Race, ethnicity, and origin ACS 2023
- Neighborhood character
- Predominantly White (89%)
- Race & ethnicity
- White 89% Two or more races 6% Hispanic / Latino 5% Native American 2%
- Common ancestry
- Portuguese 5% Lithuanian 3% Slovak 2%
- Foreign-born
- 1%
- Languages at home
- 97% English-only · Korean 1% Arabic 1%
Political lean MEDSL · Silver Bow
- 2024 margin
- Lean D (+7.0) · D 51.5% · R 44.5% · Other 4.0%
- 2008→2024 swing
- -33.4pp toward R · 2008: 40.4pp · 2024: 7.0pp
- All cycles
- 2024: D+7.0 2020: D+14.1 2016: D+14.2 2012: D+32.5 2008: D+40.4
Not yet ingested
- Civics
- —
Market trends
- HPI YoY
- ▼ -119.08%
- Current HPI
- 268.4972
- Rent YoY
- ▲ 10.44%
- Metro
- Butte-Silver Bow, MT
- State GDP YoY
- ▲ 3.41%
- F500 in state
- 2
Industry mix (Fortune 500 HQ in MT)
| Industry | F500 HQs | Revenue |
|---|---|---|
| Technology / Analytics | 1 | $2B |
|
||
Price history
+40.4% since first listed12 events — show timeline
- 2026-04-09 Listed $125,000 BSCMLS
- 2026-04-09 Listed $125,000 MRMLS
- 2024-05-24 Sold (Public Records) — Public Records
- 2024-05-24 Sold (MLS) — BSCMLS
- 2024-05-22 Pending — BSCMLS
- 2024-04-06 Listed $110,000 BSCMLS
- 2021-09-24 Sold (Public Records) — Public Records
- 2021-09-24 Sold (MLS) — BSCMLS
- 2021-04-12 Listed $89,000 BSCMLS
- 2020-06-19 Sold (Public Records) — Public Records
- 2008-02-14 Sold (Public Records) — Public Records
- 2003-08-22 Sold (Public Records) — Public Records
Property tax history
+5.7%/yrLatest (2025): $724 · -10.4% YoY. Source: county tax records.
Cash-flow waterfall
monthlySold comps — $/sqft
last 12 mo · ≤1 miLoading sold comps…