13235 Oxeye Ln · Ruskin, FL
Flood risk No data
- FEMA flood zone
- —
- Chance of flooding over 30 yrs
- —
- Est. flood insurance / yr
- —
Fire risk No data
- Est. fire insurance / yr
- —
Heat risk No data
- Hot days now (above threshold)
- —
- Hot days in 30 yrs
- —
Wind risk No data
- Chance of severe wind over 30 yrs
- —
Air-quality risk No data
- Unhealthy air days now
- —
- Unhealthy air days in 30 yrs
- —
Risk factors via First Street. Map © Google.
Why this score? — see what drove the D- grade
The composite is a weighted blend of 9 inputs, each scored 0–100. Each bar is that input's sub-score; the figure is the points it added to the 100-point composite (weight × sub-score).
- Cash flow +9.9/30.0
- ARV discount +7.5/15.0
- Schools +4.4/10.0
- Livability +3.6/5.0
- 1% rule +3.0/10.0
- DSCR +2.8/10.0
- Condition / age +2.5/5.0
- Rent growth +2.3/5.0
- Appreciation +0.0/10.0
$386,459
🖨 Deal sheet 📄 Offer letter ✓ Due diligence
Listing remarks
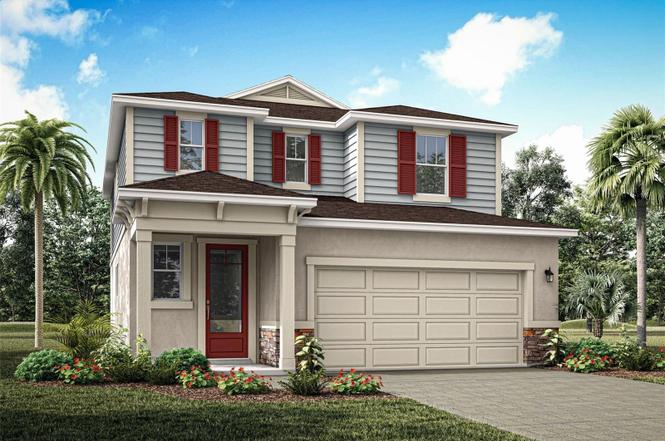
Pre-Construction. To be built. The Woodruff is a spacious and thoughtfully designed two-story home offering just over 2,300 square feet of open-concept living, perfect for families and entertainers alike. With a flowing layout that maximizes every square foot, this home brings comfort, function, and style together in one inviting package. As you enter through the foyer, you’re welcomed into a large, open main floor where the kitchen, dining area, and great room seamlessly connect. The kitchen is a dream for any home chef, spanning two full walls and offering abundant shaker style white cabinets, generous counterspace in durable quartz, and a walk-in pantry for all your storage needs.
Key facts
- Open concept living
- Covered lanai
- Main floor flex room
Tags
Property features AI
Finance
- Other: CDD applies; Lease restrictions apply
- HOA & community: Monthly association fee $15 (includes pool); Association amenities: gated community, pool, playground, pickleball court(s), dog park, sidewalks, street lights; Deed restrictions
Exterior
- Parking: Attached 2-car garage (20 x 20)
- Utilities: Public water; Public sewer; Electricity connected; Natural gas connected; Cable connected; Underground utilities; Water connected; Sewer connected
- Home design: Single family residence; New construction (projected completion May 2026); One story; Faces west; Under construction
- Construction: Block, frame, stucco and cement siding construction; Shingle roof; Slab foundation; Built by Mattamy Homes (Woodruff Coastal model)
- Exterior features: Covered rear porch; Sliding doors; Sidewalks; Paved lot/driveway; Trees / landscaped; Florida-friendly / native landscaping
Interior
- Kitchen: Dishwasher; Range; Microwave; Refrigerator
- Bedrooms: 4 bedrooms; Loft (additional room)
- Flooring: Carpet; Tile
- Bathrooms: 3 full bathrooms
- Heating & cooling: Electric heating; Heat pump; Central air conditioning
- Interior features: Eat-in kitchen; Open floorplan; Solid surface counters; Split bedroom layout; Thermostat; In-wall pest / pest guard system; Walk-in closets; Double pane insulated windows
- Laundry & utility: Laundry room with washer and dryer hookups; Gas dryer hookup; Tankless water heater
Neighborhood map
What this means for you Summary
Snapshot
- This is a 4-bed/3.0-bath land listed at $386k.
Deal economics
- At list price, monthly cash flow is $-238 ($-3k/yr) — negative.
- To cash-flow at today's rent, offer at most $352k (8.9% below list).
- To meet the 1% rule (rent ≥ 1% of price), the offer needs to be $310k (19.8% below list).
- Recommended offer: $310k (19.8% below list) — sets the bar for 1% rule.
Location & tenants
- Location reads 71/100 on livability (#392 in FL) — a middle-class / working-renter tenant base. Strengths: cost of living A+, housing A+, commute B+; Watch: schools F, amenities F, health & safety F.
- Manatee (suburban): math 54% / reading 50% proficiency, ranked #26 of 73 in FL (top 36%) — acceptable for families but not a draw, mixed tenant base, ~2y average lease.
- Market conditions: Rents soft (-0.9%/yr); 2170 active listings in the ZIP; 9 comparable units currently listed for rent nearby; rentals leasing fast (median 12d on market — plan ~1-2 weeks tenant-placement turnaround); high-income renter base; 7,472 units permitted in Manatee County in 2024 (1,782 in 5+ unit buildings).
- This rent runs 33% of the median local income ($114k/yr) — at the standard rent-burdened threshold; future hikes will face affordability resistance.
Forward outlook
- Local home prices are declining (-3.0%/yr); year-one equity from $3k of loan paydown is wiped out by about $12k of value loss. Plan a longer hold.
- Manatee County population projected at +43% by 2050 — long-run rental-demand tailwind backs the buy-and-hold thesis.
Negotiation context
- It's been on market 182 days — a 12% lower offer ($340k) is reasonable based on typical stale-listing flexibility.
Questions for the listing agent
- What do current leases actually rent for vs. the listed asking? Can we see a recent rent roll and the last 12 months of T-12 income?
- It's been on market 182 days. Have you received any prior offers? Is the seller open to a 20% concession, seller financing, or rate buy-down credit?
- What does the HOA fee cover, when was the last increase, and are there any pending special assessments or reserve-fund shortfalls?
- Why hasn't it sold? Are there any deal-killer items the seller is aware of (foundation, flood, title, zoning, code violations)?
- Is there a deadline driving the sale (1031 exchange, divorce, estate, relocation)? That informs how much negotiation room exists.
- Schools are F-rated, which usually means shorter tenancies and higher turnover. Who's the typical renter profile here, and what's been the actual vacancy rate?
- The area grade is low — what's the realistic commute time and amenity access for the typical tenant pool here? Any planned neighborhood developments (good or bad) we should know about?
- What's the average days-on-market for RENTAL listings here right now (not sales)? A rising rental-DOM trend means longer vacancies and softer asking-rent achievability than the comps imply.
- What's the recent tenant-quality profile in this submarket — average credit score on applications, eviction rate, late-payment / NSF rate, and stable-employment percentage? A property-management company in the area should have these aggregated.
- How much new for-sale + rental construction is in the pipeline within 1–3 miles? Heavy new supply typically softens prices + rents 12–24 months out; constrained supply supports both.
Investment metrics
- 1% rule
- 0.80% ✗
- Cap rate
- 5.55%
- Cash-on-cash
- -2.64%
- DSCR
- 0.88
- GRM
- 10.4
CMA / ARV
No comps found within radius.
Projected returns pro-forma
-3.0% appreciation · 0.0% rent growth · sell at horizon
- IRR
- -24.1%
- Equity multiple
- 0.20×
- Total profit
- $-86,799
- Equity at exit
- $57,622
- IRR
- -31.1%
- Equity multiple
- -0.20×
- Total profit
- $-129,958
- Equity at exit
- $33,414
Cash invested: $108,209 (down + closing). Projections, not guarantees.
Landlord ↔ Tenant lean methodology
- Overall (STATE)
- 87 Strongly Landlord-Friendly
- State Florida
- 87 Strongly Landlord-Friendly · R+3
- County
- — inherits STATE
- City
- — inherits STATE
ZIP-level market 34219
- Home prices YoY
- -23.7%
- Rents YoY
- -0.9%
- Active inventory
- 2170
- Price-to-rent
- 10.4×
Monthly cashflow live
- Estimated rent
- $3,099 high interval (Pro) →
- Mortgage (P&I)
- −$2,027
- Tax est. 1.5%
- −$483 /mo · $5,797/yr
- Insurance
- −$161
- HOA
- −$15
- Vacancy / Maint / Mgmt
- −$651
- Net cashflow
- $-238
Break-even live
UW: 25.0% down · 7.5% · 30yr · 1.5% tax · 5.0% vac · 8.0% maint · 8.0% mgmt
Financing live
Cash to close
- Down payment
- $96,615
- Closing costs
- $11,594
- Reserves months
- —
- Total cash needed
- —
Loan-product check · same deal, 3 products live
Conventional
25% down · 7.5% · 30yr
- Down + closing
- —
- Monthly P&I
- —
- Monthly cashflow
- —
- DSCR
- —
- Eligible?
- —
Personal DTI + credit; lowest rate.
DSCR
20% down · 8.5% · 30yr
- Down + closing
- —
- Monthly P&I
- —
- Monthly cashflow
- —
- DSCR
- —
- Eligible?
- —
No personal income docs; deal must DSCR.
Hard money
10% down · 12.0% · 12mo
- Down + closing
- —
- Monthly P&I
- —
- Monthly cashflow
- —
- DSCR
- —
- Eligible?
- —
Short-term bridge; refi at stabilization.
Rent comps 9 comps
| Address | Beds | Baths | Sqft | Rent | $/sqft | DOM | Units | Dist |
|---|---|---|---|---|---|---|---|---|
| 8850 Ginko Run Parrish, FL | 3.0 | 2.5 | 1691 | $2,600 | $1.54 | 16d | 1 | 0.34mi |
| 10832 Charlotte Dr Parrish, FL | 5.0 | 3.0 | 2964 | $2,899 | $0.98 | 11d | 1 | 1.11mi |
| 13089 Oak Hill Way Parrish, FL | 5.0 | 3.0 | 2471 | $2,650 | $1.07 | 23d | 1 | 1.14mi |
| 10048 Big Marsh Ter Parrish, FL | 3.0 | 2.0 | 2034 | $2,825 | $1.39 | 23d | 1 | 1.20mi |
| 12930 Oak Hill Way Parrish, FL | 5.0 | 3.0 | 2453 | $2,679 | $1.09 | 21d | 1 | 1.22mi |
| 10225 Kalamazoo Pl Unit NA Parrish, FL | 4.0 | 2.5 | 2260 | $2,689 | $1.19 | 10d | 1 | 1.42mi |
| 10225 Kalamazoo Pl Parrish, FL | 4.0 | 2.5 | 2260 | $2,789 | $1.23 | 3d | 1 | 1.42mi |
| 11007 Tamarack Pl Unit NA Duette, FL | 4.0 | 3.0 | 2537 | $3,000 | $1.18 | 11d | 1 | 1.43mi |
| 12067 Kingsley Trl Parrish, FL | 4.0 | 2.5 | 2045 | $2,495 | $1.22 | 3d | 1 | 1.46mi |
HOA detail
- Monthly dues
- $15 · $180/yr
Listing history 5 events
-
2026-05-07status Pending
-
2026-03-14price $386,459
-
2026-01-17price $399,109
-
2025-11-22price $414,109
-
2025-11-06$424,109 Active
ⓘ Source: listings_history table (triggers on properties + properties_extension) + one-shot
backfill from property_details.listing_events for pre-trigger history.
Nearby sold comps map
Loading sold comps map…
Walkable amenities ~0.75 mi
Loading nearby amenities…
Taxation est. · year 1
- Rental income
- $37,182
- − Mortgage interest
- −$21,648
- − Property taxes
- −$5,797
- − Insurance
- −$1,932
- − Repairs & maintenance
- −$2,975
- − Management
- −$2,975
- − HOA
- −$180
- − Depreciation
- −$11,242
- Taxable loss
- −$9,566
- Est. tax savings @ 24.0%
- +$2,296
- After-tax cash flow
- $-559/yr
For passive investors: Depreciation is non-cash, so a rental often shows a tax loss while cash-flowing — sheltering income. Rental losses are passive: they offset passive income freely, and up to $25,000/yr can offset ordinary (W-2) income if you actively participate and your MAGI is under $100k (phasing out to $0 by $150k); unused losses carry forward. On sale, claimed depreciation is recaptured at up to 25%, and gains may owe capital-gains tax (a 1031 exchange can defer both). Figures are a year-1 estimate at your 24.0% rate — not tax advice; consult a CPA.
Schools (NCES district)
- District
- Manatee
- NCES district ID
- 1201230
- Math proficiency
- 54% ▼ -6.00%
- Reading proficiency
- 50% ▼ -2.00%
- Median HH income
- $49,607
- Composite
- 44.43/100
- National rank
- #2806
- State rank
- #26 of 73 in FL
Livability — Ruskin
- Score
- 71/100
- State rank
- #392
- US rank
- #6879
Category grades
Schools grade is shown separately in the Schools card above.
Census & demographics
- County
- Manatee County · 416,364 people
- City population
- 33,319
- Metro
- North Port-Sarasota-Bradenton, FL
- Population (ZIP)
- 33,296
- Household income
- $113,773
- Rent vs Own
- Severe rent burden
- 219.0
Population outlook (Manatee County) Hauer SSP2
- Today (2025)
- 447,342 people
- By 2030
- 488,911 · +9.3%
- By 2040
- 567,934 · +27.0%
- By 2050
- 637,995 · +42.6%
- By 2075
- 781,970 · +74.8%
- By 2100
- 848,272 · +89.6%
Race, ethnicity, and origin ACS 2023
- Neighborhood character
- Predominantly White (75%)
- Race & ethnicity
- White 75% Hispanic / Latino 11% Two or more races 8% Black 8% Asian 2%
- Hispanic origin (detail)
- Mexican 2% Puerto Rican 3%
- Common ancestry
- Romanian 4% Hispanic 2% Russian 2%
- Foreign-born
- 10% · Canada, Dominican Republic, Jamaica
- Languages at home
- 88% English-only · Spanish 7% French/Haitian/Cajun 2% Other Asian/Pacific 1%
Political lean MEDSL · Manatee
- 2024 margin
- Strong R (+23.5) · D 37.9% · R 61.4%
- 2008→2024 swing
- -16.5pp toward R · 2008: -7.0pp · 2024: -23.5pp
- All cycles
- 2024: R+23.5 2020: R+16.1 2016: R+17.1 2012: R+12.5 2008: R+7.0
Not yet ingested
- Civics
- —
Market trends
- HPI YoY
- ▼ -84.45%
- Current HPI
- 271.7131
- Rent YoY
- ▼ -0.95%
- Metro
- North Port-Sarasota-Bradenton, FL
- State GDP YoY
- ▲ 3.28%
- F500 in state
- 36
Industry mix (Fortune 500 HQ in FL)
| Industry | F500 HQs | Revenue |
|---|---|---|
| Industrial Technology | 2 | $29B |
|
||
| Insurance | 2 | $17B |
|
||
| Retail | 1 | $60B |
|
||
| Technology Distribution | 1 | $58B |
|
||
| Homebuilding | 1 | $35B |
|
||
| Technology Manufacturing | 1 | $35B |
|
||
Price history
-8.9% since first listed5 events — show timeline
- 2026-05-07 Pending — Stellar MLS as Distributed by MLS Grid
- 2026-03-14 Price Changed $386,459 Stellar MLS as Distributed by MLS Grid
- 2026-01-17 Price Changed $399,109 Stellar MLS as Distributed by MLS Grid
- 2025-11-22 Price Changed $414,109 Stellar MLS as Distributed by MLS Grid
- 2025-11-06 Listed $424,109 Stellar MLS as Distributed by MLS Grid
Cash-flow waterfall
monthlySold comps — $/sqft
last 12 mo · ≤1 miLoading sold comps…