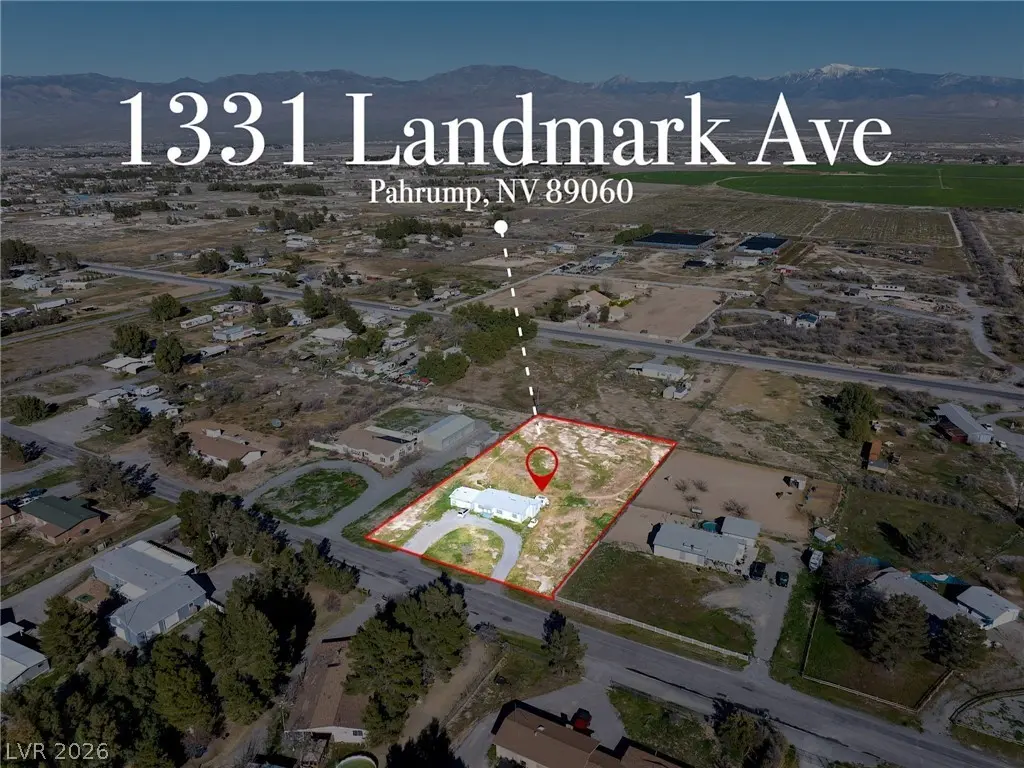
1331 Landmark Ave · Pahrump, NV
Flood risk 1/10 · Minimal
- FEMA flood zone
- X (shaded)
- Chance of flooding over 30 yrs
- 0.0%
- Est. flood insurance / yr
- $507 – $1,088
Fire risk 3/10 · Minor
- Est. fire insurance / yr
- $490 – $910
Heat risk 7/10 · Major
- Hot days now (above 103°F)
- 7 days/yr
- Hot days in 30 yrs
- 18 days/yr
Wind risk 1/10 · Minimal
- Chance of severe wind over 30 yrs
- —
Air-quality risk 1/10 · Minimal
- Unhealthy air days now
- 0 days/yr
- Unhealthy air days in 30 yrs
- 0 days/yr
Risk factors via First Street. Map © Google.
Why this score? — see what drove the C- grade
The composite is a weighted blend of 9 inputs, each scored 0–100. Each bar is that input's sub-score; the figure is the points it added to the 100-point composite (weight × sub-score).
- Cash flow +17.4/30.0
- ARV discount +11.9/15.0
- DSCR +5.4/10.0
- 1% rule +3.5/10.0
- Livability +3.4/5.0
- Appreciation +2.5/10.0
- Rent growth +2.5/5.0
- Condition / age +2.5/5.0
- Schools +2.2/10.0
$210,000
🖨 Deal sheet 📄 Offer letter ✓ Due diligence
Listing remarks MLS
Excellent investment opportunity! 3-bedroom, 2-bath home with a 1-car garage on a full acre. 1,196 sq ft. Tenant occupied month-to-month, offering immediate income potential.
Key facts
- 1.1 acre lot
- Garage
- Built 1991
Neighborhood map
What this means for you Summary
Snapshot
- This is a 3-bed/2.0-bath manufactured listed at $210k.
Deal economics
- At list price, monthly cash flow is $156 ($2k/yr) — positive.
- The deal already cash-flows at list — no discount required.
- To meet the 1% rule (rent ≥ 1% of price), the offer needs to be $179k (14.8% below list).
- Recommended offer: $179k (14.8% below list) — sets the bar for 1% rule.
- Cap rate 7.2% vs local median 3.4% in Pahrump — top-decile yield for the area; either an underpriced asset or a hidden risk that comps aren't pricing in. Stress-test before assuming the spread holds.
Location & tenants
- Location reads 68/100 on livability (#30 in NV) — a middle-class / working-renter tenant base. Strengths: cost of living A+, housing A+, health & safety A+; Watch: employment D, schools F, crime F.
- Nye County School District (rural): math 20% / reading 33% proficiency, ranked #16 of 17 in NV (top 94%) — low school quality limits family demand, transient renter base, plan for 1-2y turnover.
- Market conditions: 655 active listings in the ZIP.
- This rent runs 43% of the median local income ($50k/yr) — at the standard rent-burdened threshold; future hikes will face affordability resistance.
Forward outlook
- Local home prices are declining (-3.0%/yr); year-one equity from $1k of loan paydown is wiped out by about $6k of value loss. Plan a longer hold.
- Nye County population projected at -28% by 2050 — secular population decline; favor cash flow + early exit over multi-decade hold.
Negotiation context
- It's been on market 95 days — a 9% lower offer ($191k) is reasonable based on typical stale-listing flexibility.
- 2 sale attempts since 19y ago with the ask held roughly flat each time — persistent listings suggest the price (not the market) is what's stuck; bring a comps-based counter.
- Current owner paid $80k; list at $210k implies a 162% gain — meaningful room to come down on a strong offer.
Risks & watch-outs
- Climate carrying-cost: extreme-heat days projected 7→18/yr by 2055 (HVAC capex compounding) — expect insurance premiums to compound above CPI over the hold.
Questions for the listing agent
- It's been on market 95 days. Have you received any prior offers? Is the seller open to a 15% concession, seller financing, or rate buy-down credit?
- Why hasn't it sold? Are there any deal-killer items the seller is aware of (foundation, flood, title, zoning, code violations)?
- Is there a deadline driving the sale (1031 exchange, divorce, estate, relocation)? That informs how much negotiation room exists.
- Schools are F-rated, which usually means shorter tenancies and higher turnover. Who's the typical renter profile here, and what's been the actual vacancy rate?
- Crime grade is F in this area — have there been break-ins, vandalism, or insurance claims at this property in the last 3 years? What carrier currently insures it and at what premium?
- What's the average days-on-market for RENTAL listings here right now (not sales)? A rising rental-DOM trend means longer vacancies and softer asking-rent achievability than the comps imply.
- What's the recent tenant-quality profile in this submarket — average credit score on applications, eviction rate, late-payment / NSF rate, and stable-employment percentage? A property-management company in the area should have these aggregated.
- How much new for-sale + rental construction is in the pipeline within 1–3 miles? Heavy new supply typically softens prices + rents 12–24 months out; constrained supply supports both.
Investment metrics
- 1% rule
- 0.85% ✗
- Cap rate
- 7.19%
- Cash-on-cash
- 3.19%
- DSCR
- 1.14
- GRM
- 9.8
CMA / ARV
- ARV (median comp)
- $233,000
- List price
- $210,000
- Delta
- -9.87%
- Verdict
- FAIR
- Comps
- 10 within 1.0 mi
Show comp detail 6 sales within ~0.75 mi
| Address | Dist | Beds/Ba | Sqft | Sold | Price | $/sf | Match |
|---|---|---|---|---|---|---|---|
| 2421 Shadow Mountain St | 0.32mi | 3/2.0 | 1,060 (-15%) | 2mo | $249,000 | $235 | 59 |
| 1711 Royal Ave | 0.40mi | 3/2.0 | 1,120 (-10%) | 7mo | $100,000 | $89 | 58 |
| 1560 N Leslie St | 0.24mi | 2/2.0 (-1) | 1,124 (-10%) | 13mo | $240,000 | $214 | 56 |
| 2340 W Irene St | 0.41mi | 4/2.0 (+1) | 1,410 (+13%) | 3mo | $380,000 | $270 | 52 |
| 2610 W Irene St | 0.59mi | 2/2.0 (-1) | 1,128 (-10%) | 2mo | $184,900 | $164 | 50 |
| 2111 W Mesquite Ave | 0.67mi | 3/2.0 | 1,350 (+8%) | 8mo | $178,000 | $132 | 48 |
Match score weights: distance 35% · size 25% · config 20% · recency 20%. Top-matched comps best support the ARV.
Projected returns pro-forma
-3.0% appreciation · 3.0% rent growth · sell at horizon
- IRR
- -11.3%
- Equity multiple
- 0.59×
- Total profit
- $-24,159
- Equity at exit
- $31,312
- IRR
- -2.2%
- Equity multiple
- 0.85×
- Total profit
- $-8,584
- Equity at exit
- $18,157
Cash invested: $58,800 (down + closing). Projections, not guarantees.
Landlord ↔ Tenant lean methodology
- Overall (STATE)
- 71 Landlord-Friendly
- State Nevada
- 71 Landlord-Friendly · R+1
- County
- — inherits STATE
- City
- — inherits STATE
ZIP-level market 89060
- Home prices YoY
- -1.6%
- Active inventory
- 655
- Price-to-rent
- 9.8×
Monthly cashflow live
- Estimated rent
- $1,789 medium interval (Pro) →
- Mortgage (P&I)
- −$1,101
- Tax from tax record
- −$68 /mo · $817/yr
- Insurance
- −$88
- HOA
- −$0
- Vacancy / Maint / Mgmt
- −$376
- Net cashflow
- $156
Break-even live
UW: 25.0% down · 7.5% · 30yr · 1.5% tax · 5.0% vac · 8.0% maint · 8.0% mgmt
Financing live
Cash to close
- Down payment
- $52,500
- Closing costs
- $6,300
- Reserves months
- —
- Total cash needed
- —
Loan-product check · same deal, 3 products live
Conventional
25% down · 7.5% · 30yr
- Down + closing
- —
- Monthly P&I
- —
- Monthly cashflow
- —
- DSCR
- —
- Eligible?
- —
Personal DTI + credit; lowest rate.
DSCR
20% down · 8.5% · 30yr
- Down + closing
- —
- Monthly P&I
- —
- Monthly cashflow
- —
- DSCR
- —
- Eligible?
- —
No personal income docs; deal must DSCR.
Hard money
10% down · 12.0% · 12mo
- Down + closing
- —
- Monthly P&I
- —
- Monthly cashflow
- —
- DSCR
- —
- Eligible?
- —
Short-term bridge; refi at stabilization.
Listing history 15 events
-
2026-06-14statusdays on market $210,000 Pending 95 DOM
-
2026-06-12days on market $210,000 Active 94 DOM
-
2026-06-09days on market $210,000 Active 91 DOM
-
2026-06-08days on market $210,000 Active 90 DOM
-
2026-06-07days on market $210,000 Active 89 DOM
-
2026-06-03days on market $210,000 Active 85 DOM
-
2026-06-02days on market $210,000 Active 84 DOM
-
2026-06-01days on market $210,000 Active 83 DOM
-
2026-05-31days on market $210,000 Active 82 DOM
-
2026-05-30days on market $210,000 Active 81 DOM
-
2026-03-10$210,000 Active 174-char remark
Show marketing remark (174 chars)
Excellent investment opportunity! 3-bedroom, 2-bath home with a 1-car garage on a full acre. 1,196 sq ft. Tenant occupied month-to-month, offering immediate income potential.
-
2008-02-11historical 134-char remark
Show marketing remark (134 chars)
NICE TIDY 3 BEDROOM HOME ON ACRE LOT. BREAKFAST BAR, PLUSH CARPETS, CEILING FANS, SEPERATE GARAGE. GREAT SHAPE AND READY TO MOVE INTO!
-
2008-02-11soldstatus $80,000 134-char remark
Show marketing remark (134 chars)
NICE TIDY 3 BEDROOM HOME ON ACRE LOT. BREAKFAST BAR, PLUSH CARPETS, CEILING FANS, SEPERATE GARAGE. GREAT SHAPE AND READY TO MOVE INTO!
-
2008-01-31soldstatus $80,000
-
2007-11-01$89,900 134-char remark
Show marketing remark (134 chars)
NICE TIDY 3 BEDROOM HOME ON ACRE LOT. BREAKFAST BAR, PLUSH CARPETS, CEILING FANS, SEPERATE GARAGE. GREAT SHAPE AND READY TO MOVE INTO!
ⓘ Source: listings_history table (triggers on properties + properties_extension) + one-shot
backfill from property_details.listing_events for pre-trigger history.
Tax reassessment forecast NV · Resets to sale price
- Current annual tax
- $817 · $68/mo
- Projected year-2 tax
- $1,239 · $103/mo
- Expected delta
- +$422/yr (+$35/mo · 51.7%)
ⓘ Screening estimate from a state-policy table — verify with the county assessor before closing.
Climate risk First Street
- Flood 1/10 Low FEMA zone X (shaded) · 0% chance over 30 yrs
- Wildfire 3/10 Moderate
- Heat 7/10 Severe 7 d/yr ≥103°F today · 18 d/yr by 30 yrs out
- Wind 1/10 Low
- Air quality 1/10 Low 0 unhealthy d/yr today · 0 by 30 yrs out
Nearby sold comps map
Loading sold comps map…
Walkable amenities ~0.75 mi
Loading nearby amenities…
Taxation est. · year 1
- Rental income
- $21,467
- − Mortgage interest
- −$11,763
- − Property taxes
- −$817
- − Insurance
- −$1,050
- − Repairs & maintenance
- −$1,717
- − Management
- −$1,717
- − Depreciation
- −$6,109
- Taxable loss
- −$1,707
- Est. tax savings @ 24.0%
- +$410
- After-tax cash flow
- $2,287/yr
For passive investors: Depreciation is non-cash, so a rental often shows a tax loss while cash-flowing — sheltering income. Rental losses are passive: they offset passive income freely, and up to $25,000/yr can offset ordinary (W-2) income if you actively participate and your MAGI is under $100k (phasing out to $0 by $150k); unused losses carry forward. On sale, claimed depreciation is recaptured at up to 25%, and gains may owe capital-gains tax (a 1031 exchange can defer both). Figures are a year-1 estimate at your 24.0% rate — not tax advice; consult a CPA.
Schools (NCES district)
- District
- Nye County School District
- NCES district ID
- 3200360
- Math proficiency
- 20% ▼ -6.00%
- Reading proficiency
- 33% ▼ -5.00%
- Median HH income
- $41,447
- Composite
- 22.43/100
- National rank
- #8110
- State rank
- #16 of 17 in NV
Livability — Pahrump
- Score
- 68/100
- State rank
- #30
- US rank
- #9226
Category grades
Schools grade is shown separately in the Schools card above.
Census & demographics
- Census place
- Pahrump, NV
- County
- Nye County · 47,491 people
- City population
- 47,491
- Metro
- Pahrump, NV
- Population (ZIP)
- 12,864
- Household income
- $50,000
- Rent vs Own
- Severe rent burden
- 170.0
Population outlook (Nye County) Hauer SSP2
- Today (2025)
- 40,727 people
- By 2030
- 38,812 · -4.7%
- By 2040
- 33,952 · -16.6%
- By 2050
- 29,393 · -27.8%
- By 2075
- 21,122 · -48.1%
- By 2100
- 14,400 · -64.6%
Race, ethnicity, and origin ACS 2023
- Neighborhood character
- Predominantly White (71%)
- Race & ethnicity
- White 71% Hispanic / Latino 20% Two or more races 12% Asian 2% Black 1% Pacific Islander 1%
- Hispanic origin (detail)
- Mexican 16%
- Common ancestry
- Iranian 4% Romanian 3% Lithuanian 2%
- Foreign-born
- 9% · Canada, China
- Languages at home
- 85% English-only · Spanish 12% Other Indo-European 1% German/W. Germanic 1%
Political lean MEDSL · Nye
- 2024 margin
- Solid R (+42.2) · D 28.0% · R 70.2% · Other 1.8%
- 2008→2024 swing
- -28.8pp toward R · 2008: -13.4pp · 2024: -42.2pp
- All cycles
- 2024: R+42.2 2020: R+40.4 2016: R+42.0 2012: R+24.2 2008: R+13.4
Not yet ingested
- Civics
- —
Market trends
- HPI YoY
- ▼ -4.93%
- Current HPI
- 312.3758
- Rent YoY
- —
- Metro
- Pahrump, NV
- State GDP YoY
- ▲ 3.08%
- F500 in state
- 6
Industry mix (Fortune 500 HQ in NV)
| Industry | F500 HQs | Revenue |
|---|---|---|
| Hotels / Casinos | 3 | $36B |
|
||
Price history
+133.6% since first listed5 events — show timeline
- 2026-03-10 Listed $210,000 GLVAR
- 2008-02-11 Sold (MLS) $80,000 GLVAR
- 2008-02-11 Listing Removed — GLVAR
- 2008-01-31 Sold (Public Records) $80,000 Public Records
- 2007-11-01 Listed $89,900 GLVAR
Property tax history
-1.0%/yrLatest (2025): $817 · +3.5% YoY. Source: county tax records.
Cash-flow waterfall
monthlySold comps — $/sqft
last 12 mo · ≤1 miLoading sold comps…