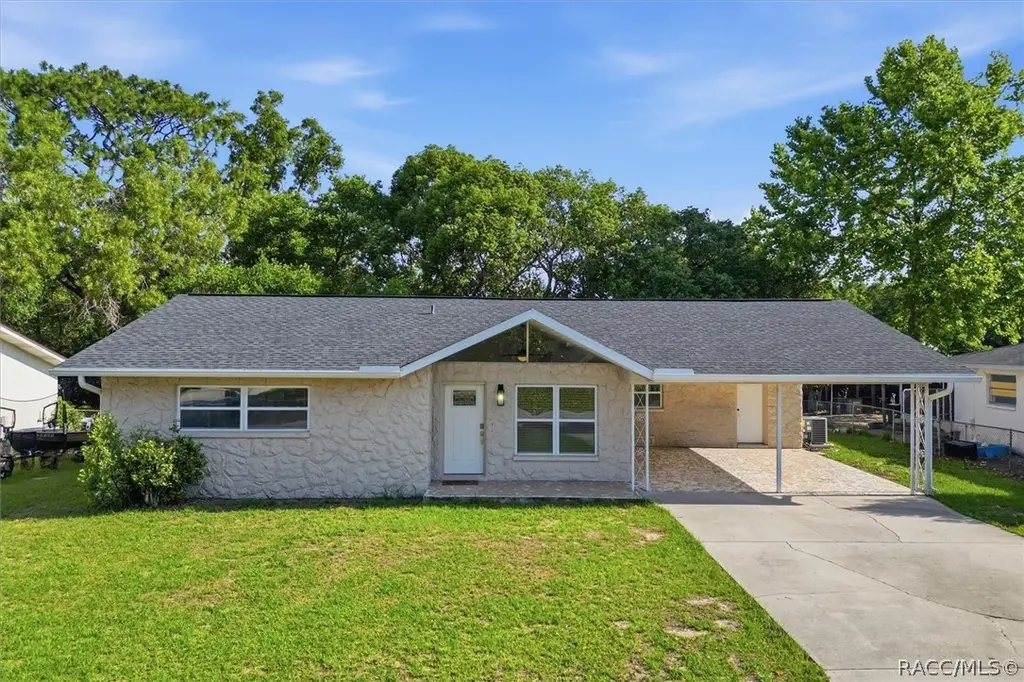
1163 SE 2nd St · Crystal River, FL
Flood risk 9/10 · Severe
- FEMA flood zone
- AE
- Chance of flooding over 30 yrs
- 0.99%
- Est. flood insurance / yr
- $1,737 – $8,500
Fire risk 5/10 · Moderate
- Est. fire insurance / yr
- $947 – $1,759
Heat risk 9/10 · Severe
- Hot days now (above 109°F)
- 7 days/yr
- Hot days in 30 yrs
- 25 days/yr
Wind risk 9/10 · Severe
- Chance of severe wind over 30 yrs
- 99.0%
Air-quality risk 1/10 · Minimal
- Unhealthy air days now
- 0 days/yr
- Unhealthy air days in 30 yrs
- 0 days/yr
Risk factors via First Street. Map © Google.
Why this score? — see what drove the C+ grade
The composite is a weighted blend of 9 inputs, each scored 0–100. Each bar is that input's sub-score; the figure is the points it added to the 100-point composite (weight × sub-score).
- Cash flow +27.9/30.0
- DSCR +9.9/10.0
- 1% rule +7.5/10.0
- Schools +4.1/10.0
- ARV discount +4.0/15.0
- Livability +3.3/5.0
- Rent growth +2.5/5.0
- Condition / age +2.5/5.0
- Appreciation +0.0/10.0
$224,900
🖨 Deal sheet (PDF) 📄 Offer letter ✓ Due diligence
Listing remarks
Located in the heart of Crystal River, this beautifully renovated home is full of charm and modern upgrades! Featuring an open-concept floor plan with two spacious living areas, three bedrooms, two bathrooms, and a dedicated laundry/utility room, this property offers comfort, style, and flexibility. The interior has been completely updated in 2023 with luxury vinyl plank flooring throughout, fresh interior paint, and a stunning kitchen featuring brand-new cabinetry, butcher block countertops, stainless steel appliances, farmhouse sink, and classic subway tile backsplash. Additional recent upgrades include a newer roof (approximately 6 years old), brand-new water heater, gutters and downspou
Key facts
- Brand-new cabinetry
- 8,422 sq ft lot
- 2 parking spots
Tags
Property features AI
Exterior
- Parking: Attached carport; Driveway; Paved parking; 2 total parking spaces
- Utilities: Public water; Public sewer
- Home design: Single-family residence; One level
- Construction: Stucco exterior; Asphalt shingle roof; Block foundation; Built with residential construction materials
- Exterior features: Public-maintained road frontage on a city street; No pool
Interior
- Kitchen: Dishwasher; Electric cooktop; Electric oven; Electric range; Refrigerator
- Flooring: Tile
- Bathrooms: 2 full bathrooms
- Heating & cooling: Central heating (electric); Central air conditioning
- Interior features: Tile flooring; Dishwasher; Electric cooktop; Electric oven; Electric range; Refrigerator
Neighborhood map
What this means for you Summary
Snapshot
- This is a 3-bed/2.0-bath single-family listed at $225k.
Deal economics
- At list price, monthly cash flow is $269 ($3k/yr) — positive.
- The deal already cash-flows at list — no discount required.
- Meets the 1% rule at list price ($3k rent vs $225k).
- Recommended offer: $222k (1.5% below list) — sets the bar for market timing.
- Cap rate 10.0% vs local median 2.5% in Crystal River — top-decile yield for the area; either an underpriced asset or a hidden risk that comps aren't pricing in. Stress-test before assuming the spread holds.
Location & tenants
- Location reads 66/100 on livability (#603 in FL) — a middle-class / working-renter tenant base. Strengths: crime A+, cost of living A+; Watch: health & safety C-, amenities F, commute F.
- Citrus (rural): math 49% / reading 50% proficiency, ranked #44 of 73 in FL (top 60%) — families likely to look elsewhere, expect single-tenant / working-renter base with shorter leases.
- Zoned schools: Crystal River Primary School (math 45% / reading 55%, grade D+, #1,070 of 2,144 statewide, top 51%, 654 students, 70% FRL); Crystal River Middle School (math 49% / reading 47%, grade C-, #286 of 571 statewide, top 50%, 900 students, 64% FRL); Crystal River High School (math 31% / reading 44%, grade F, #336 of 667 statewide, top 51%, 1,249 students, 56% FRL).
- Market conditions: 327 active listings in the ZIP; 2 comparable units currently listed for rent nearby; 2,443 units permitted in Citrus County in 2024 (0 in 5+ unit buildings).
Forward outlook
- Local home prices are declining (-3.0%/yr); year-one equity from $2k of loan paydown is wiped out by about $7k of value loss. Plan a longer hold.
- Citrus County population projected to shrink 10% by 2050 — rents likely to lag national; underwrite the cash flow, not the appreciation.
Negotiation context
- It's been on market 24 days — a 2% lower offer ($222k) is reasonable based on typical stale-listing flexibility.
Risks & watch-outs
- Watch-outs: flood insurance adds $427/mo.
- Climate carrying-cost: in FEMA flood zone AE (mandatory federal flood insurance); severe wind risk, 99% chance of damaging wind over 30y; moderate wildfire risk; extreme-heat days projected 7→25/yr by 2055 (HVAC capex compounding) — expect insurance premiums to compound above CPI over the hold.
Questions for the listing agent
- Built in 1974 — when were the roof, HVAC, electrical panel, plumbing, and water heater last replaced?
- What's the actual annual flood-insurance premium (NFIP or private), and is the property in a SFHA with mandatory coverage?
- Is there a deadline driving the sale (1031 exchange, divorce, estate, relocation)? That informs how much negotiation room exists.
- Schools are D-rated, which usually means shorter tenancies and higher turnover. Who's the typical renter profile here, and what's been the actual vacancy rate?
- What's the average days-on-market for RENTAL listings here right now (not sales)? A rising rental-DOM trend means longer vacancies and softer asking-rent achievability than the comps imply.
- What's the recent tenant-quality profile in this submarket — average credit score on applications, eviction rate, late-payment / NSF rate, and stable-employment percentage? A property-management company in the area should have these aggregated.
- How much new for-sale + rental construction is in the pipeline within 1–3 miles? Heavy new supply typically softens prices + rents 12–24 months out; constrained supply supports both.
Investment metrics
- 1% rule
- 1.25% ✓
- Cap rate
- 10.00%
- Cash-on-cash
- 13.25%
- DSCR
- 1.59
- GRM
- 6.7
CMA / ARV
- ARV (on-the-fly)
- $208,518
- Comps found
- 7
Show comp detail 7 sales within ~0.75 mi
| Address | Dist | Beds/Ba | Sqft | Sold | Price | $/sf | Match |
|---|---|---|---|---|---|---|---|
| 1225 NE 2nd St | 0.21mi | 3/2.0 | 1,500 (-1%) | 0mo | $288,000 | $192 | 89 |
| 1103 SE 3rd St | 0.10mi | 3/2.0 | 1,596 (+6%) | 1mo | $220,000 | $138 | 85 |
| 1255 NE 2nd St | 0.23mi | 3/2.0 | 1,541 (+2%) | 9mo | $245,000 | $159 | 79 |
| 1174 SE 3rd St | 0.08mi | 2/2.0 (-1) | 1,416 (-6%) | 14mo | $200,000 | $141 | 70 |
| 1124 SE 2nd St | 0.07mi | 2/1.0 (-1) | 1,424 (-6%) | 22mo | $197,000 | $138 | 60 |
| 115 NE 9th Ave | 0.40mi | 3/2.0 | 1,456 (-4%) | 22mo | $160,000 | $110 | 57 |
| 745 NE 5th Ter | 0.69mi | 4/2.0 (+1) | 1,680 (+11%) | 16mo | $130,000 | $77 | 31 |
Match score weights: distance 35% · size 25% · config 20% · recency 20%. Top-matched comps best support the ARV.
Projected returns pro-forma
-3.0% appreciation · 3.0% rent growth · sell at horizon
- IRR
- -8.2%
- Equity multiple
- 0.70×
- Total profit
- $-19,035
- Equity at exit
- $33,533
- IRR
- 1.5%
- Equity multiple
- 1.11×
- Total profit
- $6,631
- Equity at exit
- $19,445
Cash invested: $62,972 (down + closing). Projections, not guarantees.
Landlord ↔ Tenant lean methodology
- Overall (STATE)
- 87 Strongly Landlord-Friendly
- State Florida
- 87 Strongly Landlord-Friendly · R+3
- County
- — inherits STATE
- City
- — inherits STATE
ZIP-level market 34429
- Home prices YoY
- -17.8%
- Active inventory
- 327
- Price-to-rent
- 6.7×
Monthly cashflow live
- Estimated rent
- $2,808 medium interval (Pro) →
- Mortgage (P&I)
- −$1,179
- Tax from tax record
- −$250 /mo · $2,998/yr
- Insurance
- −$94
- Flood insurance flood zone
- −$427 /mo · $5,118/yr
- HOA
- −$0
- Vacancy / Maint / Mgmt
- −$590
- Net cashflow
- $269
Break-even live
Sensitivity live
| Price | -10% $396 | -5% $332 | +0% $269 | +5% $205 | +10% $142 |
|---|---|---|---|---|---|
| Rent | -10% $47 | -5% $158 | +0% $269 | +5% $380 | +10% $491 |
| Rate | -1.0pp $382 | -0.5pp $326 | base $269 | +0.5pp $211 | +1.0pp $151 |
UW: 25.0% down · 7.5% · 30yr · 1.5% tax · 5.0% vac · 8.0% maint · 8.0% mgmt
Financing live
Cash to close
- Down payment
- $56,225
- Closing costs
- $6,747
- Reserves months
- —
- Total cash needed
- —
Loan-product check · same deal, 3 products live
Conventional
25% down · 7.5% · 30yr
- Down + closing
- —
- Monthly P&I
- —
- Monthly cashflow
- —
- DSCR
- —
- Eligible?
- —
Personal DTI + credit; lowest rate.
DSCR
20% down · 8.5% · 30yr
- Down + closing
- —
- Monthly P&I
- —
- Monthly cashflow
- —
- DSCR
- —
- Eligible?
- —
No personal income docs; deal must DSCR.
Hard money
10% down · 12.0% · 12mo
- Down + closing
- —
- Monthly P&I
- —
- Monthly cashflow
- —
- DSCR
- —
- Eligible?
- —
Short-term bridge; refi at stabilization.
Rent comps 2 comps
| Address | Beds | Baths | Sqft | Rent | $/sqft | DOM | Units | Dist |
|---|---|---|---|---|---|---|---|---|
| 1004 SE 5th Ave Crystal River, FL | 3.0 | 2.5 | 2114 | $3,500 | $1.66 | 22d | 1 | 1.01mi |
| 1328 NE 5th Ave Crystal River, FL | 3.0 | 2.0 | 1946 | $2,000 | $1.03 | 22d | 1 | 1.28mi |
Listing history 22 events
-
2026-06-21days on market $224,900 Active 24 DOM
-
2026-06-19days on market $224,900 Active 22 DOM
-
2026-06-18days on market $224,900 Active 21 DOM
-
2026-06-17days on market $224,900 Active 20 DOM
-
2026-06-16days on market $224,900 Active 19 DOM
-
2026-06-15days on market $224,900 Active 18 DOM
-
2026-06-14days on market $224,900 Active 16 DOM
-
2026-06-13pricedays on market $224,900 Active 15 DOM
-
2026-06-10days on market $229,000 Active 13 DOM
-
2026-06-09days on market $229,000 Active 12 DOM
-
2026-06-08days on market $229,000 Active 11 DOM
-
2026-06-07days on market $229,000 Active 10 DOM
-
2026-06-03days on market $229,000 Active 6 DOM
-
2026-06-02days on market $229,000 Active 5 DOM
-
2026-06-01days on market $229,000 Active 4 DOM
-
2026-05-31days on market $229,000 Active 3 DOM
-
2026-05-30days on market $229,000 Active 2 DOM
-
2026-05-28$229,000 Active
-
2023-05-10soldstatus $215,000
-
2022-02-01soldstatus $135,000
-
1992-06-01soldstatus $40,000
-
1988-02-01soldstatus $48,900
ⓘ Source: listings_history table (triggers on properties + properties_extension) + one-shot
backfill from property_details.listing_events for pre-trigger history.
Tax reassessment forecast FL · Resets to sale price
- Current annual tax
- $2,998 · $250/mo
- Projected year-2 tax
- $2,998 · $250/mo
- Expected delta
- $0/yr ($0/mo · 0.0%)
ⓘ Screening estimate from a state-policy table — verify with the county assessor before closing.
Climate risk First Street
- Flood 9/10 Extreme FEMA zone AE · 99% chance over 30 yrs
- Wildfire 5/10 Major
- Heat 9/10 Extreme 7 d/yr ≥109°F today · 25 d/yr by 30 yrs out
- Wind 9/10 Extreme 99% chance of damaging wind over 30 yrs
- Air quality 1/10 Low 0 unhealthy d/yr today · 0 by 30 yrs out
Nearby sold comps map
Loading sold comps map…
Walkable amenities ~0.75 mi
Loading nearby amenities…
Taxation est. · year 1
- Rental income
- $33,696
- − Mortgage interest
- −$12,598
- − Property taxes
- −$2,998
- − Insurance
- −$6,243
- − Repairs & maintenance
- −$2,696
- − Management
- −$2,696
- − Depreciation
- −$6,543
- Taxable loss
- −$77
- Est. tax savings @ 24.0%
- +$18
- After-tax cash flow
- $3,245/yr
For passive investors: Depreciation is non-cash, so a rental often shows a tax loss while cash-flowing — sheltering income. Rental losses are passive: they offset passive income freely, and up to $25,000/yr can offset ordinary (W-2) income if you actively participate and your MAGI is under $100k (phasing out to $0 by $150k); unused losses carry forward. On sale, claimed depreciation is recaptured at up to 25%, and gains may owe capital-gains tax (a 1031 exchange can defer both). Figures are a year-1 estimate at your 24.0% rate — not tax advice; consult a CPA.
Schools (NCES district)
- District
- Citrus
- NCES district ID
- 1200270
- Math proficiency
- 49% ▼ -10.00%
- Reading proficiency
- 50% ▼ -6.00%
- Median HH income
- $38,618
- Composite
- 41.28/100
- National rank
- #3519
- State rank
- #44 of 73 in FL
Livability — Crystal River
- Score
- 66/100
- State rank
- #603
- US rank
- #11564
Category grades
Schools grade is shown separately in the Schools card above.
Census & demographics
- Census place
- Crystal River, FL
- City population
- 10,163
- Population (ZIP)
- 9,494
Population outlook (Citrus County) Hauer SSP2
- Today (2025)
- 138,622 people
- By 2030
- 136,886 · -1.3%
- By 2040
- 132,009 · -4.8%
- By 2050
- 125,196 · -9.7%
- By 2075
- 108,570 · -21.7%
- By 2100
- 84,454 · -39.1%
Race, ethnicity, and origin ACS 2023
- Neighborhood character
- Predominantly White (88%)
- Race & ethnicity
- White 88% Black 5% Hispanic / Latino 4% Two or more races 3%
- Common ancestry
- Italian 7% Slovak 2% Lithuanian 2%
- Foreign-born
- 4% · Canada
- Languages at home
- 97% English-only · Spanish 1% Tagalog/Filipino 1%
Political lean MEDSL · Citrus
- 2024 margin
- Solid R (+45.9) · D 26.8% · R 72.6%
- 2008→2024 swing
- -29.8pp toward R · 2008: -16.1pp · 2024: -45.9pp
- All cycles
- 2024: R+45.9 2020: R+41.0 2016: R+39.7 2012: R+21.9 2008: R+16.1
Not yet ingested
- Civics
- —
Market trends
- HPI YoY
- ▼ -58.92%
- Current HPI
- 271.3171
- Rent YoY
- —
- Metro
- —
- State GDP YoY
- ▲ 3.28%
- F500 in state
- 36
Industry mix (Fortune 500 HQ in FL)
| Industry | F500 HQs | Revenue |
|---|---|---|
| Industrial Technology | 2 | $29B |
|
||
| Insurance | 2 | $17B |
|
||
| Retail | 1 | $60B |
|
||
| Technology Distribution | 1 | $58B |
|
||
| Homebuilding | 1 | $35B |
|
||
| Technology Manufacturing | 1 | $35B |
|
||
Price history
+368.3% since first listed5 events — show timeline
- 2026-05-28 Listed $229,000 RACC
- 2023-05-10 Sold (Public Records) $215,000 Public Records
- 2022-02-01 Sold (Public Records) $135,000 Public Records
- 1992-06-01 Sold (Public Records) $40,000 Public Records
- 1988-02-01 Sold (Public Records) $48,900 Public Records
Property tax history
+11.7%/yrLatest (2025): $2,998 · -7.4% YoY. Source: county tax records.
Cash-flow waterfall
monthlySold comps — $/sqft
last 12 mo · ≤1 miLoading sold comps…