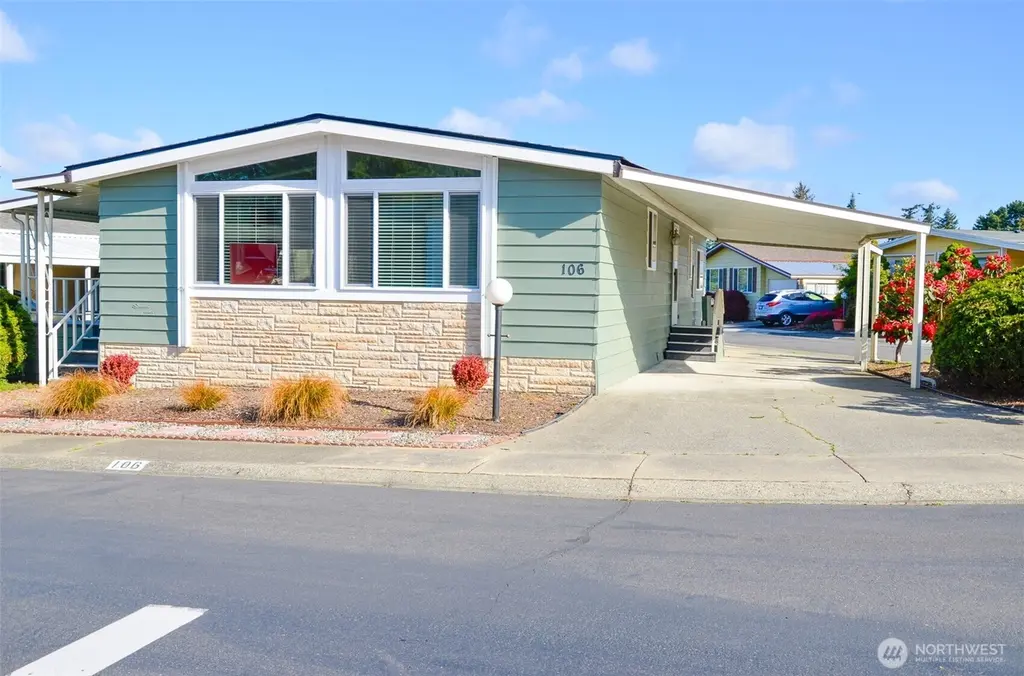
11436 SE 208th St #106 · Kent, WA
Flood risk 1/10 · Minimal
- FEMA flood zone
- X (unshaded)
- Chance of flooding over 30 yrs
- 0.0%
- Est. flood insurance / yr
- $473 – $860
Fire risk 1/10 · Minimal
- Est. fire insurance / yr
- $604 – $1,122
Heat risk 3/10 · Minor
- Hot days now (above 87°F)
- 7 days/yr
- Hot days in 30 yrs
- 15 days/yr
Wind risk 1/10 · Minimal
- Chance of severe wind over 30 yrs
- —
Air-quality risk 8/10 · Major
- Unhealthy air days now
- 12 days/yr
- Unhealthy air days in 30 yrs
- 12 days/yr
Risk factors via First Street. Map © Google.
Why this score? — see what drove the B+ grade
The composite is a weighted blend of 9 inputs, each scored 0–100. Each bar is that input's sub-score; the figure is the points it added to the 100-point composite (weight × sub-score).
- Cash flow +30.0/30.0
- ARV discount +15.0/15.0
- 1% rule +10.0/10.0
- DSCR +10.0/10.0
- Schools +4.8/10.0
- Livability +4.0/5.0
- Rent growth +3.4/5.0
- Condition / age +2.5/5.0
- Appreciation +0.0/10.0
$90,000
🖨 Deal sheet 📄 Offer letter ✓ Due diligence
Listing remarks
Fall in love with this beautifully updated 2-bed, 2-bath home in the vibrant 55+ Pantera Lago Estates. Enjoy new luxury vinyl floors, carpet, paint, appliances, roof, windows, and furnace. The kitchen offers ample cabinets, counters, and a built-in table. Relax in open living/dining areas or the cozy family room. Includes laundry room with washer/dryer, covered deck, 2-car parking, and storage shed. Steps away from the clubhouse with pool, spa, sauna, game room, library, dog park, trails, and more. A warm, active community awaits, schedule your tour today!
Key facts
- Built in hutch
- New vinyl windows
- Large kitchen
Tags
Neighborhood map
What this means for you Summary
Snapshot
- This is a 2-bed/2.0-bath manufactured listed at $90k.
Deal economics
- At list price, monthly cash flow is $1k ($13k/yr) — positive.
- The deal already cash-flows at list — no discount required.
- Meets the 1% rule at list price ($2k rent vs $90k).
- Recommended offer: $79k (12.0% below list) — sets the bar for market timing.
- Cap rate 20.5% vs local median 2.7% in Kent — top-decile yield for the area; either an underpriced asset or a hidden risk that comps aren't pricing in. Stress-test before assuming the spread holds.
Location & tenants
- Location reads 79/100 on livability (#109 in WA, #2,154 nationally) — a middle-class / working-renter tenant base. Strengths: amenities A+, commute A+, housing A+; Watch: schools C-, crime F, cost of living F.
- Kent School District (urban): math 47% / reading 57% proficiency, ranked #109 of 291 in WA (top 38%) — acceptable for families but not a draw, mixed tenant base, ~2y average lease.
- Market conditions: Rents rising (+3.5%/yr); 167 active listings in the ZIP; 19 comparable units currently listed for rent nearby; rentals at typical pace (median 15d on market — plan ~3-4 weeks tenant-placement turnaround); solid renter incomes; 10,555 units permitted in King County in 2024 (7,119 in 5+ unit buildings).
Forward outlook
- Local home prices are declining (-3.0%/yr); year-one equity from $622 of loan paydown is wiped out by about $3k of value loss. Plan a longer hold.
- King County population projected at +44% by 2050 — long-run rental-demand tailwind backs the buy-and-hold thesis.
- At projected returns (-3.0% appreciation + 3.5% rent growth), your $25k cash investment doubles in ~3 years — after that, you're playing with house money.
Negotiation context
- It's been on market 403 days — a 12% lower offer ($79k) is reasonable based on typical stale-listing flexibility.
- 5 sale attempts since 23y ago; this cycle's ask has dropped $50k (35%) from the opening price — seller is motivated, your offer sets the floor, not the list.
- Current owner paid $14k; list at $90k implies a 543% gain — meaningful room to come down on a strong offer.
Questions for the listing agent
- It's been on market 403 days. Have you received any prior offers? Is the seller open to a 12% concession, seller financing, or rate buy-down credit?
- Why hasn't it sold? Are there any deal-killer items the seller is aware of (foundation, flood, title, zoning, code violations)?
- Is there a deadline driving the sale (1031 exchange, divorce, estate, relocation)? That informs how much negotiation room exists.
- Crime grade is F in this area — have there been break-ins, vandalism, or insurance claims at this property in the last 3 years? What carrier currently insures it and at what premium?
- What's the average days-on-market for RENTAL listings here right now (not sales)? A rising rental-DOM trend means longer vacancies and softer asking-rent achievability than the comps imply.
- What's the recent tenant-quality profile in this submarket — average credit score on applications, eviction rate, late-payment / NSF rate, and stable-employment percentage? A property-management company in the area should have these aggregated.
- How much new for-sale + rental construction is in the pipeline within 1–3 miles? Heavy new supply typically softens prices + rents 12–24 months out; constrained supply supports both.
Investment metrics
- 1% rule
- 2.37% ✓
- Cap rate
- 20.51%
- Cash-on-cash
- 50.78%
- DSCR
- 3.26
- GRM
- 3.5
CMA / ARV
- ARV (median comp)
- $133,523
- List price
- $90,000
- Delta
- -32.60%
- Verdict
- UNDERPRICED
- Comps
- 8 within 1.0 mi
Show comp detail 3 sales within ~0.75 mi
| Address | Dist | Beds/Ba | Sqft | Sold | Price | $/sf | Match |
|---|---|---|---|---|---|---|---|
| 11436 SE 208th St #170 | 0.06mi | 2/2.0 | 1,250 (+8%) | 21mo | $130,000 | $104 | 65 |
| 20744 113th Pl SE | 0.15mi | 2/2.0 | 1,250 (+8%) | 22mo | $105,000 | $84 | 60 |
| 12212 SE 206th St | 0.57mi | 3/2.0 (+1) | 1,080 (-6%) | 8mo | $300,000 | $278 | 52 |
Match score weights: distance 35% · size 25% · config 20% · recency 20%. Top-matched comps best support the ARV.
Projected returns pro-forma
-3.0% appreciation · 3.53% rent growth · sell at horizon
- IRR
- 49.2%
- Equity multiple
- 3.16×
- Total profit
- $54,508
- Equity at exit
- $13,419
- IRR
- 54.9%
- Equity multiple
- 6.55×
- Total profit
- $139,798
- Equity at exit
- $7,782
Cash invested: $25,200 (down + closing). Projections, not guarantees.
Landlord ↔ Tenant lean methodology
- Overall (STATE)
- 28 Tenant-Leaning
- State Washington
- 28 Tenant-Leaning · D+8
- County
- — inherits STATE
- City
- — inherits STATE
ZIP-level market 98031
- Rents YoY
- 3.5%
- Active inventory
- 167
- Price-to-rent
- 3.5×
Monthly cashflow live
- Estimated rent
- $2,137 high interval (Pro) →
- Mortgage (P&I)
- −$472
- Tax est. 1.5%
- −$112 /mo · $1,350/yr
- Insurance
- −$38
- HOA
- −$0
- Vacancy / Maint / Mgmt
- −$449
- Net cashflow
- $1,066
Break-even live
UW: 25.0% down · 7.5% · 30yr · 1.5% tax · 5.0% vac · 8.0% maint · 8.0% mgmt
Financing live
Cash to close
- Down payment
- $22,500
- Closing costs
- $2,700
- Reserves months
- —
- Total cash needed
- —
Loan-product check · same deal, 3 products live
Conventional
25% down · 7.5% · 30yr
- Down + closing
- —
- Monthly P&I
- —
- Monthly cashflow
- —
- DSCR
- —
- Eligible?
- —
Personal DTI + credit; lowest rate.
DSCR
20% down · 8.5% · 30yr
- Down + closing
- —
- Monthly P&I
- —
- Monthly cashflow
- —
- DSCR
- —
- Eligible?
- —
No personal income docs; deal must DSCR.
Hard money
10% down · 12.0% · 12mo
- Down + closing
- —
- Monthly P&I
- —
- Monthly cashflow
- —
- DSCR
- —
- Eligible?
- —
Short-term bridge; refi at stabilization.
Rent comps 19 comps
| Address | Beds | Baths | Sqft | Rent | $/sqft | DOM | Units | Dist |
|---|---|---|---|---|---|---|---|---|
| 20803 110th Ln SE Kent, WA | 2.0 | 2.5 | 1361 | $2,845 | $2.09 | 43d | 1 | 0.27mi |
| 20805 109th Ln SE Kent, WA | 2.0 | 1.5 | 1250 | $2,700 | $2.16 | 43d | 1 | 0.29mi |
| 10836 SE 204th St Kent, WA | 1.0 | 1.0 | 850 | $1,795 | $2.11 | 43d | 1 | 0.30mi |
| 10836 SE 204th St Kent, WA | 1.0 | 1.0 | 850 | $1,795 | $2.11 | 24d | 1 | 0.30mi |
| 11101 SE 208th St Kent, WA | 1.0–3.0 | 1.0–2.0 | 971 | $1,978 | $2.04 | 1d | 17 | 0.35mi |
| 10820 SE 211th Pl Kent, WA | 1.0–3.0 | 1.0–1.5 | 907 | $2,032 | $2.24 | 2d | 20 | 0.35mi |
| 10833 SE 200th St Kent, WA | 2.0 | 1.0 | 844 | $1,600 | $1.90 | 1d | 1 | 0.39mi |
| 12012 SE 210th St Kent, WA | 3.0 | 1.5 | 1230 | $1,820 | $1.48 | 24d | 1 | 0.51mi |
| 20506 103rd Ave SE Kent, WA | 3.0 | 1.0 | 1180 | $2,295 | $1.94 | 23d | 1 | 0.63mi |
| 21822 107th Pl SE #6 Kent, WA | 3.0 | 1.5 | 1152 | $1,525 | $1.32 | 21d | 1 | 0.88mi |
| 19002 108th Ave SE Renton, WA | 2.0 | 1.0 | 800 | $1,595 | $1.99 | 3d | 1 | 1.00mi |
| 19002 108th Ave SE Unit 2 Renton, WA | 2.0 | 1.0 | 800 | $1,595 | $1.99 | 10d | 1 | 1.00mi |
| 19002 108th Ave SE Unit 2 Renton, WA | 2.0 | 1.0 | 800 | $1,595 | $1.99 | 11d | 1 | 1.00mi |
| 21627 127th Pl SE Kent, WA | 3.0 | 2.0 | 1420 | $3,095 | $2.18 | 16d | 1 | 1.13mi |
| 9333 S 200th St Kent, WA | 3.0 | 1.0 | 1060 | $2,450 | $2.31 | 4d | 1 | 1.25mi |
| 22415 Benson Rd SE Kent, WA | 2.0 | 1.0 | 706 | $1,520 | $2.15 | 1d | 4 | 1.27mi |
| 11211 SE 226th St Kent, WA | 3.0 | 2.0 | 1012 | $2,250 | $2.22 | 17d | 1 | 1.30mi |
| 10815 SE 184th Ln Renton, WA | 1.0–2.0 | 1.0–2.0 | 860 | $2,445 | $2.84 | 14d | 3 | 1.35mi |
| 5301 Talbot Rd S Renton, WA | 2.0 | 1.0–2.0 | 1046 | $2,574 | $2.46 | 1d | 9 | 1.49mi |
Listing history 23 events
-
2026-06-18days on market $90,000 Active 403 DOM
-
2026-06-17days on market $90,000 Active 402 DOM
-
2026-06-16days on market $90,000 Active 401 DOM
-
2026-06-15days on market $90,000 Active 400 DOM
-
2026-06-13days on market $90,000 Active 398 DOM
-
2026-06-09days on market $90,000 Active 394 DOM
-
2026-06-08days on market $90,000 Active 393 DOM
-
2026-06-07days on market $90,000 Active 392 DOM
-
2026-06-04days on market $90,000 Active 389 DOM
-
2026-06-03days on market $90,000 Active 388 DOM
-
2026-06-02days on market $90,000 Active 387 DOM
-
2026-06-01days on market $90,000 Active 386 DOM
-
2026-05-31days on market $90,000 Active 385 DOM
-
2026-03-24status Active
-
2025-11-14price $104,995
-
2025-09-29status Active
-
2025-06-19price $124,500
-
2025-03-10$139,500 Active
-
2010-03-15soldstatus $14,000 Sold
-
2010-02-06status Pending
-
2010-01-31$19,900 Active
-
2003-08-29soldstatus $26,000
-
2003-08-19$27,999
ⓘ Source: listings_history table (triggers on properties + properties_extension) + one-shot
backfill from property_details.listing_events for pre-trigger history.
Climate risk First Street
- Flood 1/10 Low FEMA zone X (unshaded) · 0% chance over 30 yrs
- Wildfire 1/10 Low
- Heat 3/10 Moderate 7 d/yr ≥87°F today · 15 d/yr by 30 yrs out
- Wind 1/10 Low
- Air quality 8/10 Severe 12 unhealthy d/yr today · 12 by 30 yrs out
Nearby sold comps map
Loading sold comps map…
Walkable amenities ~0.75 mi
Loading nearby amenities…
Taxation est. · year 1
- Rental income
- $25,645
- − Mortgage interest
- −$5,041
- − Property taxes
- −$1,350
- − Insurance
- −$450
- − Repairs & maintenance
- −$2,052
- − Management
- −$2,052
- − Depreciation
- −$2,618
- Taxable income
- $12,082
- Est. tax owed @ 24.0%
- −$2,900
- After-tax cash flow
- $9,896/yr
For passive investors: Depreciation is non-cash, so a rental often shows a tax loss while cash-flowing — sheltering income. Rental losses are passive: they offset passive income freely, and up to $25,000/yr can offset ordinary (W-2) income if you actively participate and your MAGI is under $100k (phasing out to $0 by $150k); unused losses carry forward. On sale, claimed depreciation is recaptured at up to 25%, and gains may owe capital-gains tax (a 1031 exchange can defer both). Figures are a year-1 estimate at your 24.0% rate — not tax advice; consult a CPA.
Schools (NCES district)
- District
- Kent School District
- NCES district ID
- 5303960
- Math proficiency
- 47% ▼ -1.00%
- Reading proficiency
- 57% ▼ -1.00%
- Median HH income
- $69,823
- Composite
- 48.25/100
- National rank
- #4714
- State rank
- #109 of 291 in WA
Livability — Kent
- Score
- 79/100
- State rank
- #109
- US rank
- #2154
Category grades
Schools grade is shown separately in the Schools card above.
Census & demographics
- Census place
- Kent, WA
- County
- King County · 2,251,916 people
- City population
- 119,479
- Metro
- Seattle-Tacoma-Bellevue, WA
- Population (ZIP)
- 40,094
- Household income
- $105,965
- Rent vs Own
- Severe rent burden
- 1151.0
Population outlook (King County) Hauer SSP2
- Today (2025)
- 2,576,485 people
- By 2030
- 2,803,316 · +8.8%
- By 2040
- 3,255,921 · +26.4%
- By 2050
- 3,706,444 · +43.9%
- By 2075
- 4,746,063 · +84.2%
- By 2100
- 5,407,730 · +109.9%
Race, ethnicity, and origin ACS 2023
- Neighborhood character
- Highly diverse neighborhood (Simpson 0.77)
- Race & ethnicity
- White 36% Asian 27% Black 13% Hispanic / Latino 13% Two or more races 13% Pacific Islander 1%
- Hispanic origin (detail)
- Mexican 9%
- Common ancestry
- Italian 5% Portuguese 2% Subsaharan African 2%
- Foreign-born
- 31% · Canada, Vietnam, China
- Languages at home
- 58% English-only · Spanish 9% Other Indo-European 7% Vietnamese 4%
Political lean MEDSL · King
- 2024 margin
- Solid D (+51.7) · D 74.2% · R 22.5% · Other 3.4%
- 2008→2024 swing
- +9.6pp toward D · 2008: 42.1pp · 2024: 51.7pp
- All cycles
- 2024: D+51.7 2020: D+52.7 2016: D+50.4 2012: D+39.9 2008: D+42.1
Not yet ingested
- Civics
- —
Market trends
- HPI YoY
- ▼ -673.58%
- Current HPI
- 308.1747
- Rent YoY
- ▲ 3.53%
- Metro
- Seattle-Tacoma-Bellevue, WA
- State GDP YoY
- ▲ 4.65%
- F500 in state
- 22
Industry mix (Fortune 500 HQ in WA)
| Industry | F500 HQs | Revenue |
|---|---|---|
| Retail | 2 | $269B |
|
||
| Technology / Retail | 1 | $638B |
|
||
| Technology | 1 | $245B |
|
||
| Telecommunications | 1 | $38B |
|
||
| Food / Beverage | 1 | $36B |
|
||
| Automotive / Trucks | 1 | $34B |
|
||
Price history
+275.0% since first listed10 events — show timeline
- 2026-03-24 Relisted — NWMLS as Distributed by MLS Grid
- 2025-11-14 Price Changed $104,995 NWMLS as Distributed by MLS Grid
- 2025-09-29 Relisted — NWMLS as Distributed by MLS Grid
- 2025-06-19 Price Changed $124,500 NWMLS as Distributed by MLS Grid
- 2025-03-10 Listed $139,500 NWMLS as Distributed by MLS Grid
- 2010-03-15 Sold (MLS) $14,000 NWMLS as Distributed by MLS Grid
- 2010-02-06 Pending — NWMLS as Distributed by MLS Grid
- 2010-01-31 Listed $19,900 NWMLS as Distributed by MLS Grid
- 2003-08-29 Sold (MLS) $26,000 NWMLS as Distributed by MLS Grid
- 2003-08-19 Listed $27,999 NWMLS as Distributed by MLS Grid
Cash-flow waterfall
monthlySold comps — $/sqft
last 12 mo · ≤1 miLoading sold comps…