1020 SW 7th St #9 · Miami, FL
Flood risk 4/10 · Minor
- FEMA flood zone
- X (unshaded)
- Chance of flooding over 30 yrs
- 0.21%
- Est. flood insurance / yr
- $507 – $1,088
Fire risk 1/10 · Minimal
- Est. fire insurance / yr
- $947 – $1,759
Heat risk 10/10 · Severe
- Hot days now (above 103°F)
- 8 days/yr
- Hot days in 30 yrs
- 32 days/yr
Wind risk 10/10 · Severe
- Chance of severe wind over 30 yrs
- 99.0%
Air-quality risk 2/10 · Minimal
- Unhealthy air days now
- 1 days/yr
- Unhealthy air days in 30 yrs
- 1 days/yr
Risk factors via First Street. Map © Google.
Why this score? — see what drove the B grade
The composite is a weighted blend of 9 inputs, each scored 0–100. Each bar is that input's sub-score; the figure is the points it added to the 100-point composite (weight × sub-score).
- Cash flow +30.0/30.0
- 1% rule +10.0/10.0
- DSCR +10.0/10.0
- ARV discount +7.5/15.0
- Schools +4.2/10.0
- Appreciation +4.1/10.0
- Livability +3.9/5.0
- Condition / age +2.5/5.0
- Rent growth +2.4/5.0
$219,000
🖨 Deal sheet (PDF) 📄 Offer letter ✓ Due diligence
Listing remarks
Great Investment Opportunity! Unit located at 1020 SW 7th St, Miami, just one mile from Brickell City Centre, with convenient access to Brickell and Downtown Miami. The unit features 2 bedrooms and 1 bathroom with a bright and functional layout. Low maintenance fees add to the appeal of this property. Tenant occupied by a long-term tenant, with a lease in place through March 2026, providing immediate rental income. Excellent opportunity in a growing Miami area.
Key facts
- Long-term tenant
- Convenient access
- Growing miami area
Tags
Property features AI
Finance
- Financial info: Pets not allowed
- HOA & community: HOA fee $250 monthly; HOA includes common area maintenance, building insurance, laundry, grounds maintenance, and structure maintenance; Association amenities: laundry, trash
Exterior
- Parking: Attached carport; Attached garage; Garage with 1 space; One covered parking space
- Utilities: Electric cooling (central or wall); Water, sewer and power available
- Home design: Attached property; 3 stories; Entry on 3rd floor
- Construction: Block construction; Effective year built
- Exterior features: Fenced property; Complex is fenced
Interior
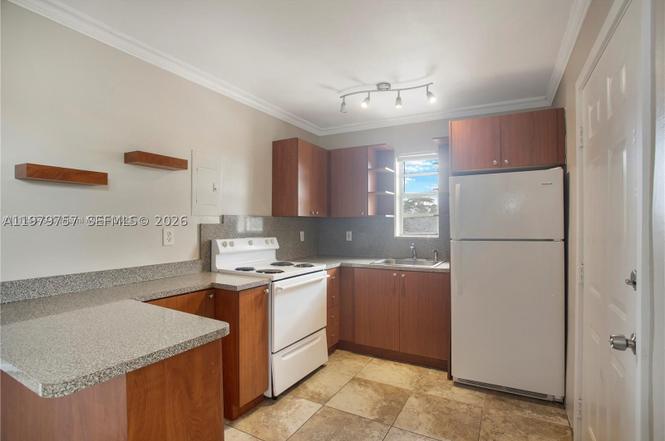
- Kitchen: Dishwasher; Electric range; Microwave; Refrigerator
- Flooring: Ceramic tile
- Bathrooms: 1 full bathroom
- Heating & cooling: Electric cooling
- Interior features: Third-floor entry; Other interior features
- Laundry & utility: Common area laundry
Neighborhood map
What this means for you Summary
Snapshot
- This is a 2-bed/1.0-bath condo listed at $219k.
Deal economics
- At list price, monthly cash flow is $2k ($21k/yr) — positive.
- The deal already cash-flows at list — no discount required.
- Meets the 1% rule at list price ($4k rent vs $219k).
- Recommended offer: $199k (9.0% below list) — sets the bar for market timing.
- Cap rate 16.0% vs local median 1.9% in Miami — top-decile yield for the area; either an underpriced asset or a hidden risk that comps aren't pricing in. Stress-test before assuming the spread holds.
Location & tenants
- Location reads 78/100 on livability (#177 in FL, #2,724 nationally) — a middle-class / working-renter tenant base. Strengths: amenities A+, commute A+, health & safety A+; Watch: employment C-, crime F, cost of living F.
- Miami-Dade (suburban): math 45% / reading 54% proficiency, ranked #40 of 73 in FL (top 55%) — families likely to look elsewhere, expect single-tenant / working-renter base with shorter leases; 64% free/reduced lunch — lower-income household profile, screen leases tightly.
- Zoned schools: Riverside Elementary School (math 23% / reading 23%, grade F, #2,070 of 2,144 statewide, top 97%, 993 students, 56% FRL); Jose De Diego Middle School (math 20% / reading 24%, grade F, #549 of 571 statewide, top 97%, 868 students, 68% FRL); Booker T. Washington Senior High (math 12% / reading 19%, grade F, #604 of 667 statewide, top 91%, 1,014 students, 60% FRL) — zoned schools at 61% FRL track the district average.
- Zoned-school proficiency averages 20% at this address vs 50% district-wide (-29 pts) — the specific schools serving this property underperform the Miami-Dade average; the district grade overstates school quality for this exact location.
- Market conditions: Rents soft (-0.5%/yr); 642 active listings in the ZIP; 10,051 units permitted in Miami-Dade County in 2024 (7,758 in 5+ unit buildings).
Forward outlook
- Local home prices are declining (-1.8%/yr); year-one equity from $2k of loan paydown is wiped out by about $4k of value loss. Plan a longer hold.
- Miami-Dade County population projected at +28% by 2050 — long-run rental-demand tailwind backs the buy-and-hold thesis.
- At projected returns (-1.8% appreciation + 0.0% rent growth), your $61k cash investment doubles in ~4 years — after that, you're playing with house money.
Negotiation context
- It's been on market 104 days — a 9% lower offer ($199k) is reasonable based on typical stale-listing flexibility.
- 5 sale attempts since 5y ago with the ask held roughly flat each time — persistent listings suggest the price (not the market) is what's stuck; bring a comps-based counter.
- Current owner paid $185k; 18% above their basis — modest negotiation headroom, anchor on the comps not their cost.
Risks & watch-outs
- Climate carrying-cost: severe wind risk, 99% chance of damaging wind over 30y; extreme-heat days projected 8→32/yr by 2055 (HVAC capex compounding) — expect insurance premiums to compound above CPI over the hold.
Questions for the listing agent
- It's been on market 104 days. Have you received any prior offers? Is the seller open to a 9% concession, seller financing, or rate buy-down credit?
- Built in 1964 — when were the roof, HVAC, electrical panel, plumbing, and water heater last replaced?
- What does the HOA fee cover, when was the last increase, and are there any pending special assessments or reserve-fund shortfalls?
- Any open or pending special assessments — roof, HVAC, plumbing, elevator, façade? What's the per-unit balance and payoff schedule, and is the seller paying it off at close or rolling it to the buyer?
- Why hasn't it sold? Are there any deal-killer items the seller is aware of (foundation, flood, title, zoning, code violations)?
- Is there a deadline driving the sale (1031 exchange, divorce, estate, relocation)? That informs how much negotiation room exists.
- Schools are B-rated — typically a magnet for longer-tenancy family renters. What's the average tenant stay here, and is there a school-zone premium baked into asking?
- Crime grade is F in this area — have there been break-ins, vandalism, or insurance claims at this property in the last 3 years? What carrier currently insures it and at what premium?
- What's the average days-on-market for RENTAL listings here right now (not sales)? A rising rental-DOM trend means longer vacancies and softer asking-rent achievability than the comps imply.
- What's the recent tenant-quality profile in this submarket — average credit score on applications, eviction rate, late-payment / NSF rate, and stable-employment percentage? A property-management company in the area should have these aggregated.
- How much new apartment / multifamily construction is in the pipeline within 1–3 miles? Heavy new supply (>2% of stock underway) typically softens rents 12–24 months out; light construction supports rent growth.
Investment metrics
- 1% rule
- 2.01% ✓
- Cap rate
- 16.00%
- Cash-on-cash
- 34.67%
- DSCR
- 2.54
- GRM
- 4.1
CMA / ARV
No comps found within radius.
Projected returns pro-forma
-1.79% appreciation · 0.0% rent growth · sell at horizon
- IRR
- 29.0%
- Equity multiple
- 2.24×
- Total profit
- $75,956
- Equity at exit
- $44,683
- IRR
- 32.9%
- Equity multiple
- 3.81×
- Total profit
- $172,563
- Equity at exit
- $40,255
Cash invested: $61,320 (down + closing). Projections, not guarantees.
Landlord ↔ Tenant lean methodology
- Overall (STATE)
- 87 Strongly Landlord-Friendly
- State Florida
- 87 Strongly Landlord-Friendly · R+3
- County
- — inherits STATE
- City
- — inherits STATE
ZIP-level market 33130
- Home prices YoY
- -0.5%
- Rents YoY
- -0.5%
- Active inventory
- 642
- Price-to-rent
- 4.1×
Monthly cashflow live
- Estimated rent
- $4,399 medium interval (Pro) →
- Mortgage (P&I)
- −$1,148
- Tax from tax record
- −$214 /mo · $2,566/yr
- Insurance
- −$91
- HOA
- −$250
- Vacancy / Maint / Mgmt
- −$924
- Net cashflow
- $1,772
Break-even live
Sensitivity live
| Price | -10% $1,896 | -5% $1,834 | +0% $1,772 | +5% $1,710 | +10% $1,648 |
|---|---|---|---|---|---|
| Rent | -10% $1,424 | -5% $1,598 | +0% $1,772 | +5% $1,946 | +10% $2,119 |
| Rate | -1.0pp $1,882 | -0.5pp $1,827 | base $1,772 | +0.5pp $1,715 | +1.0pp $1,657 |
UW: 25.0% down · 7.5% · 30yr · 1.5% tax · 5.0% vac · 8.0% maint · 8.0% mgmt
Financing live
Cash to close
- Down payment
- $54,750
- Closing costs
- $6,570
- Reserves months
- —
- Total cash needed
- —
Loan-product check · same deal, 3 products live
Conventional
25% down · 7.5% · 30yr
- Down + closing
- —
- Monthly P&I
- —
- Monthly cashflow
- —
- DSCR
- —
- Eligible?
- —
Personal DTI + credit; lowest rate.
DSCR
20% down · 8.5% · 30yr
- Down + closing
- —
- Monthly P&I
- —
- Monthly cashflow
- —
- DSCR
- —
- Eligible?
- —
No personal income docs; deal must DSCR.
Hard money
10% down · 12.0% · 12mo
- Down + closing
- —
- Monthly P&I
- —
- Monthly cashflow
- —
- DSCR
- —
- Eligible?
- —
Short-term bridge; refi at stabilization.
HOA detail condo
- Monthly dues
- $250 · $3,000/yr
- Assessments
- None detected in remarks — confirm with the listing agent.
Listing history 31 events
-
2026-06-21days on market $219,000 Active 104 DOM
-
2026-06-18days on market $219,000 Active 101 DOM
-
2026-06-17days on market $219,000 Active 100 DOM
-
2026-06-16days on market $219,000 Active 99 DOM
-
2026-06-15days on market $219,000 Active 98 DOM
-
2026-06-13days on market $219,000 Active 96 DOM
-
2026-06-09days on market $219,000 Active 92 DOM
-
2026-06-08days on market $219,000 Active 91 DOM
-
2026-06-07days on market $219,000 Active 90 DOM
-
2026-06-04days on market $219,000 Active 87 DOM
-
2026-06-03days on market $219,000 Active 86 DOM
-
2026-06-02days on market $219,000 Active 85 DOM
-
2026-06-01days on market $219,000 Active 84 DOM
-
2026-05-31days on market $219,000 Active 83 DOM
-
2026-03-09$219,000 Active
-
2026-01-21historical
-
2025-07-18$219,000 Active
-
2025-06-28historical
-
2025-05-08price $219,000
-
2025-04-23price $229,000
-
2025-04-06price $235,000
-
2025-03-10$245,000 Active
-
2022-05-16soldstatus $185,000
-
2022-03-31soldstatus $185,000 Closed
-
2022-02-24status Pending
-
2022-02-09status Active
-
2022-02-06status Pending
-
2022-01-07price $189,999
-
2021-11-16$199,999 Active
-
2005-10-31soldstatus $150,500
-
2005-06-06soldstatus $800,000
ⓘ Source: listings_history table (triggers on properties + properties_extension) + one-shot
backfill from property_details.listing_events for pre-trigger history.
Tax reassessment forecast FL · Resets to sale price
- Current annual tax
- $2,566 · $214/mo
- Projected year-2 tax
- $2,566 · $214/mo
- Expected delta
- $0/yr ($0/mo · 0.0%)
ⓘ Screening estimate from a state-policy table — verify with the county assessor before closing.
Climate risk First Street
- Flood 4/10 Moderate FEMA zone X (unshaded) · 21% chance over 30 yrs
- Wildfire 1/10 Low
- Heat 10/10 Extreme 8 d/yr ≥103°F today · 32 d/yr by 30 yrs out
- Wind 10/10 Extreme 99% chance of damaging wind over 30 yrs
- Air quality 2/10 Low 1 unhealthy d/yr today · 1 by 30 yrs out
Nearby sold comps map
Loading sold comps map…
Walkable amenities ~0.75 mi
Loading nearby amenities…
Taxation est. · year 1
- Rental income
- $52,790
- − Mortgage interest
- −$12,267
- − Property taxes
- −$2,566
- − Insurance
- −$1,095
- − Repairs & maintenance
- −$4,223
- − Management
- −$4,223
- − HOA
- −$3,000
- − Depreciation
- −$6,371
- Taxable income
- $19,044
- Est. tax owed @ 24.0%
- −$4,571
- After-tax cash flow
- $16,691/yr
For passive investors: Depreciation is non-cash, so a rental often shows a tax loss while cash-flowing — sheltering income. Rental losses are passive: they offset passive income freely, and up to $25,000/yr can offset ordinary (W-2) income if you actively participate and your MAGI is under $100k (phasing out to $0 by $150k); unused losses carry forward. On sale, claimed depreciation is recaptured at up to 25%, and gains may owe capital-gains tax (a 1031 exchange can defer both). Figures are a year-1 estimate at your 24.0% rate — not tax advice; consult a CPA.
Schools (NCES district)
- District
- Miami-Dade
- NCES district ID
- 1200390
- Math proficiency
- 45% ▼ -16.00%
- Reading proficiency
- 54% ▼ -5.00%
- Median HH income
- $43,928
- Composite
- 41.76/100
- National rank
- #3397
- State rank
- #40 of 73 in FL
Livability — Miami
- Score
- 78/100
- State rank
- #177
- US rank
- #2724
Category grades
Schools grade is shown separately in the Schools card above.
Census & demographics
- Census place
- Miami, FL
- County
- Miami-Dade County · 2,697,751 people
- City population
- 827,308
- Metro
- Miami-Fort Lauderdale-Pompano Beach, FL
- Population (ZIP)
- 34,964
- Household income
- $61,009
- Rent vs Own
- Severe rent burden
- 5231.0
Population outlook (Miami-Dade County) Hauer SSP2
- Today (2025)
- 3,126,439 people
- By 2030
- 3,325,765 · +6.4%
- By 2040
- 3,697,561 · +18.3%
- By 2050
- 4,012,134 · +28.3%
- By 2075
- 4,605,612 · +47.3%
- By 2100
- 4,866,598 · +55.7%
Race, ethnicity, and origin ACS 2023
- Neighborhood character
- Predominantly Hispanic (73%)
- Race & ethnicity
- Hispanic / Latino 73% Two or more races 44% White 17% Black 4% Asian 3%
- Hispanic origin (detail)
- Mexican 3% Puerto Rican 3% Cuban 24% Dominican 4%
- Common ancestry
- Romanian 2% Estonian 1% Lithuanian 1%
- Foreign-born
- 60% · Canada, Jamaica, Guatemala
- Languages at home
- 23% English-only · Spanish 70% Other Indo-European 2% Russian/Polish/Slavic 1%
Political lean MEDSL · Miami-Dade
- 2024 margin
- R (+11.4) · D 43.9% · R 55.4%
- 2008→2024 swing
- -27.6pp toward R · 2008: 16.1pp · 2024: -11.4pp
- All cycles
- 2024: R+11.4 2020: D+7.3 2016: D+29.6 2012: D+23.7 2008: D+16.1
Not yet ingested
- Civics
- —
Market trends
- HPI YoY
- ▼ -1.79%
- Current HPI
- 344.7752
- Rent YoY
- ▼ -0.53%
- Metro
- Miami-Fort Lauderdale-Pompano Beach, FL
- State GDP YoY
- ▲ 3.28%
- F500 in state
- 36
Industry mix (Fortune 500 HQ in FL)
| Industry | F500 HQs | Revenue |
|---|---|---|
| Industrial Technology | 2 | $29B |
|
||
| Insurance | 2 | $17B |
|
||
| Retail | 1 | $60B |
|
||
| Technology Distribution | 1 | $58B |
|
||
| Homebuilding | 1 | $35B |
|
||
| Technology Manufacturing | 1 | $35B |
|
||
Price history
-72.6% since first listed17 events — show timeline
- 2026-03-09 Listed $219,000 MARMLS
- 2026-01-21 Listing Removed — MARMLS
- 2025-07-18 Listed $219,000 MARMLS
- 2025-06-28 Listing Removed — MARMLS
- 2025-05-08 Price Changed $219,000 MARMLS
- 2025-04-23 Price Changed $229,000 MARMLS
- 2025-04-06 Price Changed $235,000 MARMLS
- 2025-03-10 Listed $245,000 MARMLS
- 2022-05-16 Sold (Public Records) $185,000 Public Records
- 2022-03-31 Sold (MLS) $185,000 MARMLS
- 2022-02-24 Pending — MARMLS
- 2022-02-09 Relisted — MARMLS
- 2022-02-06 Pending — MARMLS
- 2022-01-07 Price Changed $189,999 MARMLS
- 2021-11-16 Listed $199,999 MARMLS
- 2005-10-31 Sold (Public Records) $150,500 Public Records
- 2005-06-06 Sold (Public Records) $800,000 Public Records
Property tax history
+18.4%/yrLatest (2025): $2,566 · -0.2% YoY. Source: county tax records.
Cash-flow waterfall
monthlySold comps — $/sqft
last 12 mo · ≤1 miLoading sold comps…