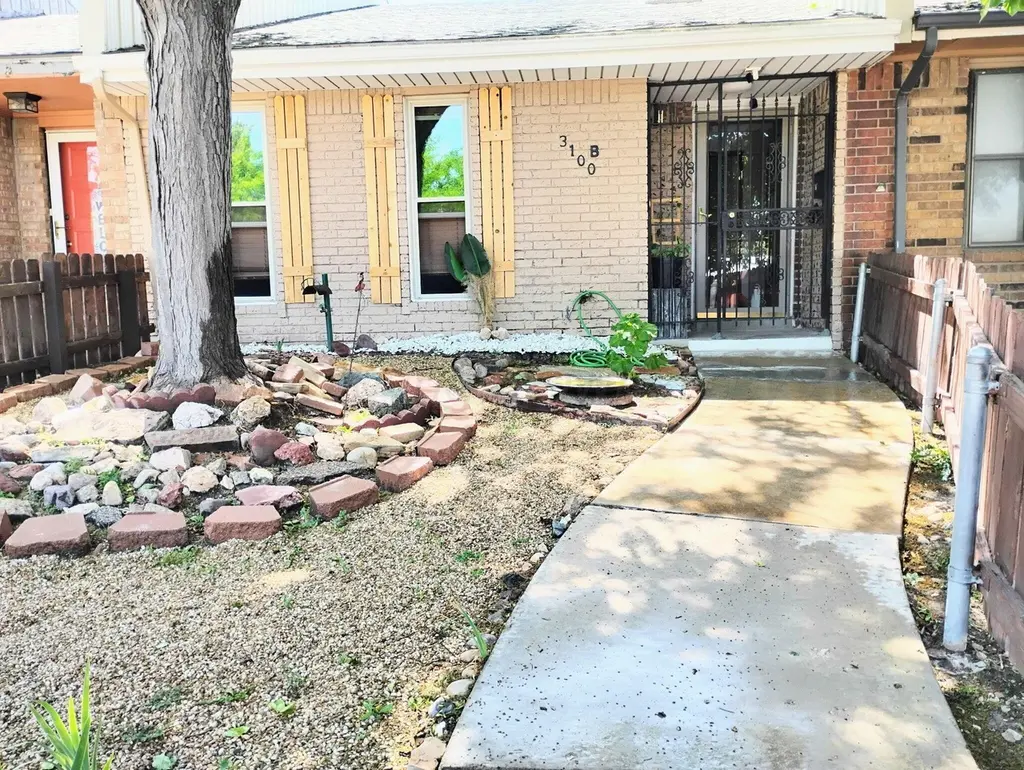
3100 Janet Dr · Amarillo, TX
Flood risk 4/10 · Minor
- FEMA flood zone
- X (shaded)
- Chance of flooding over 30 yrs
- 0.22%
- Est. flood insurance / yr
- —
Fire risk 2/10 · Minimal
- Est. fire insurance / yr
- $1,222 – $2,270
Heat risk 4/10 · Minor
- Hot days now (above 97°F)
- 7 days/yr
- Hot days in 30 yrs
- 20 days/yr
Wind risk 2/10 · Minimal
- Chance of severe wind over 30 yrs
- —
Air-quality risk No data
- Unhealthy air days now
- —
- Unhealthy air days in 30 yrs
- —
Risk factors via First Street. Map © Google.
Why this score? — see what drove the D grade
The composite is a weighted blend of 9 inputs, each scored 0–100. Each bar is that input's sub-score; the figure is the points it added to the 100-point composite (weight × sub-score).
- Cash flow +12.6/30.0
- ARV discount +7.5/15.0
- DSCR +3.8/10.0
- Rent growth +3.8/5.0
- Condition / age +3.8/5.0
- 1% rule +3.6/10.0
- Schools +3.6/10.0
- Livability +3.3/5.0
- Appreciation +0.0/10.0
$142,000
🖨 Deal sheet (PDF) 📄 Offer letter ✓ Due diligence
Listing remarks
Opportunity for ASSUMABLE VA LOAN with 5% interest rate!! Tenant-occupied with tenant to remain, this updated 2 bedroom, 2 bath, 2 car garage townhome offers low-maintenance, income-producing ownership in a convenient Amarillo location. Major improvements are already complete, allowing investors to step in with peace of mind! Per seller, updates include new foundation (2023 -with 50-year warranty), new roof (2023), HVAC replaced in 2019 with one year of ''Home Comfort Club'' protection paid by seller, 40-gallon water heater (2019), updated outlets with full electrical inspection completed October 2025, new ceiling fans, new living room carpet, updated bathroom flooring, fresh paint, and upd
Key facts
- Hvac replaced
- New foundation
- New ceiling fans
Tags
Property features AI
Exterior
- Parking: Attached rear-facing garage with automatic door; 2 garage spaces
- Utilities: Public water; Public sewer
- Home design: Single-family residence; One level
- Construction: Brick / brick veneer exterior; Slab foundation; Built with composition roof
- Exterior features: Dog run; Wood fencing; Composition roof
Interior
- Kitchen: Range; Dishwasher; Gas water heater
- Bathrooms: One full bathroom; One three-quarter bathroom
- Heating & cooling: Central air; Ceiling fan(s)
- Interior features: Skylight(s); Wood-burning fireplace in the living room
Neighborhood map
What this means for you Summary
Snapshot
- This is a 2-bed/2.0-bath single-family listed at $142k. Condition is rated good.
Deal economics
- At list price, monthly cash flow is $-18 ($-221/yr) — negative.
- To cash-flow at today's rent, offer at most $139k (1.9% below list).
- To meet the 1% rule (rent ≥ 1% of price), the offer needs to be $122k (14.2% below list).
- Recommended offer: $122k (14.2% below list) — sets the bar for 1% rule.
Location & tenants
- Location reads 66/100 on livability (#624 in TX) — a middle-class / working-renter tenant base. Strengths: cost of living A+, housing A+; Watch: amenities C-, crime F, commute F.
- Amarillo ISD (urban): math 44% / reading 41% proficiency, ranked #336 of 826 in TX (top 41%) — families likely to look elsewhere, expect single-tenant / working-renter base with shorter leases.
- Zoned schools: Coronado El (math 37% / reading 37%, grade F, #1,769 of 4,322 statewide, top 44%, 418 students, 71% FRL); Austin Middle (math 47% / reading 43%, grade D, #479 of 1,662 statewide, top 29%, 677 students, 63% FRL); Tascosa H S (math 36% / reading 45%, grade F, #798 of 1,632 statewide, top 49%, 2,187 students, 57% FRL).
- Market conditions: Rents rising fast (+5.2%/yr); 157 active listings in the ZIP; 19 comparable units currently listed for rent nearby; rentals at typical pace (median 23d on market — plan ~3-4 weeks tenant-placement turnaround); 1,214 units permitted in Potter County in 2024 (650 in 5+ unit buildings).
Forward outlook
- Local home prices are declining (-3.0%/yr); year-one equity from $982 of loan paydown is wiped out by about $4k of value loss. Plan a longer hold.
Negotiation context
- Only 3 days on market — expect competitive offers; lowballing is unlikely to land.
- 3 sale attempts since 6y ago with the ask held roughly flat each time — persistent listings suggest the price (not the market) is what's stuck; bring a comps-based counter.
Questions for the listing agent
- What do current leases actually rent for vs. the listed asking? Can we see a recent rent roll and the last 12 months of T-12 income?
- Is there a deadline driving the sale (1031 exchange, divorce, estate, relocation)? That informs how much negotiation room exists.
- Schools are D-rated, which usually means shorter tenancies and higher turnover. Who's the typical renter profile here, and what's been the actual vacancy rate?
- Crime grade is F in this area — have there been break-ins, vandalism, or insurance claims at this property in the last 3 years? What carrier currently insures it and at what premium?
- The area grade is low — what's the realistic commute time and amenity access for the typical tenant pool here? Any planned neighborhood developments (good or bad) we should know about?
- What's the average days-on-market for RENTAL listings here right now (not sales)? A rising rental-DOM trend means longer vacancies and softer asking-rent achievability than the comps imply.
- What's the recent tenant-quality profile in this submarket — average credit score on applications, eviction rate, late-payment / NSF rate, and stable-employment percentage? A property-management company in the area should have these aggregated.
- How much new for-sale + rental construction is in the pipeline within 1–3 miles? Heavy new supply typically softens prices + rents 12–24 months out; constrained supply supports both.
Investment metrics
- 1% rule
- 0.86% ✗
- Cap rate
- 6.14%
- Cash-on-cash
- -0.56%
- DSCR
- 0.98
- GRM
- 9.7
CMA / ARV
No comps found within radius.
Projected returns pro-forma
-3.0% appreciation · 5.24% rent growth · sell at horizon
- IRR
- -14.7%
- Equity multiple
- 0.46×
- Total profit
- $-21,357
- Equity at exit
- $21,173
- IRR
- -2.7%
- Equity multiple
- 0.80×
- Total profit
- $-7,969
- Equity at exit
- $12,278
Cash invested: $39,760 (down + closing). Projections, not guarantees.
Landlord ↔ Tenant lean methodology
- Overall (STATE)
- 87 Strongly Landlord-Friendly
- State Texas
- 87 Strongly Landlord-Friendly · R+5
- County
- — inherits STATE
- City
- — inherits STATE
ZIP-level market 79109
- Rents YoY
- 5.2%
- Active inventory
- 157
- Price-to-rent
- 9.7×
Monthly cashflow live
- Estimated rent
- $1,219 high interval (Pro) →
- Mortgage (P&I)
- −$745
- Tax est. 1.5%
- −$178 /mo · $2,130/yr
- Insurance
- −$59
- HOA
- −$0
- Vacancy / Maint / Mgmt
- −$256
- Net cashflow
- $-18
Break-even live
Sensitivity live
| Price | -10% $80 | -5% $31 | +0% $-18 | +5% $-67 | +10% $-117 |
|---|---|---|---|---|---|
| Rent | -10% $-115 | -5% $-67 | +0% $-18 | +5% $30 | +10% $78 |
| Rate | -1.0pp $53 | -0.5pp $18 | base $-18 | +0.5pp $-55 | +1.0pp $-93 |
UW: 25.0% down · 7.5% · 30yr · 1.5% tax · 5.0% vac · 8.0% maint · 8.0% mgmt
Financing live
Cash to close
- Down payment
- $35,500
- Closing costs
- $4,260
- Reserves months
- —
- Total cash needed
- —
Loan-product check · same deal, 3 products live
Conventional
25% down · 7.5% · 30yr
- Down + closing
- —
- Monthly P&I
- —
- Monthly cashflow
- —
- DSCR
- —
- Eligible?
- —
Personal DTI + credit; lowest rate.
DSCR
20% down · 8.5% · 30yr
- Down + closing
- —
- Monthly P&I
- —
- Monthly cashflow
- —
- DSCR
- —
- Eligible?
- —
No personal income docs; deal must DSCR.
Hard money
10% down · 12.0% · 12mo
- Down + closing
- —
- Monthly P&I
- —
- Monthly cashflow
- —
- DSCR
- —
- Eligible?
- —
Short-term bridge; refi at stabilization.
Rent comps 19 comps
| Address | Beds | Baths | Sqft | Rent | $/sqft | DOM | Units | Dist |
|---|---|---|---|---|---|---|---|---|
| 3500 Mockingbird Ln Amarillo, TX | 1.0–3.0 | 1.0–2.0 | 834 | $985 | $1.18 | 23d | 1 | 0.16mi |
| 2601 Linda Cir Amarillo, TX | 1.0–2.0 | 1.0 | 650 | $1,045 | $1.61 | 45d | 1 | 0.37mi |
| 3110 SW 27th Ave Amarillo, TX | 1.0–3.0 | 1.0–2.0 | 1085 | $1,217 | $1.12 | 15d | 3 | 0.46mi |
| 3110 SW 27th Ave Amarillo, TX | 3.0 | 2.0 | 1470 | $1,482 | $1.01 | 23d | 1 | 0.46mi |
| 3019 W 28th Ave Amarillo, TX | 1.0–2.0 | 1.0–2.0 | 795 | $775 | $0.97 | 45d | 1 | 0.56mi |
| 3003 SW 27th Ave Amarillo, TX | 2.0 | 1.5 | 808 | $895 | $1.11 | 15d | 1 | 0.60mi |
| 3005 SW 28th Ave Unit C Amarillo, TX | 3.0 | 2.0 | 1480 | $1,700 | $1.15 | 15d | 1 | 0.62mi |
| 3007 Curtis Dr Unit B Amarillo, TX | 2.0 | 1.0 | 750 | $950 | $1.27 | 45d | 1 | 0.66mi |
| 3001 Curtis Dr Unit A Amarillo, TX | 2.0 | 1.0 | 713 | $1,100 | $1.54 | 23d | 1 | 0.70mi |
| 2809 Duncan Dr Unit B- 1 Amarillo, TX | 1.0 | 1.0 | 825 | $695 | $0.84 | 45d | 1 | 0.71mi |
| 3719 Julie Dr Amarillo, TX | 3.0 | 2.0 | 1455 | $1,675 | $1.15 | 15d | 1 | 0.75mi |
| 3319 Teckla Blvd Amarillo, TX | 3.0 | 1.0 | 1085 | $1,600 | $1.47 | 23d | 1 | 0.80mi |
| 1809 Chama St Amarillo, TX | 3.0 | 1.0 | 1396 | $1,600 | $1.15 | 45d | 1 | 0.89mi |
| 4109 Tucson Dr Amarillo, TX | 3.0 | 2.0 | 1395 | $1,950 | $1.40 | 23d | 1 | 1.17mi |
| 1326 Hillcrest St Amarillo, TX | 3.0 | 1.0 | 958 | $1,295 | $1.35 | 23d | 1 | 1.22mi |
| 3118 SW 15th Ave Amarillo, TX | 2.0–3.0 | 1.0–2.0 | 1015 | $640 | $0.63 | 15d | 17 | 1.31mi |
| 4101 SW 45th Ave Amarillo, TX | 1.0–2.0 | 1.0 | 767 | $955 | $1.24 | 15d | 3 | 1.38mi |
| 2030 Crockett St Amarillo, TX | 3.0 | 1.5 | 1307 | $1,750 | $1.34 | 15d | 1 | 1.38mi |
| 4215 SW 11th Ave Amarillo, TX | 1.0 | 1.0 | 1224 | $995 | $0.81 | 23d | 1 | 1.45mi |
Listing history 21 events
-
2026-06-21days on market $142,000 Active 3 DOM
-
2026-06-18days on market $142,000 Active 1 DOM
-
2026-06-10days on market $142,000 Active 182 DOM
-
2026-06-09days on market $142,000 Active 181 DOM
-
2026-06-08days on market $142,000 Active 180 DOM
-
2026-06-07days on market $142,000 Active 179 DOM
-
2026-06-03days on market $142,000 Active 175 DOM
-
2026-06-02days on market $142,000 Active 174 DOM
-
2026-06-01days on market $142,000 Active 173 DOM
-
2026-05-31days on market $142,000 Active 172 DOM
-
2026-05-30days on market $142,000 Active 171 DOM
-
2026-03-28price $142,000 766-char remark
-
2026-02-24price $147,500 766-char remark
-
2025-12-10$150,000 Active 766-char remark
-
2024-05-16price $173,000
-
2024-04-22price $169,900
-
2023-05-18soldstatus Closed
-
2023-04-14price $155,000
-
2023-02-10$162,900 Active
-
2020-03-19soldstatus
-
2020-01-12$124,900
ⓘ Source: listings_history table (triggers on properties + properties_extension) + one-shot
backfill from property_details.listing_events for pre-trigger history.
Climate risk First Street
- Flood 4/10 Moderate FEMA zone X (shaded) · 22% chance over 30 yrs
- Wildfire 2/10 Low
- Heat 4/10 Moderate 7 d/yr ≥97°F today · 20 d/yr by 30 yrs out
- Wind 2/10 Low
Nearby sold comps map
Loading sold comps map…
Walkable amenities ~0.75 mi
Loading nearby amenities…
Taxation est. · year 1
- Rental income
- $14,626
- − Mortgage interest
- −$7,954
- − Property taxes
- −$2,130
- − Insurance
- −$710
- − Repairs & maintenance
- −$1,170
- − Management
- −$1,170
- − Depreciation
- −$4,131
- Taxable loss
- −$2,639
- Est. tax savings @ 24.0%
- +$633
- After-tax cash flow
- $412/yr
For passive investors: Depreciation is non-cash, so a rental often shows a tax loss while cash-flowing — sheltering income. Rental losses are passive: they offset passive income freely, and up to $25,000/yr can offset ordinary (W-2) income if you actively participate and your MAGI is under $100k (phasing out to $0 by $150k); unused losses carry forward. On sale, claimed depreciation is recaptured at up to 25%, and gains may owe capital-gains tax (a 1031 exchange can defer both). Figures are a year-1 estimate at your 24.0% rate — not tax advice; consult a CPA.
Condition & rehab AI · 12 photos
This single-family home is in good condition with recent updates, including a new roof and HVAC. It offers a good investment opportunity with potential for rental or resale value increases through minor cosmetic improvements.
Repairs flagged
- Minor Landscaping — Needs trimming and mulching
- Minor Kitchen cabinets — Worn and could benefit from a fresh coat of paint
Value-add opportunities
- Both Paint exterior shutters — Enhances curb appeal and value
- Both Landscaping improvements — Improves curb appeal and rental value
Renovation cost estimate screening
| Repair item | Severity | Est. cost |
|---|---|---|
| Landscaping · Needs trimming and mulching | Minor | $500–3,000 |
| Kitchen cabinets · Worn and could benefit from a fresh coat of paint | Minor | $500–3,000 |
| Total estimated repair cost · 2 items | $1,000–6,000 |
Value-add ROI direction
- Both Paint exterior shutters — Enhances curb appeal and value ↑
- Both Landscaping improvements — Improves curb appeal and rental value ↑
ⓘ Cost ranges are severity-bucket heuristics (US national rule-of-thumb). Get contractor quotes + a written scope before underwriting a rehab budget.
Schools (NCES district)
- District
- Amarillo ISD
- NCES district ID
- 4808130
- Math proficiency
- 44% ▼ -9.00%
- Reading proficiency
- 41% ▼ -3.00%
- Median HH income
- $43,478
- Composite
- 35.96/100
- National rank
- #4798
- State rank
- #336 of 826 in TX
Livability — Amarillo
- Score
- 66/100
- State rank
- #624
- US rank
- #11876
Category grades
Schools grade is shown separately in the Schools card above.
Census & demographics
- Census place
- Amarillo, TX
- County
- Randall County · 137,351 people
- City population
- 185,802
- Metro
- Amarillo, TX
- Population (ZIP)
- 43,578
- Household income
- $70,435
- Rent vs Own
- Severe rent burden
- 1640.0
Population outlook (Potter County) Hauer SSP2
- Today (2025)
- 121,296 people
- By 2030
- 120,883 · -0.3%
- By 2040
- 119,668 · -1.3%
- By 2050
- 117,788 · -2.9%
- By 2075
- 110,250 · -9.1%
- By 2100
- 92,923 · -23.4%
Race, ethnicity, and origin ACS 2023
- Neighborhood character
- Predominantly White (70%)
- Race & ethnicity
- White 70% Hispanic / Latino 19% Two or more races 12% Black 5%
- Hispanic origin (detail)
- Mexican 16%
- Common ancestry
- Italian 3% Slovak 2% Lithuanian 2%
- Foreign-born
- 4% · Canada
- Languages at home
- 89% English-only · Spanish 9% Other Indo-European 1%
Political lean MEDSL · Potter
- 2024 margin
- Solid R (+44.4) · D 27.3% · R 71.7% · Other 1.1%
- 2008→2024 swing
- -5.0pp toward R · 2008: -39.4pp · 2024: -44.4pp
- All cycles
- 2024: R+44.4 2020: R+38.7 2016: R+41.9 2012: R+44.6 2008: R+39.4
Not yet ingested
- Civics
- —
Market trends
- HPI YoY
- ▼ -227.95%
- Current HPI
- 171.6795
- Rent YoY
- ▲ 5.24%
- Metro
- Amarillo, TX
- State GDP YoY
- ▲ 3.95%
- F500 in state
- 110
Industry mix (Fortune 500 HQ in TX)
| Industry | F500 HQs | Revenue |
|---|---|---|
| Energy | 16 | $1,198B |
|
||
| Technology | 5 | $198B |
|
||
| Engineering / Construction | 4 | $72B |
|
||
| Energy Services | 3 | $60B |
|
||
| Utilities | 3 | $41B |
|
||
| Healthcare | 2 | $330B |
|
||
Price history
+13.7% since first listed10 events — show timeline
- 2026-06-11 Listed $142,000 AARMLS
- 2026-03-28 Price Changed $142,000 AARMLS
- 2026-02-24 Price Changed $147,500 AARMLS
- 2024-05-16 Price Changed $173,000 AARMLS
- 2024-04-22 Price Changed $169,900 AARMLS
- 2023-05-18 Sold (MLS) — AARMLS
- 2023-04-14 Price Changed $155,000 AARMLS
- 2023-02-10 Listed $162,900 AARMLS
- 2020-03-19 Sold (MLS) — AARMLS
- 2020-01-12 Listed $124,900 AARMLS
Cash-flow waterfall
monthlySold comps — $/sqft
last 12 mo · ≤1 miLoading sold comps…