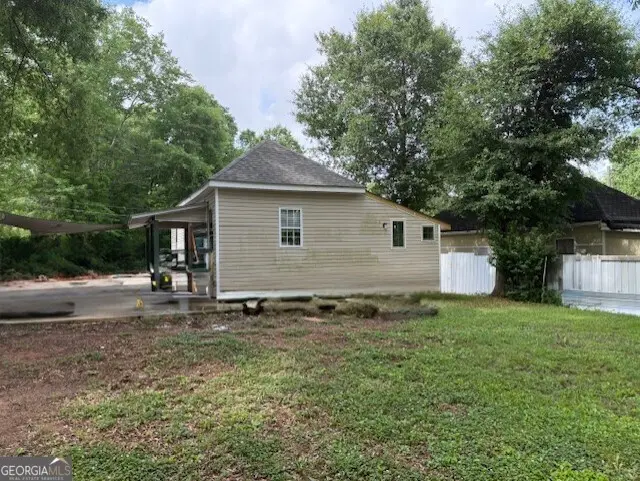
827 Hammock St · Griffin, GA
Flood risk 1/10 · Minimal
- FEMA flood zone
- X (unshaded)
- Chance of flooding over 30 yrs
- 0.0%
- Est. flood insurance / yr
- $507 – $1,088
Fire risk 3/10 · Minor
- Est. fire insurance / yr
- $963 – $1,789
Heat risk 6/10 · Moderate
- Hot days now (above 104°F)
- 7 days/yr
- Hot days in 30 yrs
- 17 days/yr
Wind risk 6/10 · Moderate
- Chance of severe wind over 30 yrs
- 45.0%
Air-quality risk 4/10 · Minor
- Unhealthy air days now
- 4 days/yr
- Unhealthy air days in 30 yrs
- 5 days/yr
Risk factors via First Street. Map © Google.
Why this score? — see what drove the D grade
The composite is a weighted blend of 9 inputs, each scored 0–100. Each bar is that input's sub-score; the figure is the points it added to the 100-point composite (weight × sub-score).
- Cash flow +15.6/30.0
- ARV discount +11.7/15.0
- DSCR +4.8/10.0
- 1% rule +3.3/10.0
- Rent growth +2.9/5.0
- Livability +2.7/5.0
- Condition / age +2.5/5.0
- Schools +1.4/10.0
- Appreciation +0.0/10.0
$150,000
🖨 Deal sheet (PDF) 📄 Offer letter ✓ Due diligence
Listing remarks
GREAT PROPERTY FOR FIRST TIME HOME BUYER OR INVESTOR. MOVE-IN READY WITH ALL APPLIANCES STAYING WITH THE SALE OF THE PROPERTY. CONVENIENT LOCATION FOR ACTIVITIES. DON'T MISS OUT ON THIS OPPORTUNITY, CALL TODAY.
Key facts
- 9,583 sq ft lot
- Built 1960
- Listed 11 days
Property features AI
Finance
- Other: Listing terms: Cash or Conventional
- HOA & community: No HOA
Exterior
- Parking: Off-street parking
- Utilities: Public water; Public sewer; Electricity available; Sewer connected; Water available
- Home design: Single-family house; One-level (single story); Resale property
- Construction: Built in 1960; Vinyl siding; Composition roof; House structure
- Exterior features: City lot; Level lot; Has a view
Interior
- Kitchen: Dishwasher; Microwave; Refrigerator; Stainless steel appliances
- Bedrooms: 3 bedrooms (all on the main level)
- Flooring: Laminate flooring
- Bathrooms: 1 full bathroom; 1 half bathroom (1.5 total)
- Heating & cooling: Central heating; Central air conditioning
- Interior features: Separate shower; Family room
- Laundry & utility: Washer and dryer; Electric water heater; Laundry room
Neighborhood map
What this means for you Summary
Snapshot
- This is a 2-bed/1.0-bath single-family listed at $150k.
Deal economics
- At list price, monthly cash flow is $62 ($747/yr) — positive.
- The deal already cash-flows at list — no discount required.
- To meet the 1% rule (rent ≥ 1% of price), the offer needs to be $125k (16.7% below list).
- Recommended offer: $125k (16.7% below list) — sets the bar for 1% rule.
- Cap rate 6.8% vs local median 4.3% in Griffin — top-decile yield for the area; either an underpriced asset or a hidden risk that comps aren't pricing in. Stress-test before assuming the spread holds.
Location & tenants
- Location reads 54/100 on livability (#529 in GA) — a working-class tenant base; expect higher turnover. Strengths: cost of living A+, housing A+; Watch: crime F, amenities F, commute F.
- Griffin-Spalding County (suburban): math 13% / reading 19% proficiency, ranked #151 of 174 in GA (top 87%) — low school quality limits family demand, transient renter base, plan for 1-2y turnover; 68% free/reduced lunch — lower-income household profile, screen leases tightly.
- Zoned schools: Atkinson Elementary School (math 2% / reading 2%, grade F, #1,204 of 1,228 statewide, top 100%, 431 students, 98% FRL); Cowan Road Middle School (math 8% / reading 14%, grade F, #426 of 470 statewide, top 91%, 543 students, 98% FRL); Griffin High School (math 7% / reading 19%, grade F, #331 of 424 statewide, top 78%, 1,498 students, 98% FRL) — zoned schools average 98% FRL vs 68% district-wide (30 pts higher); higher-poverty schools than district average — tighter screening recommended.
- Market conditions: Rents rising (+1.4%/yr); 236 active listings in the ZIP; 40 comparable units currently listed for rent nearby; rentals at typical pace (median 24d on market — plan ~3-4 weeks tenant-placement turnaround); 342 units permitted in Spalding County in 2024 (0 in 5+ unit buildings).
Forward outlook
- Local home prices are declining (-3.0%/yr); year-one equity from $1k of loan paydown is wiped out by about $4k of value loss. Plan a longer hold.
- Spalding County population projected at -15% by 2050 — secular population decline; favor cash flow + early exit over multi-decade hold.
Negotiation context
- Only 11 days on market — expect competitive offers; lowballing is unlikely to land.
- 7 sale attempts since 9y ago with the ask held roughly flat each time — persistent listings suggest the price (not the market) is what's stuck; bring a comps-based counter.
- Current owner paid $14k; list at $150k implies a 971% gain — meaningful room to come down on a strong offer.
Risks & watch-outs
- Climate carrying-cost: major wind risk, 45% chance of damaging wind over 30y; extreme-heat days projected 7→17/yr by 2055 (HVAC capex compounding) — expect insurance premiums to compound above CPI over the hold.
Questions for the listing agent
- Built in 1960 — when were the roof, HVAC, electrical panel, plumbing, and water heater last replaced?
- Is there a deadline driving the sale (1031 exchange, divorce, estate, relocation)? That informs how much negotiation room exists.
- Schools are F-rated, which usually means shorter tenancies and higher turnover. Who's the typical renter profile here, and what's been the actual vacancy rate?
- Crime grade is F in this area — have there been break-ins, vandalism, or insurance claims at this property in the last 3 years? What carrier currently insures it and at what premium?
- The area grade is low — what's the realistic commute time and amenity access for the typical tenant pool here? Any planned neighborhood developments (good or bad) we should know about?
- What's the average days-on-market for RENTAL listings here right now (not sales)? A rising rental-DOM trend means longer vacancies and softer asking-rent achievability than the comps imply.
- What's the recent tenant-quality profile in this submarket — average credit score on applications, eviction rate, late-payment / NSF rate, and stable-employment percentage? A property-management company in the area should have these aggregated.
- How much new for-sale + rental construction is in the pipeline within 1–3 miles? Heavy new supply typically softens prices + rents 12–24 months out; constrained supply supports both.
Investment metrics
- 1% rule
- 0.83% ✗
- Cap rate
- 6.79%
- Cash-on-cash
- 1.78%
- DSCR
- 1.08
- GRM
- 10.0
CMA / ARV
- ARV (on-the-fly)
- $165,376
- Comps found
- 12
Show comp detail 12 sales within ~0.75 mi
| Address | Dist | Beds/Ba | Sqft | Sold | Price | $/sf | Match |
|---|---|---|---|---|---|---|---|
| 411 Palace St | 0.41mi | 2/2.0 | 1,178 (-3%) | 5mo | $196,000 | $166 | 68 |
| 822 W Broad St | 0.20mi | 3/2.0 (+1) | 1,166 (-4%) | 9mo | $169,000 | $145 | 67 |
| 210 N 19th St | 0.37mi | 3/2.0 (+1) | 1,104 (-9%) | 1mo | $155,000 | $140 | 58 |
| 1123 Drewery Ave | 0.46mi | 2/1.0 | 1,064 (-12%) | 1mo | $145,000 | $136 | 57 |
| 1024 Lake Ave | 0.26mi | 3/2.0 (+1) | 1,344 (+10%) | 6mo | $90,000 | $67 | 56 |
| 1332 Pleasant Ave | 0.55mi | 2/1.0 | 1,124 (-8%) | 10mo | $153,000 | $136 | 53 |
| 209 W Tinsley St | 0.61mi | 2/2.0 | 1,320 (+9%) | 1mo | $127,000 | $96 | 53 |
| 203 Hillside Cir | 0.56mi | 2/1.0 | 1,053 (-13%) | 6mo | $85,000 | $81 | 47 |
| 229 Willow St | 0.70mi | 2/1.0 | 1,108 (-9%) | 9mo | $70,000 | $63 | 45 |
| 320 S 12th St | 0.59mi | 3/2.0 (+1) | 1,387 (+14%) | 5mo | $265,000 | $191 | 36 |
| 1054 W College Ext St | 0.67mi | 3/1.0 (+1) | 1,053 (-13%) | 8mo | $149,900 | $142 | 35 |
| 1050 W College Ext St | 0.67mi | 3/2.0 (+1) | 1,394 (+15%) | 9mo | $142,000 | $102 | 28 |
Match score weights: distance 35% · size 25% · config 20% · recency 20%. Top-matched comps best support the ARV.
Projected returns pro-forma
-3.0% appreciation · 1.42% rent growth · sell at horizon
- IRR
- -15.1%
- Equity multiple
- 0.47×
- Total profit
- $-22,345
- Equity at exit
- $22,365
- IRR
- -9.2%
- Equity multiple
- 0.47×
- Total profit
- $-22,326
- Equity at exit
- $12,969
Cash invested: $42,000 (down + closing). Projections, not guarantees.
Landlord ↔ Tenant lean methodology
- Overall (STATE)
- 90 Strongly Landlord-Friendly
- State Georgia
- 90 Strongly Landlord-Friendly · R+3
- County
- — inherits STATE
- City
- — inherits STATE
ZIP-level market 30224
- Rents YoY
- 1.4%
- Active inventory
- 236
- Price-to-rent
- 10.0×
Monthly cashflow live
- Estimated rent
- $1,249 high interval (Pro) →
- Mortgage (P&I)
- −$787
- Tax from tax record
- −$76 /mo · $908/yr
- Insurance
- −$62
- HOA
- −$0
- Vacancy / Maint / Mgmt
- −$262
- Net cashflow
- $62
Break-even live
Sensitivity live
| Price | -10% $147 | -5% $105 | +0% $62 | +5% $20 | +10% $-23 |
|---|---|---|---|---|---|
| Rent | -10% $-36 | -5% $13 | +0% $62 | +5% $112 | +10% $161 |
| Rate | -1.0pp $138 | -0.5pp $100 | base $62 | +0.5pp $23 | +1.0pp $-16 |
UW: 25.0% down · 7.5% · 30yr · 1.5% tax · 5.0% vac · 8.0% maint · 8.0% mgmt
Financing live
Cash to close
- Down payment
- $37,500
- Closing costs
- $4,500
- Reserves months
- —
- Total cash needed
- —
Loan-product check · same deal, 3 products live
Conventional
25% down · 7.5% · 30yr
- Down + closing
- —
- Monthly P&I
- —
- Monthly cashflow
- —
- DSCR
- —
- Eligible?
- —
Personal DTI + credit; lowest rate.
DSCR
20% down · 8.5% · 30yr
- Down + closing
- —
- Monthly P&I
- —
- Monthly cashflow
- —
- DSCR
- —
- Eligible?
- —
No personal income docs; deal must DSCR.
Hard money
10% down · 12.0% · 12mo
- Down + closing
- —
- Monthly P&I
- —
- Monthly cashflow
- —
- DSCR
- —
- Eligible?
- —
Short-term bridge; refi at stabilization.
Rent comps 40 comps
| Address | Beds | Baths | Sqft | Rent | $/sqft | DOM | Units | Dist |
|---|---|---|---|---|---|---|---|---|
| 716 Ray St Griffin, GA | 2.0 | 1.0 | 788 | $1,300 | $1.65 | 45d | 1 | 0.12mi |
| 353 N 13th St Unit 353 Griffin, GA | 2.0 | 1.0 | 1059 | $950 | $0.90 | 25d | 1 | 0.14mi |
| 363 N 16th St Griffin, GA | 3.0 | 2.0 | 1300 | $1,550 | $1.19 | 46d | 1 | 0.14mi |
| 813 W Quilly St Griffin, GA | 2.0 | 1.0 | 838 | $1,200 | $1.43 | 6d | 1 | 0.21mi |
| 732 Williams St Griffin, GA | 2.0 | 1.0 | 1287 | $1,200 | $0.93 | 6d | 1 | 0.22mi |
| 731 Williams St Unit A Griffin, GA | 1.0 | 1.0 | 770 | $800 | $1.04 | 45d | 1 | 0.24mi |
| 708 Ellis St Griffin, GA | 2.0 | 1.0 | 768 | $1,000 | $1.30 | 4d | 1 | 0.26mi |
| 358 N 19th St Apt E Griffin, GA | 2.0 | 1.0 | 936 | $1,025 | $1.10 | 0d | 1 | 0.33mi |
| 358 N 19th St Unit 358E Griffin, GA | 2.0 | 1.5 | 896 | $1,025 | $1.14 | 0d | 1 | 0.33mi |
| 419 N 18th St Unit F Griffin, GA | 2.0 | 1.0 | 865 | $1,050 | $1.21 | 25d | 1 | 0.34mi |
| 419 N 18th St Griffin, GA | 2.0 | 1.0 | 865 | $1,050 | $1.21 | 20d | 1 | 0.34mi |
| 502 W Broadway St Griffin, GA | 1.0–2.0 | 1.0–2.0 | 1133 | $1,745 | $1.54 | 0d | 17 | 0.35mi |
| 415 N 18th St Unit 417 D Griffin, GA | 2.0 | 1.0 | 865 | $1,050 | $1.21 | 45d | 1 | 0.35mi |
| 356 N 19th St Griffin, GA | 2.0 | 1.5 | 896 | $995 | $1.11 | 0d | 1 | 0.36mi |
| 614 W Solomon St Griffin, GA | 1.0 | 1.0 | 1404 | $799 | $0.57 | 25d | 1 | 0.37mi |
| 519 W Cherry St Griffin, GA | 2.0 | 1.0 | 864 | $1,100 | $1.27 | 0d | 1 | 0.41mi |
| 503 Wheeler St Griffin, GA | 2.0 | 1.0 | 1028 | $1,250 | $1.22 | 45d | 1 | 0.43mi |
| 315 W Chappell St Unit 317 Griffin, GA | 2.0 | 1.0 | 980 | $900 | $0.92 | 25d | 1 | 0.48mi |
| 738 W Poplar St Unit 4 Griffin, GA | 1.0 | 1.0 | 755 | $600 | $0.79 | 11d | 1 | 0.50mi |
| 614 W Poplar St Griffin, GA | 3.0 | 1.0 | 1100 | $1,100 | $1.00 | 0d | 1 | 0.52mi |
| 614 W Poplar St Griffin, GA | 3.0 | 1.0 | 1100 | $1,100 | $1.00 | 23d | 1 | 0.52mi |
| 616 W Poplar St Unit 1 Griffin, GA | 1.0 | 1.0 | 900 | $595 | $0.66 | 23d | 1 | 0.53mi |
| 215 Hillside Cir Griffin, GA | 2.0 | 1.0 | 1002 | $975 | $0.97 | 25d | 1 | 0.56mi |
| 217 W Central Ave Unit B Griffin, GA | 2.0 | 1.0 | 750 | $995 | $1.33 | 6d | 1 | 0.57mi |
| 207 Hillside Cir Griffin, GA | 3.0 | 1.0 | 1054 | $1,100 | $1.04 | 23d | 1 | 0.57mi |
| 617 Meriwether St Griffin, GA | 1.0–2.0 | 1.0 | 745 | $1,481 | $1.99 | 0d | 4 | 0.62mi |
| 521 Meriwether St Apt C Griffin, GA | 2.0 | 1.0 | 800 | $1,150 | $1.44 | 45d | 1 | 0.62mi |
| 521 Meriwether St Unit A Triplex Griffin, GA | 2.0 | 1.0 | 850 | $1,250 | $1.47 | 45d | 1 | 0.62mi |
| 521 Meriwether St Unit C Triplex Griffin, GA | 2.0 | 1.0 | 800 | $1,200 | $1.50 | 45d | 1 | 0.62mi |
| 416 W Poplar St Griffin, GA | 1.0–2.0 | 1.0 | 925 | $1,436 | $1.55 | 0d | 4 | 0.62mi |
| 308 N 8th St Griffin, GA | 3.0 | 2.0 | 1150 | $1,350 | $1.17 | 12d | 1 | 0.63mi |
| 205 W Cherry St Griffin, GA | 2.0 | 1.0 | 972 | $950 | $0.98 | 4d | 1 | 0.63mi |
| 422 Meriwether St Unit 2 Griffin, GA | 3.0 | 2.0 | 1100 | $1,250 | $1.14 | 14d | 1 | 0.66mi |
| 413 N Hill St Unit B Griffin, GA | 2.0 | 1.0 | 792 | $875 | $1.10 | 5d | 1 | 0.69mi |
| 1128 W College St Unit A-1 Model Unit Griffin, GA | 2.0 | 1.0 | 900 | $1,250 | $1.39 | 45d | 1 | 0.71mi |
| 212 Alabama St Griffin, GA | 2.0 | 1.0 | 728 | $995 | $1.37 | 45d | 1 | 0.72mi |
| 133 S Hill St Unit 201 Griffin, GA | 2.0 | 1.0 | 1350 | $1,299 | $0.96 | 45d | 1 | 0.78mi |
| 1320 N Cherokee Ave Griffin, GA | 3.0 | 2.0 | 1468 | $1,611 | $1.10 | 14d | 1 | 0.81mi |
| 816 Lane St Griffin, GA | 3.0 | 2.0 | 1120 | $1,300 | $1.16 | 45d | 1 | 0.83mi |
| 1104 Meriwether St Griffin, GA | 2.0 | 1.0 | 806 | $915 | $1.14 | 25d | 1 | 0.91mi |
Listing history 11 events
-
2026-06-21days on market $150,000 Active 11 DOM
-
2026-06-18statusdays on market $150,000 Active 8 DOM
-
2026-06-17remarks 211-char remark
-
2026-06-17days on market $150,000 Back On Market 7 DOM
-
2026-06-16remarks 192-char remark
-
2026-06-16statusdays on market $150,000 Back On Market 6 DOM
-
2026-06-04status $150,000 Under Contract 5 DOM
-
2026-06-03days on market $150,000 New 5 DOM
-
2026-06-02days on market $150,000 New 4 DOM
-
2026-06-01days on market $150,000 New 3 DOM
-
2026-05-31days on market $150,000 New 2 DOM
ⓘ Source: listings_history table (triggers on properties + properties_extension) + one-shot
backfill from property_details.listing_events for pre-trigger history.
Tax reassessment forecast GA · Resets to sale price
- Current annual tax
- $908 · $76/mo
- Projected year-2 tax
- $1,380 · $115/mo
- Expected delta
- +$472/yr (+$39/mo · 52.0%)
ⓘ Screening estimate from a state-policy table — verify with the county assessor before closing.
Climate risk First Street
- Flood 1/10 Low FEMA zone X (unshaded) · 0% chance over 30 yrs
- Wildfire 3/10 Moderate
- Heat 6/10 Major 7 d/yr ≥104°F today · 17 d/yr by 30 yrs out
- Wind 6/10 Major 45% chance of damaging wind over 30 yrs
- Air quality 4/10 Moderate 4 unhealthy d/yr today · 5 by 30 yrs out
Nearby sold comps map
Loading sold comps map…
Walkable amenities ~0.75 mi
Loading nearby amenities…
Taxation est. · year 1
- Rental income
- $14,994
- − Mortgage interest
- −$8,402
- − Property taxes
- −$908
- − Insurance
- −$750
- − Repairs & maintenance
- −$1,199
- − Management
- −$1,199
- − Depreciation
- −$4,364
- Taxable loss
- −$1,829
- Est. tax savings @ 24.0%
- +$439
- After-tax cash flow
- $1,186/yr
For passive investors: Depreciation is non-cash, so a rental often shows a tax loss while cash-flowing — sheltering income. Rental losses are passive: they offset passive income freely, and up to $25,000/yr can offset ordinary (W-2) income if you actively participate and your MAGI is under $100k (phasing out to $0 by $150k); unused losses carry forward. On sale, claimed depreciation is recaptured at up to 25%, and gains may owe capital-gains tax (a 1031 exchange can defer both). Figures are a year-1 estimate at your 24.0% rate — not tax advice; consult a CPA.
Schools (NCES district)
- District
- Griffin-Spalding County
- NCES district ID
- 1302520
- Math proficiency
- 13% ▼ -13.00%
- Reading proficiency
- 19% ▼ -12.00%
- Median HH income
- $40,895
- Composite
- 13.71/100
- National rank
- #9496
- State rank
- #151 of 174 in GA
Livability — Griffin
- Score
- 54/100
- State rank
- #529
- US rank
- #23746
Category grades
Schools grade is shown separately in the Schools card above.
Census & demographics
- Census place
- Griffin, GA
- County
- Spalding County · 66,676 people
- City population
- 28,414
- Metro
- Atlanta-Sandy Springs-Alpharetta, GA
- Population (ZIP)
- 28,414
- Household income
- $70,216
- Rent vs Own
- Severe rent burden
- 735.0
Population outlook (Spalding County) Hauer SSP2
- Today (2025)
- 63,015 people
- By 2030
- 61,689 · -2.1%
- By 2040
- 57,932 · -8.1%
- By 2050
- 53,474 · -15.1%
- By 2075
- 43,228 · -31.4%
- By 2100
- 32,290 · -48.8%
Race, ethnicity, and origin ACS 2023
- Neighborhood character
- Majority White (60%)
- Race & ethnicity
- White 60% Black 31% Two or more races 4% Hispanic / Latino 4%
- Common ancestry
- Serbian 1% Slovak 1% Portuguese 1%
- Foreign-born
- 3% · Canada
- Languages at home
- 96% English-only · Spanish 3%
Political lean MEDSL · Spalding
- 2024 margin
- R (+16.7) · D 41.4% · R 58.1%
- 2008→2024 swing
- +2.1pp toward D · 2008: -18.8pp · 2024: -16.7pp
- All cycles
- 2024: R+16.7 2020: R+20.8 2016: R+24.2 2012: R+20.0 2008: R+18.8
Not yet ingested
- Civics
- —
Market trends
- HPI YoY
- ▼ -181.83%
- Current HPI
- 232.3039
- Rent YoY
- ▲ 1.42%
- Metro
- Atlanta-Sandy Springs-Alpharetta, GA
- State GDP YoY
- ▲ 2.66%
- F500 in state
- 28
Industry mix (Fortune 500 HQ in GA)
| Industry | F500 HQs | Revenue |
|---|---|---|
| Paper / Packaging | 2 | $29B |
|
||
| Retail | 1 | $160B |
|
||
| Transportation / Logistics | 1 | $91B |
|
||
| Airlines | 1 | $62B |
|
||
| Consumer Goods | 1 | $47B |
|
||
| Utilities | 1 | $25B |
|
||
Price history
+581.8% since first listed14 events — show timeline
- 2026-05-20 Listed $150,000 GAMLS
- 2020-01-01 Listing Removed — GAMLS
- 2019-06-14 Listed $60,000 GAMLS
- 2019-06-04 Listing Removed — GAMLS
- 2019-04-07 Listed $70,000 GAMLS
- 2019-02-21 Listing Removed — GAMLS
- 2018-11-21 Listed $70,000 GAMLS
- 2018-09-17 Listing Removed — GAMLS
- 2018-02-17 Listed $62,000 GAMLS
- 2017-03-27 Sold (MLS) $14,000 CGMLS
- 2017-03-27 Sold (MLS) $14,000 GAMLS
- 2017-03-08 Pending — GAMLS
- 2017-03-05 Listed $14,000 CGMLS
- 2017-03-01 Listed $22,000 GAMLS
Property tax history
-1.5%/yrLatest (2025): $908 · +6.9% YoY. Source: county tax records.
Cash-flow waterfall
monthlySold comps — $/sqft
last 12 mo · ≤1 miLoading sold comps…