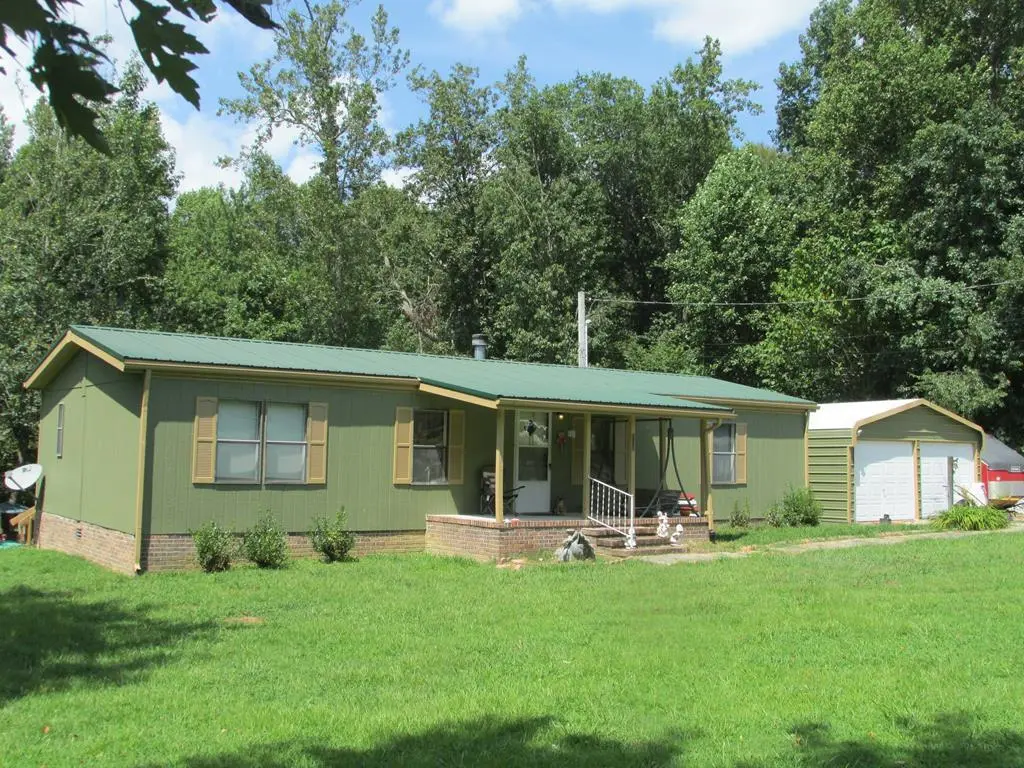
160 Thorne Ln · Algood, TN
Flood risk 1/10 · Minimal
- FEMA flood zone
- X (unshaded)
- Chance of flooding over 30 yrs
- 0.0%
- Est. flood insurance / yr
- $473 – $860
Fire risk 5/10 · Moderate
- Est. fire insurance / yr
- $949 – $1,763
Heat risk 5/10 · Moderate
- Hot days now (above 102°F)
- 7 days/yr
- Hot days in 30 yrs
- 20 days/yr
Wind risk 3/10 · Minor
- Chance of severe wind over 30 yrs
- 7.0%
Air-quality risk 2/10 · Minimal
- Unhealthy air days now
- 0 days/yr
- Unhealthy air days in 30 yrs
- 1 days/yr
Risk factors via First Street. Map © Google.
Why this score? — see what drove the D+ grade
The composite is a weighted blend of 9 inputs, each scored 0–100. Each bar is that input's sub-score; the figure is the points it added to the 100-point composite (weight × sub-score).
- Cash flow +18.6/30.0
- ARV discount +7.5/15.0
- DSCR +5.8/10.0
- 1% rule +3.7/10.0
- Livability +3.5/5.0
- Rent growth +2.5/5.0
- Condition / age +2.5/5.0
- Schools +2.3/10.0
- Appreciation +0.0/10.0
$199,900
🖨 Deal sheet (PDF) 📄 Offer letter ✓ Due diligence
Listing remarks MLS
If you are looking for a great location, look no further. This 3 bedroom 2 bath home sits on a large lot in peaceful surroundings. The property is approximately 2 miles off Hwy 111, 2 miles from the Hwy 111 Flee Market, and within 2 miles from the Rickman Fire Department and 5 miles from the Algood Fire Department. The 2 car attached garage has been wired with electricity, and has 2 new electric garage door openers and room to fit two vehicles. The home HVAC Heat Pump System was installed March 26, 2025. The home has nearly new rear wooden deck, and a wood burning fireplace that has never been used. Schedule a showing today.
Key facts
- 1 acre lot
- Garage
- Built 1996
Neighborhood map
What this means for you Summary
Snapshot
- This is a 3-bed/2.0-bath manufactured listed at $200k.
Deal economics
- At list price, monthly cash flow is $192 ($2k/yr) — positive.
- The deal already cash-flows at list — no discount required.
- To meet the 1% rule (rent ≥ 1% of price), the offer needs to be $173k (13.2% below list).
- Recommended offer: $173k (13.2% below list) — sets the bar for 1% rule.
- Cap rate 7.4% vs local median 2.8% in Algood — top-decile yield for the area; either an underpriced asset or a hidden risk that comps aren't pricing in. Stress-test before assuming the spread holds.
Location & tenants
- Location reads 70/100 on livability (#54 in TN) — a middle-class / working-renter tenant base. Strengths: cost of living A+, health & safety A+, housing A-; Watch: amenities F, commute F, employment D-.
- Overton County (rural): math 27% / reading 30% proficiency, ranked #70 of 139 in TN (top 50%) — low school quality limits family demand, transient renter base, plan for 1-2y turnover.
- Zoned schools: Rickman Elementary (math 41% / reading 37%, grade F, #253 of 952 statewide, top 27%, 709 students, 0% FRL); Livingston Middle School (math 28% / reading 25%, grade F, #135 of 333 statewide, top 43%, 276 students, 0% FRL); Livingston Academy (math 8% / reading 41%, grade F, #143 of 332 statewide, top 43%, 885 students, 0% FRL) — zoned schools average 0% FRL vs 50% district-wide (50 pts lower); this property's tenant base skews higher-income than the district average.
- Market conditions: 332 active listings in the ZIP; 17 units permitted in Overton County in 2024 (0 in 5+ unit buildings).
Forward outlook
- Local home prices are declining (-3.0%/yr); year-one equity from $1k of loan paydown is wiped out by about $6k of value loss. Plan a longer hold.
- Overton County population projected to shrink 10% by 2050 — rents likely to lag national; underwrite the cash flow, not the appreciation.
Negotiation context
- It's been on market 76 days — a 6% lower offer ($188k) is reasonable based on typical stale-listing flexibility.
- 4 sale attempts since 18y ago; this cycle's ask has dropped $20k (9%) from the opening price — seller is motivated, your offer sets the floor, not the list.
- Current owner paid $75k; list at $200k implies a 167% gain — meaningful room to come down on a strong offer.
Risks & watch-outs
- Climate carrying-cost: moderate wildfire risk; extreme-heat days projected 7→20/yr by 2055 (HVAC capex compounding) — expect insurance premiums to compound above CPI over the hold.
Questions for the listing agent
- It's been on market 76 days. Have you received any prior offers? Is the seller open to a 13% concession, seller financing, or rate buy-down credit?
- Why hasn't it sold? Are there any deal-killer items the seller is aware of (foundation, flood, title, zoning, code violations)?
- Is there a deadline driving the sale (1031 exchange, divorce, estate, relocation)? That informs how much negotiation room exists.
- Schools are F-rated, which usually means shorter tenancies and higher turnover. Who's the typical renter profile here, and what's been the actual vacancy rate?
- The area grade is low — what's the realistic commute time and amenity access for the typical tenant pool here? Any planned neighborhood developments (good or bad) we should know about?
- What's the average days-on-market for RENTAL listings here right now (not sales)? A rising rental-DOM trend means longer vacancies and softer asking-rent achievability than the comps imply.
- What's the recent tenant-quality profile in this submarket — average credit score on applications, eviction rate, late-payment / NSF rate, and stable-employment percentage? A property-management company in the area should have these aggregated.
- How much new for-sale + rental construction is in the pipeline within 1–3 miles? Heavy new supply typically softens prices + rents 12–24 months out; constrained supply supports both.
Investment metrics
- 1% rule
- 0.87% ✗
- Cap rate
- 7.45%
- Cash-on-cash
- 4.12%
- DSCR
- 1.18
- GRM
- 9.6
CMA / ARV
- ARV (median comp)
- $199,900
- List price
- $199,900
- Delta
- —
- Verdict
- FAIR
- Comps
- 1 within 2.0 mi
Show comp detail 3 sales within ~0.75 mi
| Address | Dist | Beds/Ba | Sqft | Sold | Price | $/sf | Match |
|---|---|---|---|---|---|---|---|
| 8560 Spring Creek Rd | 0.23mi | 3/2.0 | 1,216 (-13%) | 20mo | $360,000 | $296 | 52 |
| 118 Spring Creek Cir | 0.35mi | 3/2.0 | 1,216 (-13%) | 13mo | $125,000 | $103 | 52 |
| 118 Spring Creek Rd | 0.36mi | 3/2.0 | 1,216 (-13%) | 13mo | $125,000 | $103 | 51 |
Match score weights: distance 35% · size 25% · config 20% · recency 20%. Top-matched comps best support the ARV.
Projected returns pro-forma
-3.0% appreciation · 3.0% rent growth · sell at horizon
- IRR
- -9.9%
- Equity multiple
- 0.64×
- Total profit
- $-20,256
- Equity at exit
- $29,806
- IRR
- -0.6%
- Equity multiple
- 0.96×
- Total profit
- $-2,284
- Equity at exit
- $17,284
Cash invested: $55,972 (down + closing). Projections, not guarantees.
Landlord ↔ Tenant lean methodology
- Overall (STATE)
- 87 Strongly Landlord-Friendly
- State Tennessee
- 87 Strongly Landlord-Friendly · R+13
- County
- — inherits STATE
- City
- — inherits STATE
ZIP-level market 38506
- Home prices YoY
- -20.1%
- Active inventory
- 332
- Price-to-rent
- 9.6×
Monthly cashflow live
- Estimated rent
- $1,734 medium interval (Pro) →
- Mortgage (P&I)
- −$1,048
- Tax from tax record
- −$47 /mo · $559/yr
- Insurance
- −$83
- HOA
- −$0
- Vacancy / Maint / Mgmt
- −$364
- Net cashflow
- $192
Break-even live
Sensitivity live
| Price | -10% $305 | -5% $249 | +0% $192 | +5% $136 | +10% $79 |
|---|---|---|---|---|---|
| Rent | -10% $55 | -5% $124 | +0% $192 | +5% $261 | +10% $329 |
| Rate | -1.0pp $293 | -0.5pp $243 | base $192 | +0.5pp $140 | +1.0pp $88 |
UW: 25.0% down · 7.5% · 30yr · 1.5% tax · 5.0% vac · 8.0% maint · 8.0% mgmt
Financing live
Cash to close
- Down payment
- $49,975
- Closing costs
- $5,997
- Reserves months
- —
- Total cash needed
- —
Loan-product check · same deal, 3 products live
Conventional
25% down · 7.5% · 30yr
- Down + closing
- —
- Monthly P&I
- —
- Monthly cashflow
- —
- DSCR
- —
- Eligible?
- —
Personal DTI + credit; lowest rate.
DSCR
20% down · 8.5% · 30yr
- Down + closing
- —
- Monthly P&I
- —
- Monthly cashflow
- —
- DSCR
- —
- Eligible?
- —
No personal income docs; deal must DSCR.
Hard money
10% down · 12.0% · 12mo
- Down + closing
- —
- Monthly P&I
- —
- Monthly cashflow
- —
- DSCR
- —
- Eligible?
- —
Short-term bridge; refi at stabilization.
Listing history 28 events
-
2026-06-21days on market $199,900 Active 76 DOM
-
2026-06-19days on market $199,900 Active 74 DOM
-
2026-06-18days on market $199,900 Active 73 DOM
-
2026-06-17days on market $199,900 Active 72 DOM
-
2026-06-16days on market $199,900 Active 71 DOM
-
2026-06-15days on market $199,900 Active 70 DOM
-
2026-06-14days on market $199,900 Active 68 DOM
-
2026-06-13days on market $199,900 Active 67 DOM
-
2026-06-10days on market $199,900 Active 65 DOM
-
2026-06-09days on market $199,900 Active 64 DOM
-
2026-06-08days on market $199,900 Active 63 DOM
-
2026-06-07days on market $199,900 Active 62 DOM
-
2026-06-02days on market $199,900 Active 57 DOM
-
2026-06-01pricedays on market $199,900 Active 56 DOM
-
2026-05-31days on market $214,500 Active 55 DOM
-
2026-05-30days on market $214,500 Active 54 DOM
-
2026-05-05price $214,500 632-char remark
Show marketing remark (632 chars)
If you are looking for a great location, look no further. This 3 bedroom 2 bath home sits on a large lot in peaceful surroundings. The property is approximately 2 miles off Hwy 111, 2 miles from the Hwy 111 Flee Market, and within 2 miles from the Rickman Fire Department and 5 miles from the Algood Fire Department. The 2 car attached garage has been wired with electricity, and has 2 new electric garage door openers and room to fit two vehicles. The home HVAC Heat Pump System was installed March 26, 2025. The home has nearly new rear wooden deck, and a wood burning fireplace that has never been used. Schedule a showing today.
-
2026-04-06$219,500 Active 632-char remark
Show marketing remark (632 chars)
If you are looking for a great location, look no further. This 3 bedroom 2 bath home sits on a large lot in peaceful surroundings. The property is approximately 2 miles off Hwy 111, 2 miles from the Hwy 111 Flee Market, and within 2 miles from the Rickman Fire Department and 5 miles from the Algood Fire Department. The 2 car attached garage has been wired with electricity, and has 2 new electric garage door openers and room to fit two vehicles. The home HVAC Heat Pump System was installed March 26, 2025. The home has nearly new rear wooden deck, and a wood burning fireplace that has never been used. Schedule a showing today.
-
2022-09-22soldstatus $75,000
-
2021-04-23soldstatus $420,000 495-char remark
Show marketing remark (495 chars)
AMAZING PROPERTY: 160 SURVEYED ACRES WITH MARKETABLE TIMBER (not timbered in 50 years); several building sites plus all utilities available at the street. Take a drive down Thorn Gap and enjoy the countryside. .. beautiful farmland and the area boasts great neighbors and gorgeous scenery. Property shows creek on plat at back of property. Call and schedule a tour of this nature paradise. .. wildlife galore! A 2012-2021 Forest Stewardship Plan and 1994 Forest Plan is available upon request.
-
2020-09-21$450,000 495-char remark
Show marketing remark (495 chars)
AMAZING PROPERTY: 160 SURVEYED ACRES WITH MARKETABLE TIMBER (not timbered in 50 years); several building sites plus all utilities available at the street. Take a drive down Thorn Gap and enjoy the countryside. .. beautiful farmland and the area boasts great neighbors and gorgeous scenery. Property shows creek on plat at back of property. Call and schedule a tour of this nature paradise. .. wildlife galore! A 2012-2021 Forest Stewardship Plan and 1994 Forest Plan is available upon request.
-
2019-11-04soldstatus $84,900
-
2019-10-28soldstatus $84,900
-
2019-09-05$84,900
-
2008-10-01soldstatus $72,900
-
2008-09-29soldstatus $72,900
-
2008-08-25$72,900
-
2004-05-06soldstatus $50,000
ⓘ Source: listings_history table (triggers on properties + properties_extension) + one-shot
backfill from property_details.listing_events for pre-trigger history.
Tax reassessment forecast TN · Resets to sale price
- Current annual tax
- $559 · $47/mo
- Projected year-2 tax
- $1,419 · $118/mo
- Expected delta
- +$861/yr (+$72/mo · 154.1%)
ⓘ Screening estimate from a state-policy table — verify with the county assessor before closing.
Climate risk First Street
- Flood 1/10 Low FEMA zone X (unshaded) · 0% chance over 30 yrs
- Wildfire 5/10 Major
- Heat 5/10 Major 7 d/yr ≥102°F today · 20 d/yr by 30 yrs out
- Wind 3/10 Moderate 7% chance of damaging wind over 30 yrs
- Air quality 2/10 Low 0 unhealthy d/yr today · 1 by 30 yrs out
Nearby sold comps map
Loading sold comps map…
Walkable amenities ~0.75 mi
Loading nearby amenities…
Taxation est. · year 1
- Rental income
- $20,814
- − Mortgage interest
- −$11,198
- − Property taxes
- −$559
- − Insurance
- −$1,000
- − Repairs & maintenance
- −$1,665
- − Management
- −$1,665
- − Depreciation
- −$5,815
- Taxable loss
- −$1,087
- Est. tax savings @ 24.0%
- +$261
- After-tax cash flow
- $2,566/yr
For passive investors: Depreciation is non-cash, so a rental often shows a tax loss while cash-flowing — sheltering income. Rental losses are passive: they offset passive income freely, and up to $25,000/yr can offset ordinary (W-2) income if you actively participate and your MAGI is under $100k (phasing out to $0 by $150k); unused losses carry forward. On sale, claimed depreciation is recaptured at up to 25%, and gains may owe capital-gains tax (a 1031 exchange can defer both). Figures are a year-1 estimate at your 24.0% rate — not tax advice; consult a CPA.
Schools (NCES district)
- District
- Overton County
- NCES district ID
- 4703330
- Math proficiency
- 27% ▼ -12.00%
- Reading proficiency
- 30% ▼ -2.00%
- Median HH income
- $34,479
- Composite
- 23.47/100
- National rank
- #7879
- State rank
- #70 of 139 in TN
Livability — Algood
- Score
- 70/100
- State rank
- #54
- US rank
- #7660
Category grades
Schools grade is shown separately in the Schools card above.
Census & demographics
- County
- Putnam County · 72,571 people
- Metro
- Cookeville, TN
- Population (ZIP)
- 30,100
- Household income
- $70,279
- Rent vs Own
- Severe rent burden
- 415.0
Population outlook (Overton County) Hauer SSP2
- Today (2025)
- 21,942 people
- By 2030
- 21,633 · -1.4%
- By 2040
- 20,812 · -5.1%
- By 2050
- 19,770 · -9.9%
- By 2075
- 17,125 · -22.0%
- By 2100
- 13,695 · -37.6%
Race, ethnicity, and origin ACS 2023
- Neighborhood character
- Predominantly White (92%)
- Race & ethnicity
- White 92% Hispanic / Latino 5% Two or more races 4%
- Hispanic origin (detail)
- Mexican 1%
- Common ancestry
- Lithuanian 3% Slovak 3% Serbian 2%
- Foreign-born
- 4% · Canada
- Languages at home
- 96% English-only · Spanish 2%
Political lean MEDSL · Overton
- 2024 margin
- Solid R (+64.2) · D 17.4% · R 81.7%
- 2008→2024 swing
- -50.9pp toward R · 2008: -13.3pp · 2024: -64.2pp
- All cycles
- 2024: R+64.2 2020: R+58.6 2016: R+50.2 2012: R+25.7 2008: R+13.3
Not yet ingested
- Civics
- —
Market trends
- HPI YoY
- ▼ -72.51%
- Current HPI
- 288.5877
- Rent YoY
- —
- Metro
- Cookeville, TN
- State GDP YoY
- ▲ 2.78%
- F500 in state
- 22
Industry mix (Fortune 500 HQ in TN)
| Industry | F500 HQs | Revenue |
|---|---|---|
| Healthcare | 3 | $91B |
|
||
| Retail | 3 | $72B |
|
||
| Transportation / Logistics | 1 | $88B |
|
||
| Paper / Packaging | 1 | $19B |
|
||
| Insurance | 1 | $13B |
|
||
| Energy | 1 | $12B |
|
||
Price history
+329.0% since first listed12 events — show timeline
- 2026-05-05 Price Changed $214,500 UCMLS
- 2026-04-06 Listed $219,500 UCMLS
- 2022-09-22 Sold (Public Records) $75,000 Public Records
- 2021-04-23 Sold (MLS) $420,000 UCMLS
- 2020-09-21 Listed $450,000 UCMLS
- 2019-11-04 Sold (Public Records) $84,900 Public Records
- 2019-10-28 Sold (MLS) $84,900 UCMLS
- 2019-09-05 Listed $84,900 UCMLS
- 2008-10-01 Sold (Public Records) $72,900 Public Records
- 2008-09-29 Sold (MLS) $72,900 UCMLS
- 2008-08-25 Listed $72,900 UCMLS
- 2004-05-06 Sold (Public Records) $50,000 Public Records
Property tax history
+9.1%/yrLatest (2025): $559 · +26.8% YoY. Source: county tax records.
Cash-flow waterfall
monthlySold comps — $/sqft
last 12 mo · ≤1 miLoading sold comps…