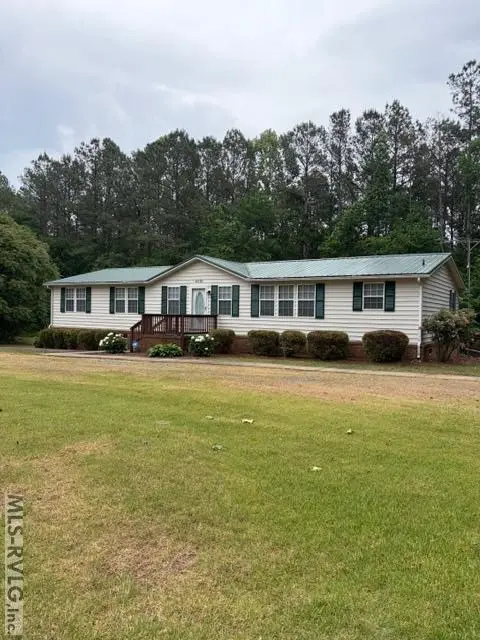
4190 Old Indian Rd · Brodnax, VA
Flood risk 1/10 · Minimal
- FEMA flood zone
- X (unshaded)
- Chance of flooding over 30 yrs
- 0.0%
- Est. flood insurance / yr
- $507 – $1,088
Fire risk 4/10 · Minor
- Est. fire insurance / yr
- $666 – $1,236
Heat risk 6/10 · Moderate
- Hot days now (above 105°F)
- 7 days/yr
- Hot days in 30 yrs
- 16 days/yr
Wind risk 6/10 · Moderate
- Chance of severe wind over 30 yrs
- 27.0%
Air-quality risk 1/10 · Minimal
- Unhealthy air days now
- 0 days/yr
- Unhealthy air days in 30 yrs
- 0 days/yr
Risk factors via First Street. Map © Google.
Why this score? — see what drove the F grade
The composite is a weighted blend of 9 inputs, each scored 0–100. Each bar is that input's sub-score; the figure is the points it added to the 100-point composite (weight × sub-score).
- ARV discount +7.5/15.0
- Appreciation +6.5/10.0
- Cash flow +6.2/30.0
- Livability +3.1/5.0
- Schools +2.9/10.0
- Rent growth +2.5/5.0
- Condition / age +2.5/5.0
- 1% rule +1.5/10.0
- DSCR +0.5/10.0
$269,000
🖨 Deal sheet (PDF) 📄 Offer letter ✓ Due diligence
Listing remarks
Relax, unwind, and spread out!!! This property offers appx. 2156 Sq. Ft. of pure country living on a large lot (. 75 Acre). From the front porch, enter a spacious combination room consisting of family room with wood burning fireplace and dining area with ample room for gatherings or game night. Kitchen/breakfast nook on back of home has lots of windows, cabinets, and counter space and makes a great entertaining space. Split floor plan with two bedrooms and a full hall bathroom on one side and primary suite on the other end. Primary suite offers sitting/office area, his and hers bathrooms (yes two bathrooms) and a walk thru closet between. French doors opening onto rear deck. Storage under d
Key facts
- Breakfast nook
- Split floor plan
- Primary suite
Tags
Property features AI
Exterior
- Parking: No garage
- Utilities: Private well water; Septic tank sewer
- Home design: Residential property (Residential/Vacation); Double wide mobile home; One story
- Construction: Vinyl siding; Metal roof
- Exterior features: Rear porch; Deck; Storage structure; Has a view; Paved road access
Interior
- Kitchen: Electric oven; Electric range; Refrigerator; Dishwasher
- Bedrooms: Total rooms: 6
- Flooring: Carpet; Vinyl; Laminate
- Bathrooms: 3 full bathrooms
- Heating & cooling: Heat pump heating; Central air conditioning
- Interior features: Walk-in closets; Insulated windows; Wood-burning fireplace in family room
Neighborhood map
What this means for you Summary
Snapshot
- This is a 3-bed/3.0-bath single-family listed at $269k.
Deal economics
- At list price, monthly cash flow is $-488 ($-6k/yr) — negative.
- To cash-flow at today's rent, offer at most $198k (26.2% below list).
- To meet the 1% rule (rent ≥ 1% of price), the offer needs to be $174k (35.5% below list).
- Recommended offer: $174k (35.5% below list) — sets the bar for 1% rule.
Location & tenants
- Location reads 62/100 on livability (#403 in VA) — a middle-class / working-renter tenant base. Strengths: cost of living A+, housing A+, employment B; Watch: amenities F, commute F, health & safety D-.
- Brunswick County Public School District (rural): math 24% / reading 47% proficiency, ranked #130 of 131 in VA (top 99%) — families likely to look elsewhere, expect single-tenant / working-renter base with shorter leases; 73% free/reduced lunch — lower-income household profile, screen leases tightly.
- Zoned schools: James S. Russell Middle (math 16% / reading 38%, grade F, #335 of 342 statewide, top 98%, 312 students, 99% FRL); Brunswick High (math 22% / reading 67%, grade F, #310 of 319 statewide, top 98%, 426 students, 99% FRL) — zoned schools average 99% FRL vs 73% district-wide (26 pts higher); higher-poverty schools than district average — tighter screening recommended.
- Market conditions: 26 active listings in the ZIP; 37 units permitted in Brunswick County in 2024 (0 in 5+ unit buildings).
Forward outlook
- In year one you build about $10k of equity ($2k loan paydown + $8k appreciation (3.0% local appreciation)).
- Brunswick County population projected at -30% by 2050 — secular population decline; favor cash flow + early exit over multi-decade hold.
- By year 4, paydown + projected appreciation supports a ~$34k cash-out refi (75% LTV) — recoverable capital for the next deal without selling this one.
Negotiation context
- It's been on market 45 days — a 3% lower offer ($261k) is reasonable based on typical stale-listing flexibility.
Risks & watch-outs
- Climate carrying-cost: major wind risk, 27% chance of damaging wind over 30y; extreme-heat days projected 7→16/yr by 2055 (HVAC capex compounding) — expect insurance premiums to compound above CPI over the hold.
Questions for the listing agent
- What do current leases actually rent for vs. the listed asking? Can we see a recent rent roll and the last 12 months of T-12 income?
- It's been on market 45 days. Have you received any prior offers? Is the seller open to a 35% concession, seller financing, or rate buy-down credit?
- Is there a deadline driving the sale (1031 exchange, divorce, estate, relocation)? That informs how much negotiation room exists.
- Schools are F-rated, which usually means shorter tenancies and higher turnover. Who's the typical renter profile here, and what's been the actual vacancy rate?
- The area grade is low — what's the realistic commute time and amenity access for the typical tenant pool here? Any planned neighborhood developments (good or bad) we should know about?
- What's the average days-on-market for RENTAL listings here right now (not sales)? A rising rental-DOM trend means longer vacancies and softer asking-rent achievability than the comps imply.
- What's the recent tenant-quality profile in this submarket — average credit score on applications, eviction rate, late-payment / NSF rate, and stable-employment percentage? A property-management company in the area should have these aggregated.
- How much new for-sale + rental construction is in the pipeline within 1–3 miles? Heavy new supply typically softens prices + rents 12–24 months out; constrained supply supports both.
Investment metrics
- 1% rule
- 0.65% ✗
- Cap rate
- 4.12%
- Cash-on-cash
- -7.77%
- DSCR
- 0.65
- GRM
- 12.9
CMA / ARV
- ARV (median comp)
- $786,621
- List price
- $269,000
- Delta
- -65.80%
- Verdict
- UNDERPRICED
- Comps
- 1 within 2.0 mi
Projected returns pro-forma
3.03% appreciation · 3.0% rent growth · sell at horizon
- IRR
- 0.4%
- Equity multiple
- 1.02×
- Total profit
- $1,829
- Equity at exit
- $121,443
- IRR
- 4.3%
- Equity multiple
- 1.66×
- Total profit
- $49,551
- Equity at exit
- $187,540
Cash invested: $75,320 (down + closing). Projections, not guarantees.
Landlord ↔ Tenant lean methodology
- Overall (STATE)
- 55 Moderately Landlord-Leaning
- State Virginia
- 55 Moderately Landlord-Leaning · D+2
- County
- — inherits STATE
- City
- — inherits STATE
ZIP-level market 23920
- Home prices YoY
- 3.3%
- Active inventory
- 26
- Price-to-rent
- 12.9×
Monthly cashflow live
- Estimated rent
- $1,736 medium interval (Pro) →
- Mortgage (P&I)
- −$1,411
- Tax est. 1.5%
- −$336 /mo · $4,035/yr
- Insurance
- −$112
- HOA
- −$0
- Vacancy / Maint / Mgmt
- −$365
- Net cashflow
- $-488
Break-even live
Sensitivity live
| Price | -10% $-302 | -5% $-395 | +0% $-488 | +5% $-581 | +10% $-674 |
|---|---|---|---|---|---|
| Rent | -10% $-625 | -5% $-556 | +0% $-488 | +5% $-419 | +10% $-351 |
| Rate | -1.0pp $-352 | -0.5pp $-419 | base $-488 | +0.5pp $-557 | +1.0pp $-628 |
UW: 25.0% down · 7.5% · 30yr · 1.5% tax · 5.0% vac · 8.0% maint · 8.0% mgmt
Financing live
Cash to close
- Down payment
- $67,250
- Closing costs
- $8,070
- Reserves months
- —
- Total cash needed
- —
Loan-product check · same deal, 3 products live
Conventional
25% down · 7.5% · 30yr
- Down + closing
- —
- Monthly P&I
- —
- Monthly cashflow
- —
- DSCR
- —
- Eligible?
- —
Personal DTI + credit; lowest rate.
DSCR
20% down · 8.5% · 30yr
- Down + closing
- —
- Monthly P&I
- —
- Monthly cashflow
- —
- DSCR
- —
- Eligible?
- —
No personal income docs; deal must DSCR.
Hard money
10% down · 12.0% · 12mo
- Down + closing
- —
- Monthly P&I
- —
- Monthly cashflow
- —
- DSCR
- —
- Eligible?
- —
Short-term bridge; refi at stabilization.
Listing history 18 events
-
2026-06-21days on market $269,000 Active 45 DOM
-
2026-06-21days on market $269,000 Active 44 DOM
-
2026-06-18days on market $269,000 Active 42 DOM
-
2026-06-17days on market $269,000 Active 41 DOM
-
2026-06-16days on market $269,000 Active 40 DOM
-
2026-06-15days on market $269,000 Active 39 DOM
-
2026-06-15days on market $269,000 Active 38 DOM
-
2026-06-13days on market $269,000 Active 37 DOM
-
2026-06-12days on market $269,000 Active 36 DOM
-
2026-06-09days on market $269,000 Active 33 DOM
-
2026-06-08days on market $269,000 Active 32 DOM
-
2026-06-08days on market $269,000 Active 31 DOM
-
2026-06-07days on market $269,000 Active 30 DOM
-
2026-06-03days on market $269,000 Active 27 DOM
-
2026-06-02days on market $269,000 Active 26 DOM
-
2026-06-01days on market $269,000 Active 25 DOM
-
2026-05-31days on market $269,000 Active 24 DOM
-
2026-05-07$269,000 Active 761-char remark
ⓘ Source: listings_history table (triggers on properties + properties_extension) + one-shot
backfill from property_details.listing_events for pre-trigger history.
Climate risk First Street
- Flood 1/10 Low FEMA zone X (unshaded) · 0% chance over 30 yrs
- Wildfire 4/10 Moderate
- Heat 6/10 Major 7 d/yr ≥105°F today · 16 d/yr by 30 yrs out
- Wind 6/10 Major 27% chance of damaging wind over 30 yrs
- Air quality 1/10 Low 0 unhealthy d/yr today · 0 by 30 yrs out
Nearby sold comps map
Loading sold comps map…
Walkable amenities ~0.75 mi
Loading nearby amenities…
Taxation est. · year 1
- Rental income
- $20,830
- − Mortgage interest
- −$15,068
- − Property taxes
- −$4,035
- − Insurance
- −$1,345
- − Repairs & maintenance
- −$1,666
- − Management
- −$1,666
- − Depreciation
- −$7,825
- Taxable loss
- −$10,777
- Est. tax savings @ 24.0%
- +$2,586
- After-tax cash flow
- $-3,266/yr
For passive investors: Depreciation is non-cash, so a rental often shows a tax loss while cash-flowing — sheltering income. Rental losses are passive: they offset passive income freely, and up to $25,000/yr can offset ordinary (W-2) income if you actively participate and your MAGI is under $100k (phasing out to $0 by $150k); unused losses carry forward. On sale, claimed depreciation is recaptured at up to 25%, and gains may owe capital-gains tax (a 1031 exchange can defer both). Figures are a year-1 estimate at your 24.0% rate — not tax advice; consult a CPA.
Schools (NCES district)
- District
- Brunswick County Public School District
- NCES district ID
- 5100480
- Math proficiency
- 24% ▼ -44.00%
- Reading proficiency
- 47% ▼ -15.00%
- Median HH income
- $37,085
- Composite
- 29.44/100
- National rank
- #6520
- State rank
- #130 of 131 in VA
Livability — Brodnax
- Score
- 62/100
- State rank
- #403
- US rank
- #16750
Category grades
Schools grade is shown separately in the Schools card above.
Census & demographics
- Population (ZIP)
- 3,080
Population outlook (Brunswick County) Hauer SSP2
- Today (2025)
- 14,860 people
- By 2030
- 13,946 · -6.2%
- By 2040
- 12,029 · -19.1%
- By 2050
- 10,370 · -30.2%
- By 2075
- 7,708 · -48.1%
- By 2100
- 5,718 · -61.5%
Race, ethnicity, and origin ACS 2023
- Neighborhood character
- Majority White (62%)
- Race & ethnicity
- White 62% Black 33% Hispanic / Latino 3% Two or more races 2% Asian 1%
- Common ancestry
- Iranian 1%
- Foreign-born
- 3% · Canada, South Korea
- Languages at home
- 96% English-only · Spanish 2% Korean 1% German/W. Germanic 1%
Political lean MEDSL · Brunswick
- 2024 margin
- Lean D (+8.5) · D 54.1% · R 45.5%
- 2008→2024 swing
- -17.9pp toward R · 2008: 26.5pp · 2024: 8.5pp
- All cycles
- 2024: D+8.5 2020: D+15.0 2016: D+18.7 2012: D+25.3 2008: D+26.5
Not yet ingested
- Civics
- —
Market trends
- HPI YoY
- ▲ 3.03%
- Current HPI
- 93.8737
- Rent YoY
- —
- Metro
- —
- State GDP YoY
- ▲ 2.40%
- F500 in state
- 50
Industry mix (Fortune 500 HQ in VA)
| Industry | F500 HQs | Revenue |
|---|---|---|
| Aerospace / Defense | 4 | $236B |
|
||
| Technology / Defense | 3 | $32B |
|
||
| Financial Services | 2 | $176B |
|
||
| Utilities | 2 | $27B |
|
||
| Insurance | 2 | $25B |
|
||
| Technology | 2 | $15B |
|
||
Price history
1 event — show timeline
- 2026-05-07 Listed $269,000 RVLG
Property tax history
+3.7%/yrLatest (2025): $516 · +0.0% YoY. Source: county tax records.
Cash-flow waterfall
monthlySold comps — $/sqft
last 12 mo · ≤1 miLoading sold comps…