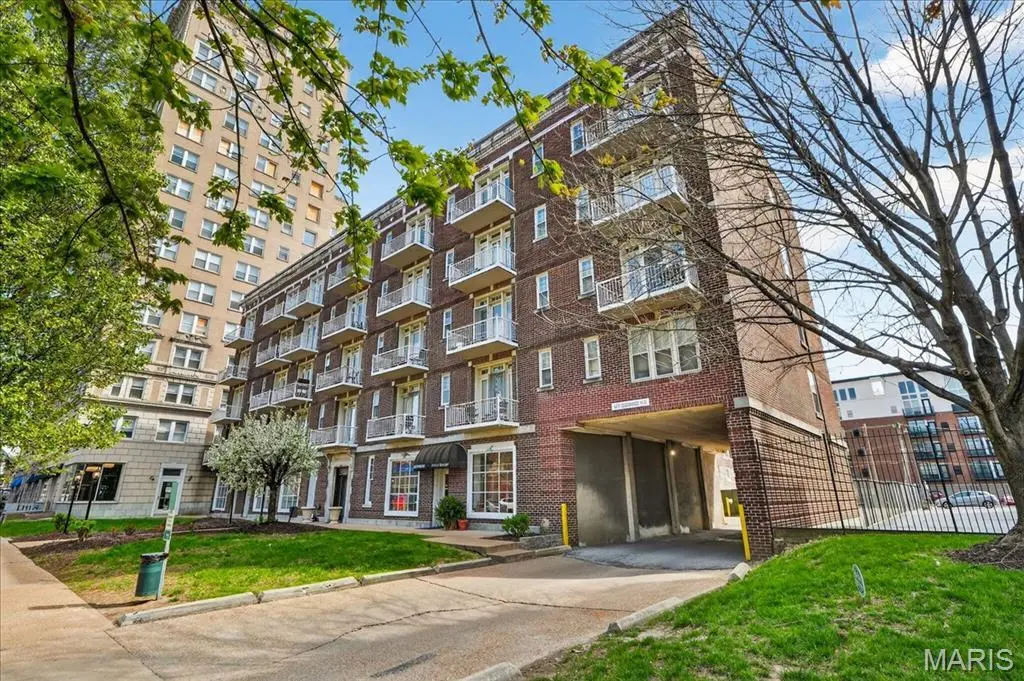
5316 Pershing Ave #507 · St. Louis, MO
Flood risk 6/10 · Moderate
- FEMA flood zone
- X (unshaded)
- Chance of flooding over 30 yrs
- 0.67%
- Est. flood insurance / yr
- $507 – $1,088
Fire risk 1/10 · Minimal
- Est. fire insurance / yr
- $1,054 – $1,958
Heat risk 5/10 · Moderate
- Hot days now (above 107°F)
- 7 days/yr
- Hot days in 30 yrs
- 21 days/yr
Wind risk 2/10 · Minimal
- Chance of severe wind over 30 yrs
- 1.0%
Air-quality risk 3/10 · Minor
- Unhealthy air days now
- 3 days/yr
- Unhealthy air days in 30 yrs
- 4 days/yr
Risk factors via First Street. Map © Google.
Why this score? — see what drove the D+ grade
The composite is a weighted blend of 9 inputs, each scored 0–100. Each bar is that input's sub-score; the figure is the points it added to the 100-point composite (weight × sub-score).
- Cash flow +18.6/30.0
- 1% rule +8.5/10.0
- ARV discount +7.5/15.0
- DSCR +5.9/10.0
- Rent growth +3.1/5.0
- Livability +2.5/5.0
- Condition / age +2.5/5.0
- Schools +1.2/10.0
- Appreciation +0.0/10.0
$119,000
🖨 Deal sheet (PDF) 📄 Offer letter ✓ Due diligence
Listing remarks MLS
Welcome to 5316 Pershing Ave—where style, comfort, and unbeatable location come together in the heart of the vibrant Skinker DeBaliviere neighborhood. This beautifully updated 2-bedroom unit features fresh paint and modern flooring throughout, creating a clean, move-in-ready space that feels both inviting and refined. The spacious primary bedroom offers a large walk-in closet—an uncommon and highly desirable feature—while the kitchen is equipped with newer appliances, making daily living both convenient and efficient. Thoughtful updates and a functional layout make this unit ideal for both owner-occupants and investors alike. Location is where this property truly shines. Just minutes from the Central West End, you’ll enjoy easy access to some of the city’s most iconic destinations including Washington University in St. Louis, Saint Louis University School of Medicine, and Barnes-Jewish Hospital. With this unit Forest Park is your backyard!
Key facts
- Easy access
- Walk-in closet
- Newer appliances
Tags
Neighborhood map
What this means for you Summary
Snapshot
- This is a 2-bed/1.0-bath condo listed at $119k.
Deal economics
- At list price, monthly cash flow is $116 ($1k/yr) — positive.
- The deal already cash-flows at list — no discount required.
- Meets the 1% rule at list price ($2k rent vs $119k).
- Recommended offer: $115k (3.0% below list) — sets the bar for market timing.
- Cap rate 7.5% vs local median 5.0% in St. Louis — top-decile yield for the area; either an underpriced asset or a hidden risk that comps aren't pricing in. Stress-test before assuming the spread holds.
Location & tenants
- Location reads: area grade D — affects rentability + tenant quality, not the cash-flow math above.
- St. Louis City (urban): math 10% / reading 18% proficiency, ranked #312 of 324 in MO (top 96%) — low school quality limits family demand, transient renter base, plan for 1-2y turnover; 80% free/reduced lunch — lower-income household profile, screen leases tightly.
- Zoned schools: Nahed Chapman New American Aca (math 2% / reading 2%, grade F, #1,099 of 1,115 statewide, top 100%, 335 students, 99% FRL); Gateway Middle (math 0% / reading 8%, grade F, #389 of 391 statewide, top 100%, 506 students, 99% FRL); Sumner High (math 2% / reading 2%, grade F, #520 of 521 statewide, top 100%, 264 students, 99% FRL) — zoned schools average 99% FRL vs 80% district-wide (19 pts higher); higher-poverty schools than district average — tighter screening recommended.
- Market conditions: Rents rising (+2.4%/yr); 122 active listings in the ZIP; 40 comparable units currently listed for rent nearby; rentals at typical pace (median 16d on market — plan ~3-4 weeks tenant-placement turnaround); 294 units permitted in St. Louis city in 2024 (227 in 5+ unit buildings).
- This rent runs 42% of the median local income ($46k/yr) — at the standard rent-burdened threshold; future hikes will face affordability resistance.
Forward outlook
- Local home prices are declining (-3.0%/yr); year-one equity from $823 of loan paydown is wiped out by about $4k of value loss. Plan a longer hold.
- St. Louis County population projected to shrink 6% by 2050 — rents likely to lag national; underwrite the cash flow, not the appreciation.
Negotiation context
- It's been on market 56 days — a 3% lower offer ($115k) is reasonable based on typical stale-listing flexibility.
- 5 sale attempts since 8y ago with the ask held roughly flat each time — persistent listings suggest the price (not the market) is what's stuck; bring a comps-based counter.
- Current owner paid $89k; 34% above their basis — modest negotiation headroom, anchor on the comps not their cost.
Risks & watch-outs
- Watch-outs: built in 1917 — expect roof / HVAC / electrical / plumbing capex.
- Climate carrying-cost: major flood risk; extreme-heat days projected 7→21/yr by 2055 (HVAC capex compounding) — expect insurance premiums to compound above CPI over the hold.
Questions for the listing agent
- It's been on market 56 days. Have you received any prior offers? Is the seller open to a 3% concession, seller financing, or rate buy-down credit?
- Built in 1917 — when were the roof, HVAC, electrical panel, plumbing, and water heater last replaced?
- What does the HOA fee cover, when was the last increase, and are there any pending special assessments or reserve-fund shortfalls?
- Any open or pending special assessments — roof, HVAC, plumbing, elevator, façade? What's the per-unit balance and payoff schedule, and is the seller paying it off at close or rolling it to the buyer?
- Is there a deadline driving the sale (1031 exchange, divorce, estate, relocation)? That informs how much negotiation room exists.
- The area grade is low — what's the realistic commute time and amenity access for the typical tenant pool here? Any planned neighborhood developments (good or bad) we should know about?
- What's the average days-on-market for RENTAL listings here right now (not sales)? A rising rental-DOM trend means longer vacancies and softer asking-rent achievability than the comps imply.
- What's the recent tenant-quality profile in this submarket — average credit score on applications, eviction rate, late-payment / NSF rate, and stable-employment percentage? A property-management company in the area should have these aggregated.
- How much new apartment / multifamily construction is in the pipeline within 1–3 miles? Heavy new supply (>2% of stock underway) typically softens rents 12–24 months out; light construction supports rent growth.
Investment metrics
- 1% rule
- 1.35% ✓
- Cap rate
- 7.46%
- Cash-on-cash
- 4.18%
- DSCR
- 1.19
- GRM
- 6.2
CMA / ARV
No comps found within radius.
Projected returns pro-forma
-3.0% appreciation · 2.39% rent growth · sell at horizon
- IRR
- -10.5%
- Equity multiple
- 0.62×
- Total profit
- $-12,635
- Equity at exit
- $17,743
- IRR
- -2.1%
- Equity multiple
- 0.86×
- Total profit
- $-4,522
- Equity at exit
- $10,289
Cash invested: $33,320 (down + closing). Projections, not guarantees.
Landlord ↔ Tenant lean methodology
- Overall (STATE)
- 81 Strongly Landlord-Friendly
- State Missouri
- 81 Strongly Landlord-Friendly · R+10
- County
- — inherits STATE
- City
- — inherits STATE
ZIP-level market 63112
- Rents YoY
- 2.4%
- Active inventory
- 122
- Price-to-rent
- 6.2×
Monthly cashflow live
- Estimated rent
- $1,608 high interval (Pro) →
- Mortgage (P&I)
- −$624
- Tax from tax record
- −$162 /mo · $1,947/yr
- Insurance
- −$50
- HOA
- −$318
- Vacancy / Maint / Mgmt
- −$338
- Net cashflow
- $116
Break-even live
Sensitivity live
| Price | -10% $184 | -5% $150 | +0% $116 | +5% $83 | +10% $49 |
|---|---|---|---|---|---|
| Rent | -10% $-11 | -5% $53 | +0% $116 | +5% $180 | +10% $243 |
| Rate | -1.0pp $176 | -0.5pp $146 | base $116 | +0.5pp $85 | +1.0pp $54 |
UW: 25.0% down · 7.5% · 30yr · 1.5% tax · 5.0% vac · 8.0% maint · 8.0% mgmt
Financing live
Cash to close
- Down payment
- $29,750
- Closing costs
- $3,570
- Reserves months
- —
- Total cash needed
- —
Loan-product check · same deal, 3 products live
Conventional
25% down · 7.5% · 30yr
- Down + closing
- —
- Monthly P&I
- —
- Monthly cashflow
- —
- DSCR
- —
- Eligible?
- —
Personal DTI + credit; lowest rate.
DSCR
20% down · 8.5% · 30yr
- Down + closing
- —
- Monthly P&I
- —
- Monthly cashflow
- —
- DSCR
- —
- Eligible?
- —
No personal income docs; deal must DSCR.
Hard money
10% down · 12.0% · 12mo
- Down + closing
- —
- Monthly P&I
- —
- Monthly cashflow
- —
- DSCR
- —
- Eligible?
- —
Short-term bridge; refi at stabilization.
Rent comps 40 comps
| Address | Beds | Baths | Sqft | Rent | $/sqft | DOM | Units | Dist |
|---|---|---|---|---|---|---|---|---|
| 5316 Pershing Ave Saint Louis, MO | 1.0–2.0 | 1.0 | 770 | $1,500 | $1.95 | 0d | 4 | 0.02mi |
| 275 Union Blvd St. Louis, MO | 3.0 | 1.0–3.0 | 1317 | $3,426 | $2.60 | 0d | 63 | 0.02mi |
| 5330 Pershing Ave #606 Saint Louis, MO | 2.0 | 2.0 | 845 | $1,145 | $1.36 | 0d | 1 | 0.06mi |
| 5510 Pershing Ave Saint Louis, MO | 2.0 | 1.0–2.0 | 722 | $2,020 | $2.80 | 0d | 17 | 0.23mi |
| 5535 Pershing Ave Unit 11 St. Louis, MO | 1.0 | 1.0 | 800 | $1,095 | $1.37 | 16d | 1 | 0.28mi |
| 5616 Pershing Ave Apt 11 St. Louis, MO | 1.0 | 1.0 | 800 | $995 | $1.24 | 45d | 1 | 0.48mi |
| 5457 Delmar Blvd St. Louis, MO | 1.0 | 1.0 | 481 | $810 | $1.68 | 0d | 7 | 0.48mi |
| 5500 Delmar Blvd Unit 5540-Apt 202 St. Louis, MO | 2.0 | 2.0 | 875 | $1,395 | $1.59 | 9d | 1 | 0.48mi |
| 5621 Pershing Ave Saint Louis, MO | 1.0 | 1.0 | 670 | $1,200 | $1.79 | 45d | 1 | 0.49mi |
| 5630 Pershing Ave Saint Louis, MO | 1.0 | 1.0 | 800 | $1,325 | $1.66 | 4d | 1 | 0.50mi |
| 501 Clara Ave Saint Louis, MO | 2.0 | 1.0–2.0 | 1040 | $1,742 | $1.67 | 0d | 19 | 0.52mi |
| 501 Clara Ave Saint Louis, MO | 1.0–2.0 | 1.0–2.0 | 850 | $1,845 | $2.17 | 16d | 21 | 0.52mi |
| 5660 Kingsbury Ave Saint Louis, MO | 1.0–2.0 | 1.0–2.0 | 789 | $1,520 | $1.93 | 5d | 16 | 0.53mi |
| 5660 Kingsbury Ave Saint Louis, MO | 1.0–2.0 | 1.0–2.0 | 789 | $1,550 | $1.96 | 45d | 23 | 0.53mi |
| 5560 Delmar Blvd Saint Louis, MO | 1.0–2.0 | 1.0–2.0 | 752 | $1,395 | $1.85 | 18d | 1 | 0.56mi |
| 5535 Delmar Blvd St. Louis, MO | 1.0–2.0 | 1.0–2.0 | 884 | $1,970 | $2.23 | 0d | 16 | 0.57mi |
| 299 DeBaliviere Ave St. Louis, MO | 1.0 | 1.0–1.5 | 738 | $2,505 | $3.39 | 12d | 13 | 0.58mi |
| 629 Clara Ave Apt 28 St. Louis, MO | 2.0 | 1.0 | 672 | $1,150 | $1.71 | 0d | 1 | 0.60mi |
| 415 DeBaliviere Ave Unit 209 St. Louis, MO | 1.0 | 1.0 | 650 | $1,215 | $1.87 | 45d | 1 | 0.60mi |
| 415 DeBaliviere Ave Unit 203 St. Louis, MO | 1.0 | 1.0 | 650 | $1,200 | $1.85 | 45d | 1 | 0.60mi |
| 415 DeBaliviere Ave Unit 211 St. Louis, MO | 1.0 | 1.0 | 688 | $1,275 | $1.85 | 45d | 1 | 0.60mi |
| 415 DeBaliviere Ave Unit 212 St. Louis, MO | 1.0 | 1.0 | 730 | $1,350 | $1.85 | 45d | 1 | 0.60mi |
| 415 DeBaliviere Ave Unit 106 St. Louis, MO | 1.0 | 1.0 | 659 | $1,200 | $1.82 | 16d | 1 | 0.60mi |
| 415 DeBaliviere Ave Unit 208 St. Louis, MO | 2.0 | 2.0 | 955 | $1,700 | $1.78 | 18d | 1 | 0.60mi |
| 415 DeBaliviere Ave Unit 201 St. Louis, MO | 2.0 | 1.0 | 842 | $1,599 | $1.90 | 18d | 1 | 0.60mi |
| 415 DeBaliviere Ave Unit 101 St. Louis, MO | 2.0 | 2.0 | 976 | $1,750 | $1.79 | 18d | 1 | 0.60mi |
| 415 DeBaliviere Ave Unit 202 St. Louis, MO | 1.0 | 1.0 | 811 | $1,500 | $1.85 | 45d | 1 | 0.60mi |
| 299 DeBaliviere Ave Unit S522 St. Louis, MO | 1.0 | 1.0 | 634 | $1,987 | $3.13 | 45d | 1 | 0.60mi |
| 100 N Kingshighway Blvd Saint Louis, MO | 3.0 | 1.0–2.0 | 1211 | $5,531 | $4.57 | 45d | 84 | 0.63mi |
| 100 N Kingshighway Blvd Saint Louis, MO | 3.0 | 1.0–2.0 | 1171 | $5,438 | $4.64 | 0d | 79 | 0.63mi |
| 5621 Delmar Blvd Saint Louis, MO | 1.0 | 1.0 | 612 | $1,132 | $1.85 | 0d | 5 | 0.66mi |
| 40 N Kingshighway Blvd Saint Louis, MO | 3.0 | 1.0–2.0 | 872 | $2,195 | $2.52 | 45d | 54 | 0.66mi |
| 40 N Kingshighway Blvd Saint Louis, MO | 2.0 | 1.0–2.0 | 860 | $2,545 | $2.96 | 3d | 54 | 0.66mi |
| 4953 McPherson Ave Saint Louis, MO | 1.0 | 1.0 | 1048 | $1,325 | $1.26 | 45d | 1 | 0.69mi |
| 4961 McPherson Ave St. Louis, MO | 1.0 | 1.0 | 950 | $1,175 | $1.24 | 45d | 1 | 0.69mi |
| 4954 W Pine Blvd Saint Louis, MO | 2.0 | 2.0 | 950 | $1,300 | $1.37 | 25d | 1 | 0.69mi |
| 5572 Clemens Ave Unit 1W St. Louis, MO | 3.0 | 1.0 | 900 | $1,025 | $1.14 | 16d | 1 | 0.70mi |
| 4949 W Pine Blvd St. Louis, MO | 1.0–2.0 | 1.0–2.0 | 925 | $2,225 | $2.41 | 0d | 11 | 0.71mi |
| 18 S Kingshighway Blvd Saint Louis, MO | 3.0 | 1.0–2.0 | 780 | $2,113 | $2.71 | 0d | 51 | 0.71mi |
| 18 S Kingshighway Blvd Saint Louis, MO | 4.0 | 1.0–2.0 | 730 | $1,865 | $2.55 | 45d | 42 | 0.71mi |
HOA detail condo
- Monthly dues
- $318 · $3,816/yr
- Assessments
- None detected in remarks — confirm with the listing agent.
Listing history 24 events
-
2026-06-05days on market $119,000 Active 56 DOM
-
2026-06-03days on market $119,000 Active 55 DOM
-
2026-06-02days on market $119,000 Active 54 DOM
-
2026-06-01days on market $119,000 Active 53 DOM
-
2026-05-31days on market $119,000 Active 52 DOM
-
2026-05-18price $119,000 983-char remark
Show marketing remark (983 chars)
Welcome to 5316 Pershing Ave—where style, comfort, and unbeatable location come together in the heart of the vibrant Skinker DeBaliviere neighborhood. This beautifully updated 2-bedroom unit features fresh paint and modern flooring throughout, creating a clean, move-in-ready space that feels both inviting and refined. The spacious primary bedroom offers a large walk-in closet—an uncommon and highly desirable feature—while the kitchen is equipped with newer appliances, making daily living both convenient and efficient. Thoughtful updates and a functional layout make this unit ideal for both owner-occupants and investors alike. Location is where this property truly shines. Just minutes from the Central West End, you’ll enjoy easy access to some of the city’s most iconic destinations including Washington University in St. Louis, Saint Louis University School of Medicine, and Barnes-Jewish Hospital. With this unit Forest Park is your backyard!
-
2026-04-09$120,000 Active 983-char remark
Show marketing remark (983 chars)
Welcome to 5316 Pershing Ave—where style, comfort, and unbeatable location come together in the heart of the vibrant Skinker DeBaliviere neighborhood. This beautifully updated 2-bedroom unit features fresh paint and modern flooring throughout, creating a clean, move-in-ready space that feels both inviting and refined. The spacious primary bedroom offers a large walk-in closet—an uncommon and highly desirable feature—while the kitchen is equipped with newer appliances, making daily living both convenient and efficient. Thoughtful updates and a functional layout make this unit ideal for both owner-occupants and investors alike. Location is where this property truly shines. Just minutes from the Central West End, you’ll enjoy easy access to some of the city’s most iconic destinations including Washington University in St. Louis, Saint Louis University School of Medicine, and Barnes-Jewish Hospital. With this unit Forest Park is your backyard!
-
2025-07-03price $127,500
-
2025-06-12$129,900 Active
-
2025-04-21price $179,500
-
2025-03-22$185,500 Active
-
2025-03-22historical
-
2025-01-17soldstatus
-
2024-12-26status Pending
-
2024-12-20soldstatus Closed
-
2024-10-07historical Active Under Contract
-
2024-08-22$115,000 Active
-
2024-08-21historical $115,000
-
2019-05-21soldstatus $89,000
-
2019-05-15soldstatus Closed
-
2019-04-25status Pending
-
2019-04-10historical Active Under Contract
-
2019-02-01price $95,900
-
2018-11-15$99,900 Active
ⓘ Source: listings_history table (triggers on properties + properties_extension) + one-shot
backfill from property_details.listing_events for pre-trigger history.
Tax reassessment forecast MO · Resets to sale price
- Current annual tax
- $1,947 · $162/mo
- Projected year-2 tax
- $1,947 · $162/mo
- Expected delta
- $0/yr ($0/mo · 0.0%)
ⓘ Screening estimate from a state-policy table — verify with the county assessor before closing.
Climate risk First Street
- Flood 6/10 Major FEMA zone X (unshaded) · 67% chance over 30 yrs
- Wildfire 1/10 Low
- Heat 5/10 Major 7 d/yr ≥107°F today · 21 d/yr by 30 yrs out
- Wind 2/10 Low 100% chance of damaging wind over 30 yrs
- Air quality 3/10 Moderate 3 unhealthy d/yr today · 4 by 30 yrs out
Nearby sold comps map
Loading sold comps map…
Walkable amenities ~0.75 mi
Loading nearby amenities…
Taxation est. · year 1
- Rental income
- $19,293
- − Mortgage interest
- −$6,666
- − Property taxes
- −$1,947
- − Insurance
- −$595
- − Repairs & maintenance
- −$1,543
- − Management
- −$1,543
- − HOA
- −$3,816
- − Depreciation
- −$3,462
- Taxable loss
- −$280
- Est. tax savings @ 24.0%
- +$67
- After-tax cash flow
- $1,462/yr
For passive investors: Depreciation is non-cash, so a rental often shows a tax loss while cash-flowing — sheltering income. Rental losses are passive: they offset passive income freely, and up to $25,000/yr can offset ordinary (W-2) income if you actively participate and your MAGI is under $100k (phasing out to $0 by $150k); unused losses carry forward. On sale, claimed depreciation is recaptured at up to 25%, and gains may owe capital-gains tax (a 1031 exchange can defer both). Figures are a year-1 estimate at your 24.0% rate — not tax advice; consult a CPA.
Schools (NCES district)
- District
- St. Louis City
- NCES district ID
- 2929280
- Math proficiency
- 10% ▼ -6.00%
- Reading proficiency
- 18% ▼ -3.00%
- Median HH income
- $35,685
- Composite
- 11.54/100
- National rank
- #9699
- State rank
- #312 of 324 in MO
Livability — St. Louis
No livability data for this city. (Only ~50 U.S. cities are tracked.)
Census & demographics
- Census place
- St. Louis, MO
- County
- Saint Louis City · 254,015 people
- City population
- 283,259
- Metro
- St. Louis, MO-IL
- Population (ZIP)
- 17,985
- Household income
- $45,542
- Rent vs Own
- Severe rent burden
- 1457.0
Population outlook (St. Louis County) Hauer SSP2
- Today (2025)
- 315,737 people
- By 2030
- 313,865 · -0.6%
- By 2040
- 305,439 · -3.3%
- By 2050
- 296,529 · -6.1%
- By 2075
- 271,028 · -14.2%
- By 2100
- 255,359 · -19.1%
Race, ethnicity, and origin ACS 2023
- Neighborhood character
- Majority Black (63%)
- Race & ethnicity
- Black 63% White 24% Asian 6% Two or more races 5% Hispanic / Latino 4%
- Common ancestry
- Lithuanian 1% Scotch-Irish 1% Romanian 1%
- Foreign-born
- 9% · China, South Korea, Canada
- Languages at home
- 88% English-only · Spanish 3% Chinese 2% Korean 2%
Political lean MEDSL · St. Louis
- 2024 margin
- Solid D (+64.7) · D 81.4% · R 16.7% · Other 2.0%
- 2008→2024 swing
- -3.5pp toward R · 2008: 68.2pp · 2024: 64.7pp
- All cycles
- 2024: D+64.7 2020: D+66.2 2016: D+63.7 2012: D+66.6 2008: D+68.2
Not yet ingested
- Civics
- —
Market trends
- HPI YoY
- ▼ -158.94%
- Current HPI
- 115.1863
- Rent YoY
- ▲ 2.39%
- Metro
- St. Louis, MO-IL
- State GDP YoY
- ▲ 1.84%
- F500 in state
- 20
Industry mix (Fortune 500 HQ in MO)
| Industry | F500 HQs | Revenue |
|---|---|---|
| Healthcare | 1 | $163B |
|
||
| Insurance | 1 | $21B |
|
||
| Industrial Technology | 1 | $17B |
|
||
| Retail | 1 | $16B |
|
||
| Industrial Distribution | 1 | $10B |
|
||
| Utilities | 1 | $9B |
|
||
Price history
+19.1% since first listed19 events — show timeline
- 2026-05-18 Price Changed $119,000 MARIS as Distributed by MLS Grid
- 2026-04-09 Listed $120,000 MARIS as Distributed by MLS Grid
- 2025-07-03 Price Changed $127,500 MARIS as Distributed by MLS Grid
- 2025-06-12 Listed $129,900 MARIS as Distributed by MLS Grid
- 2025-04-21 Price Changed $179,500 MARIS as Distributed by MLS Grid
- 2025-03-22 Listed $185,500 MARIS as Distributed by MLS Grid
- 2025-03-22 Coming Soon — MARIS as Distributed by MLS Grid
- 2025-01-17 Sold (Public Records) — Public Records
- 2024-12-26 Pending — MARIS as Distributed by MLS Grid
- 2024-12-20 Sold (MLS) — MARIS as Distributed by MLS Grid
- 2024-10-07 Contingent — MARIS as Distributed by MLS Grid
- 2024-08-22 Listed $115,000 MARIS as Distributed by MLS Grid
- 2024-08-21 Coming Soon $115,000 MARIS as Distributed by MLS Grid
- 2019-05-21 Sold (Public Records) $89,000 Public Records
- 2019-05-15 Sold (MLS) — MARIS as Distributed by MLS Grid
- 2019-04-25 Pending — MARIS as Distributed by MLS Grid
- 2019-04-10 Contingent — MARIS as Distributed by MLS Grid
- 2019-02-01 Price Changed $95,900 MARIS as Distributed by MLS Grid
- 2018-11-15 Listed $99,900 MARIS as Distributed by MLS Grid
Property tax history
+2.4%/yrLatest (2024): $1,947 · +4.7% YoY. Source: county tax records.
Cash-flow waterfall
monthlySold comps — $/sqft
last 12 mo · ≤1 miLoading sold comps…