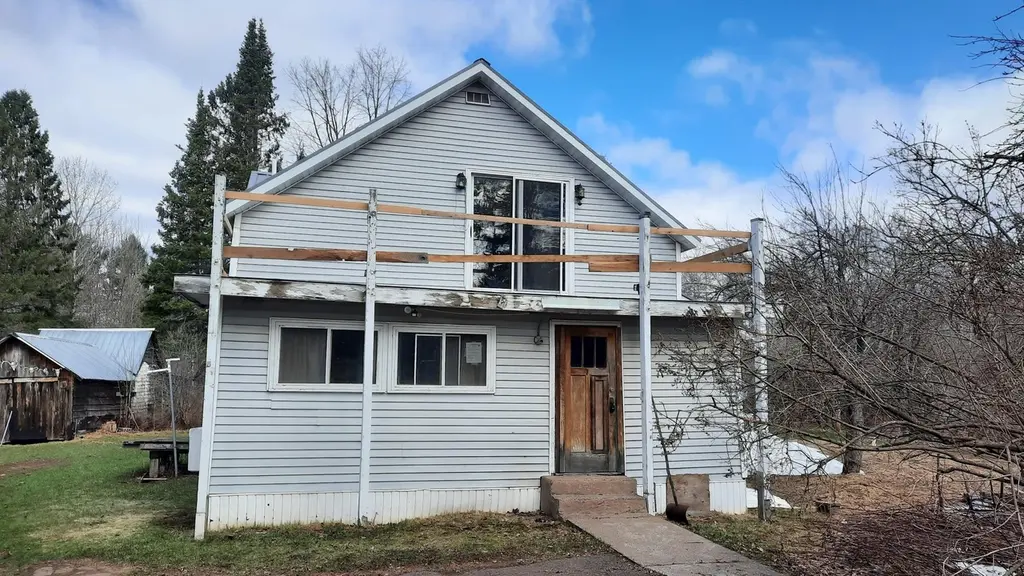
52 Wisconsin Ave · Montreal, WI
Flood risk 9/10 · Severe
- FEMA flood zone
- AE
- Chance of flooding over 30 yrs
- 0.99%
- Est. flood insurance / yr
- $2,026 – $9,024
Fire risk 2/10 · Minimal
- Est. fire insurance / yr
- $636 – $1,182
Heat risk 1/10 · Minimal
- Hot days now (above 90°F)
- 7 days/yr
- Hot days in 30 yrs
- 13 days/yr
Wind risk 1/10 · Minimal
- Chance of severe wind over 30 yrs
- —
Air-quality risk 1/10 · Minimal
- Unhealthy air days now
- 0 days/yr
- Unhealthy air days in 30 yrs
- 0 days/yr
Risk factors via First Street. Map © Google.
Why this score? — see what drove the B grade
The composite is a weighted blend of 9 inputs, each scored 0–100. Each bar is that input's sub-score; the figure is the points it added to the 100-point composite (weight × sub-score).
- Cash flow +30.0/30.0
- 1% rule +10.0/10.0
- DSCR +10.0/10.0
- ARV discount +7.5/15.0
- Appreciation +5.0/10.0
- Schools +3.6/10.0
- Livability +3.2/5.0
- Rent growth +2.5/5.0
- Condition / age +2.5/5.0
$33,000
🖨 Deal sheet (PDF) 📄 Offer letter ✓ Due diligence
Listing remarks
FHA Case #581-451153 Located on the Montreal River. Offering 2 bedrooms, a bath with laundry hook ups, multiply out builds. HUD Home. Sold “AS IS” by electronic bid only. Prop avail 06-1-26 Bids due by 06-6-26 11:59 PM Central Time then daily until sold. UI-Uninsured, Eligible for FHA 203K. For Prop conditions, Forms, Discl & Avail please visit www. HUDHomestore.com. All sizes are estimated, some information is obtained from previous MLS listings. Buyer has an obligation to verify all MLS information.
Key facts
- 1.85 acre lot
- 6 parking spots
- Built 1920
Property features AI
Exterior
- Parking: 6 parking spaces
- Utilities: Public water; Holding tank sewer; Electric with circuit breakers
- Home design: Single-family residential; One and one-half story
- Construction: Frame construction with vinyl siding; Pillar/post/pier foundation; Built with a metal roof
- Exterior features: Riverfront property on the Montreal River; Waterfront frontage (100'); Road frontage on a highway; Metal roof
Interior
- Bathrooms: 1 full bathroom
- Heating & cooling: Natural gas heating; Has heating
- Interior features: No fireplace
Neighborhood map
What this means for you Summary
Snapshot
- This is a 2-bed/1.0-bath single-family listed at $33k.
Deal economics
- At list price, monthly cash flow is $82 ($980/yr) — positive.
- The deal already cash-flows at list — no discount required.
- Meets the 1% rule at list price ($998 rent vs $33k).
Location & tenants
- Location reads 64/100 on livability (#532 in WI) — a middle-class / working-renter tenant base. Strengths: cost of living A+, housing A+; Watch: health & safety C-, schools D+, amenities F.
- Hurley School District (rural): math 41% / reading 46% proficiency, ranked #134 of 342 in WI (top 39%) — families likely to look elsewhere, expect single-tenant / working-renter base with shorter leases.
- Market conditions: 2 active listings in the ZIP; 62 units permitted in Iron County in 2024 (0 in 5+ unit buildings).
Forward outlook
- In year one you build about $1k of equity ($228 loan paydown + $990 appreciation (3.0% local appreciation)).
- Iron County population projected at -23% by 2050 — secular population decline; favor cash flow + early exit over multi-decade hold.
- At projected returns (3.0% appreciation + 3.0% rent growth), your $9k cash investment doubles in ~4 years — after that, you're playing with house money.
Negotiation context
- Only 6 days on market — expect competitive offers; lowballing is unlikely to land.
Risks & watch-outs
- Watch-outs: flood insurance adds $460/mo; built in 1920 — expect roof / HVAC / electrical / plumbing capex.
- Climate carrying-cost: in FEMA flood zone AE (mandatory federal flood insurance) — expect insurance premiums to compound above CPI over the hold.
Questions for the listing agent
- Built in 1920 — when were the roof, HVAC, electrical panel, plumbing, and water heater last replaced?
- What's the actual annual flood-insurance premium (NFIP or private), and is the property in a SFHA with mandatory coverage?
- Is there a deadline driving the sale (1031 exchange, divorce, estate, relocation)? That informs how much negotiation room exists.
- Schools are D-rated, which usually means shorter tenancies and higher turnover. Who's the typical renter profile here, and what's been the actual vacancy rate?
- What's the average days-on-market for RENTAL listings here right now (not sales)? A rising rental-DOM trend means longer vacancies and softer asking-rent achievability than the comps imply.
- What's the recent tenant-quality profile in this submarket — average credit score on applications, eviction rate, late-payment / NSF rate, and stable-employment percentage? A property-management company in the area should have these aggregated.
- How much new for-sale + rental construction is in the pipeline within 1–3 miles? Heavy new supply typically softens prices + rents 12–24 months out; constrained supply supports both.
Investment metrics
- 1% rule
- 3.03% ✓
- Cap rate
- 26.01%
- Cash-on-cash
- 70.40%
- DSCR
- 4.13
- GRM
- 2.8
CMA / ARV
- ARV (on-the-fly)
- $70,356
- Comps found
- 3
Show comp detail 3 sales within ~0.75 mi
| Address | Dist | Beds/Ba | Sqft | Sold | Price | $/sf | Match |
|---|---|---|---|---|---|---|---|
| 46 Pennsylvania Ave | 0.32mi | 3/1.0 (+1) | 1,068 (+0%) | 21mo | $70,000 | $66 | 62 |
| 46 Pennsylvania Ave | 0.31mi | 3/1.0 (+1) | 1,068 (+0%) | 21mo | $70,000 | $66 | 62 |
| 90 Wisconsin Ave | 0.50mi | 3/1.5 (+1) | 1,186 (+11%) | 6mo | $125,000 | $105 | 46 |
Match score weights: distance 35% · size 25% · config 20% · recency 20%. Top-matched comps best support the ARV.
Projected returns pro-forma
3.0% appreciation · 3.0% rent growth · sell at horizon
- IRR
- 17.9%
- Equity multiple
- 2.03×
- Total profit
- $9,487
- Equity at exit
- $14,838
- IRR
- 19.7%
- Equity multiple
- 3.91×
- Total profit
- $26,911
- Equity at exit
- $22,867
Cash invested: $9,240 (down + closing). Projections, not guarantees.
Landlord ↔ Tenant lean methodology
- Overall (STATE)
- 73 Landlord-Friendly
- State Wisconsin
- 73 Landlord-Friendly · R+2
- County
- — inherits STATE
- City
- — inherits STATE
ZIP-level market 54525
- Active inventory
- 2
- Price-to-rent
- 2.8×
Monthly cashflow live
- Estimated rent
- $998 medium interval (Pro) →
- Mortgage (P&I)
- −$173
- Tax from tax record
- −$60 /mo · $717/yr
- Insurance
- −$14
- Flood insurance flood zone
- −$460 /mo · $5,525/yr
- HOA
- −$0
- Vacancy / Maint / Mgmt
- −$210
- Net cashflow
- $82
Break-even live
Sensitivity live
| Price | -10% $100 | -5% $91 | +0% $82 | +5% $72 | +10% $63 |
|---|---|---|---|---|---|
| Rent | -10% $3 | -5% $42 | +0% $82 | +5% $121 | +10% $161 |
| Rate | -1.0pp $98 | -0.5pp $90 | base $82 | +0.5pp $73 | +1.0pp $64 |
UW: 25.0% down · 7.5% · 30yr · 1.5% tax · 5.0% vac · 8.0% maint · 8.0% mgmt
Financing live
Cash to close
- Down payment
- $8,250
- Closing costs
- $990
- Reserves months
- —
- Total cash needed
- —
Loan-product check · same deal, 3 products live
Conventional
25% down · 7.5% · 30yr
- Down + closing
- —
- Monthly P&I
- —
- Monthly cashflow
- —
- DSCR
- —
- Eligible?
- —
Personal DTI + credit; lowest rate.
DSCR
20% down · 8.5% · 30yr
- Down + closing
- —
- Monthly P&I
- —
- Monthly cashflow
- —
- DSCR
- —
- Eligible?
- —
No personal income docs; deal must DSCR.
Hard money
10% down · 12.0% · 12mo
- Down + closing
- —
- Monthly P&I
- —
- Monthly cashflow
- —
- DSCR
- —
- Eligible?
- —
Short-term bridge; refi at stabilization.
Listing history 5 events
-
2026-06-08statusdays on market $33,000 Pending 6 DOM
-
2026-06-08days on market $33,000 Active 5 DOM
-
2026-06-05days on market $33,000 Active 3 DOM
-
2026-06-02remarks 508-char remark
-
2026-06-02$33,000 Active 1 DOM
ⓘ Source: listings_history table (triggers on properties + properties_extension) + one-shot
backfill from property_details.listing_events for pre-trigger history.
Tax reassessment forecast WI · Partial reset (capped growth)
- Current annual tax
- $717 · $60/mo
- Projected year-2 tax
- $717 · $60/mo
- Expected delta
- $0/yr ($0/mo · 0.0%)
ⓘ Screening estimate from a state-policy table — verify with the county assessor before closing.
Climate risk First Street
- Flood 9/10 Extreme FEMA zone AE · 99% chance over 30 yrs
- Wildfire 2/10 Low
- Heat 1/10 Low 7 d/yr ≥90°F today · 13 d/yr by 30 yrs out
- Wind 1/10 Low
- Air quality 1/10 Low 0 unhealthy d/yr today · 0 by 30 yrs out
Nearby sold comps map
Loading sold comps map…
Walkable amenities ~0.75 mi
Loading nearby amenities…
Taxation est. · year 1
- Rental income
- $11,980
- − Mortgage interest
- −$1,849
- − Property taxes
- −$717
- − Insurance
- −$5,690
- − Repairs & maintenance
- −$958
- − Management
- −$958
- − Depreciation
- −$960
- Taxable income
- $847
- Est. tax owed @ 24.0%
- −$203
- After-tax cash flow
- $777/yr
For passive investors: Depreciation is non-cash, so a rental often shows a tax loss while cash-flowing — sheltering income. Rental losses are passive: they offset passive income freely, and up to $25,000/yr can offset ordinary (W-2) income if you actively participate and your MAGI is under $100k (phasing out to $0 by $150k); unused losses carry forward. On sale, claimed depreciation is recaptured at up to 25%, and gains may owe capital-gains tax (a 1031 exchange can defer both). Figures are a year-1 estimate at your 24.0% rate — not tax advice; consult a CPA.
Schools (NCES district)
- District
- Hurley School District
- NCES district ID
- 5506750
- Math proficiency
- 41% ▼ -10.00%
- Reading proficiency
- 46% ▲ 3.00%
- Median HH income
- $37,702
- Composite
- 36.21/100
- National rank
- #4729
- State rank
- #134 of 342 in WI
Livability — Montreal
- Score
- 64/100
- State rank
- #532
- US rank
- #13674
Category grades
Schools grade is shown separately in the Schools card above.
Census & demographics
- Census place
- Montreal, WI
- City population
- 311
- Population (ZIP)
- 311
Population outlook (Iron County) Hauer SSP2
- Today (2025)
- 5,630 people
- By 2030
- 5,446 · -3.3%
- By 2040
- 4,887 · -13.2%
- By 2050
- 4,345 · -22.8%
- By 2075
- 3,844 · -31.7%
- By 2100
- 3,561 · -36.7%
Race, ethnicity, and origin ACS 2023
- Neighborhood character
- Predominantly White (86%)
- Race & ethnicity
- White 86% Two or more races 6% Hispanic / Latino 5% Native American 4%
- Hispanic origin (detail)
- Mexican 4%
- Common ancestry
- Romanian 9% Iranian 3% Slovak 1%
- Foreign-born
- 2% · Canada
Political lean MEDSL · Iron
- 2024 margin
- Strong R (+26.2) · D 36.5% · R 62.7%
- 2008→2024 swing
- -39.3pp toward R · 2008: 13.1pp · 2024: -26.2pp
- All cycles
- 2024: R+26.2 2020: R+22.6 2016: R+23.5 2012: R+0.1 2008: D+13.1
Not yet ingested
- Civics
- —
Market trends
- HPI YoY
- —
- Current HPI
- —
- Rent YoY
- —
- Metro
- —
- State GDP YoY
- ▲ 2.10%
- F500 in state
- 20
Industry mix (Fortune 500 HQ in WI)
| Industry | F500 HQs | Revenue |
|---|---|---|
| Industrial Machinery | 4 | $23B |
|
||
| Industrial Technology | 2 | $36B |
|
||
| Insurance | 1 | $36B |
|
||
| Professional Services | 1 | $19B |
|
||
| Utilities | 1 | $9B |
|
||
| Consumer Goods | 1 | $3B |
|
||
Price history
1 event — show timeline
- 2026-06-01 Listed $33,000 GNMLS
Property tax history
+4.1%/yrLatest (2025): $717 · +22.5% YoY. Source: county tax records.
Cash-flow waterfall
monthlySold comps — $/sqft
last 12 mo · ≤1 miLoading sold comps…