 Fourplex
3209 Briggs Rd · Midway South, TX
Flood risk No data
- FEMA flood zone
- —
- Chance of flooding over 30 yrs
- —
- Est. flood insurance / yr
- —
Fire risk No data
- Est. fire insurance / yr
- —
Heat risk No data
- Hot days now (above threshold)
- —
- Hot days in 30 yrs
- —
Wind risk No data
- Chance of severe wind over 30 yrs
- —
Air-quality risk No data
- Unhealthy air days now
- —
- Unhealthy air days in 30 yrs
- —
Risk factors via First Street. Map © Google.
Why this score? — see what drove the C- grade
The composite is a weighted blend of 9 inputs, each scored 0–100. Each bar is that input's sub-score; the figure is the points it added to the 100-point composite (weight × sub-score).
- Cash flow +17.4/30.0
- ARV discount +7.5/15.0
- DSCR +5.4/10.0
- 1% rule +4.8/10.0
- Condition / age +4.8/5.0
- Appreciation +4.7/10.0
- Livability +2.9/5.0
- Rent growth +2.5/5.0
- Schools +2.2/10.0
$484,900
🖨 Deal sheet 📄 Offer letter ✓ Due diligence
Multi-family units
County records classify this as Multi-Family (2-4 Unit). Listing-text estimate: 4 units. confirmed
Listing remarks MLS
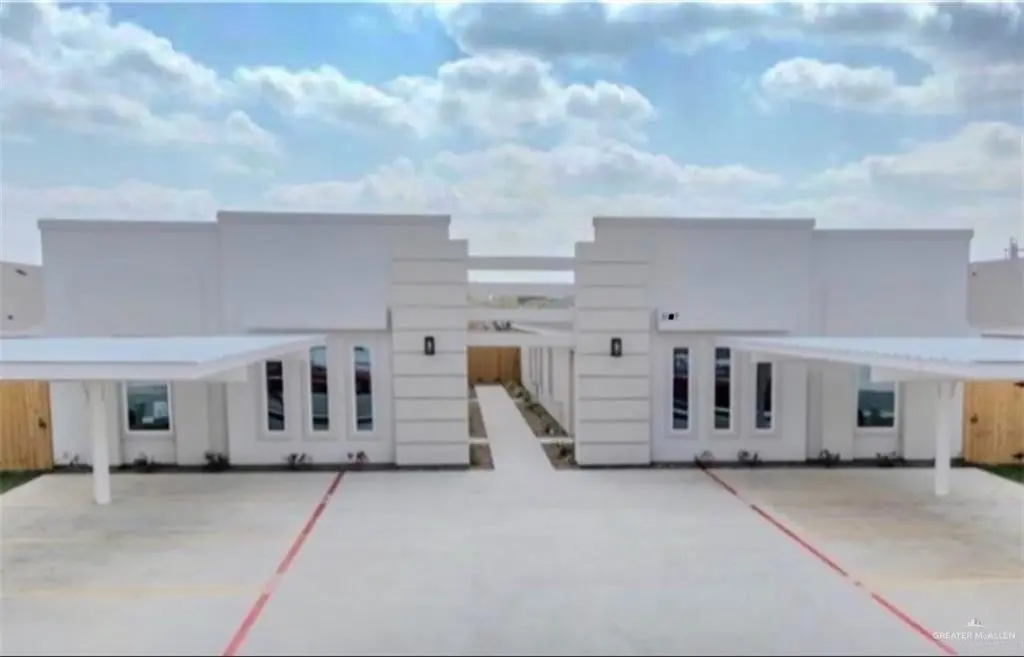
Newer Construction – Turnkey Investment Opportunity! Built in 2025, this fully occupied fourplex consists of two separate buildings, each housing two units. The property includes two spacious 3 bed / 2 bath units and two 2 bed / 2 bath units, offering a desirable mix for a stable tenant base. All units are currently leased, generating a strong total monthly income of $4,825. With modern construction, separate structures, and low-maintenance appeal, this property is ideal for investors seeking immediate cash flow and long-term value. Conveniently located near schools, shopping, and public transportation. A solid, income-producing asset in excellent condition!
Key facts
- Modern construction
- Newer construction
- 0.23 acre lot
Tags
Neighborhood map
What this means for you Summary
Snapshot
- This is a 2×3bd/2ba + 2×2bd/2ba units multifamily listed at $485k. Condition is rated excellent.
Deal economics
- At list price, monthly cash flow is $368 ($4k/yr) — positive. Per door: $92/mo.
- The deal already cash-flows at list — no discount required.
- To meet the 1% rule (rent ≥ 1% of price), the offer needs to be $473k (2.4% below list).
- Recommended offer: $473k (2.4% below list) — sets the bar for 1% rule.
Location & tenants
- Location reads 58/100 on livability (#1,201 in TX) — a working-class tenant base; expect higher turnover. Strengths: cost of living A+, housing A+, crime B+; Watch: schools F, amenities F, commute F.
- Weslaco ISD (suburban): math 23% / reading 31% proficiency, ranked #705 of 826 in TX (top 85%) — low school quality limits family demand, transient renter base, plan for 1-2y turnover.
- Market conditions: 708 active listings in the ZIP; 2 comparable units currently listed for rent nearby; 7,378 units permitted in Hidalgo County in 2024 (641 in 5+ unit buildings).
Forward outlook
- In year one you build about $519 of equity ($3k loan paydown + $-3k appreciation (-0.6% local appreciation)).
- Hidalgo County population projected at +28% by 2050 — long-run rental-demand tailwind backs the buy-and-hold thesis.
Negotiation context
- Only 7 days on market — expect competitive offers; lowballing is unlikely to land.
- 2 sale attempts with the ask held roughly flat each time — persistent listings suggest the price (not the market) is what's stuck; bring a comps-based counter.
Questions for the listing agent
- Can we see the unit-by-unit rent roll, current vacancy, and any below-market leases? What's the average tenancy length?
- What capital expenditures (roof, boiler, parking lot, exteriors) have been made in the last 5 years, and what's planned in the next 2?
- What does the HOA fee cover, when was the last increase, and are there any pending special assessments or reserve-fund shortfalls?
- Is there a deadline driving the sale (1031 exchange, divorce, estate, relocation)? That informs how much negotiation room exists.
- Schools are F-rated, which usually means shorter tenancies and higher turnover. Who's the typical renter profile here, and what's been the actual vacancy rate?
- What's the average days-on-market for RENTAL listings here right now (not sales)? A rising rental-DOM trend means longer vacancies and softer asking-rent achievability than the comps imply.
- What's the recent tenant-quality profile in this submarket — average credit score on applications, eviction rate, late-payment / NSF rate, and stable-employment percentage? A property-management company in the area should have these aggregated.
- How much new apartment / multifamily construction is in the pipeline within 1–3 miles? Heavy new supply (>2% of stock underway) typically softens rents 12–24 months out; light construction supports rent growth.
Investment metrics
- 1% rule
- 0.98% ✗
- Cap rate
- 7.20%
- Cash-on-cash
- 3.25%
- DSCR
- 1.14
- GRM
- 8.5
CMA / ARV
- ARV (median comp)
- $485,000
- List price
- $484,900
- Delta
- -0.02%
- Verdict
- FAIR
- Comps
- 17 within 1.0 mi
Show comp detail 12 sales within ~0.75 mi
| Address | Dist | Beds/Ba | Sqft | Sold | Price | $/sf | Match |
|---|---|---|---|---|---|---|---|
| 605 Sparrow Rd | 0.46mi | —/— | 4,080 (-2%) | 6mo | $485,000 | $119 | 70 |
| 604 Dominion Dr | 0.31mi | —/— | 3,802 (-9%) | 1mo | $479,000 | $126 | 70 |
| 513 Sparrow Rd | 0.49mi | —/— | 4,080 (-2%) | 5mo | $485,000 | $119 | 70 |
| 2900 Delta Rd | 0.35mi | —/— | 3,726 (-11%) | 1mo | $479,000 | $129 | 65 |
| 705 Sparrow Rd | 0.53mi | —/— | 4,080 (-2%) | 9mo | $495,000 | $121 | 64 |
| 2909 Charlie Rd | 0.41mi | —/— | 3,802 (-9%) | 3mo | $479,000 | $126 | 64 |
| 2701 Woodpecker Rd | 0.54mi | —/— | 4,080 (-2%) | 10mo | $535,000 | $131 | 63 |
| 2705 Woodpecker Rd | 0.56mi | —/— | 4,080 (-2%) | 10mo | $535,000 | $131 | 62 |
| 801 Sparrow Rd | 0.53mi | —/— | 4,080 (-2%) | 14mo | $510,000 | $125 | 59 |
| 2612 Mockingbird Rd | 0.46mi | —/— | 4,502 (+8%) | 10mo | $499,000 | $111 | 57 |
| 2508 Mockingbird Rd | 0.54mi | —/— | 4,426 (+6%) | 15mo | $545,000 | $123 | 52 |
| 2608 Mockingbird Rd | 0.54mi | —/— | 4,502 (+8%) | 19mo | $499,000 | $111 | 46 |
Match score weights: distance 35% · size 25% · config 20% · recency 20%. Top-matched comps best support the ARV.
Projected returns pro-forma
-0.58% appreciation · 3.0% rent growth · sell at horizon
- IRR
- -0.6%
- Equity multiple
- 0.97×
- Total profit
- $-3,833
- Equity at exit
- $126,801
- IRR
- 5.6%
- Equity multiple
- 1.56×
- Total profit
- $76,305
- Equity at exit
- $141,654
Cash invested: $135,772 (down + closing). Projections, not guarantees.
Landlord ↔ Tenant lean methodology
- Overall (STATE)
- 87 Strongly Landlord-Friendly
- State Texas
- 87 Strongly Landlord-Friendly · R+5
- County
- — inherits STATE
- City
- — inherits STATE
ZIP-level market 78596
- Home prices YoY
- -0.2%
- Active inventory
- 708
- Price-to-rent
- 33.9×
Monthly cashflow live
- Estimated rent
- $4,734 high interval (Pro) →
- Mortgage (P&I)
- −$2,543
- Tax est. 1.5%
- −$606 /mo · $7,274/yr
- Insurance
- −$202
- HOA
- −$21
- Vacancy / Maint / Mgmt
- −$994
- Net cashflow
- $368
Break-even live
4-unit breakdown (identical units grouped — click to expand)
| Units | Beds | Baths | Est. rent |
|---|---|---|---|
| 2× units | 3 | 2 | $2,384 |
| #1 | 3 | 2 | $1,192 |
| #2 | 3 | 2 | $1,192 |
| 2× units | 2 | 2 | $2,350 |
| #3 | 2 | 2 | $1,175 |
| #4 | 2 | 2 | $1,175 |
| Total (4 units) | $4,734 | ||
UW: 25.0% down · 7.5% · 30yr · 1.5% tax · 5.0% vac · 8.0% maint · 8.0% mgmt
Financing live
Cash to close
- Down payment
- $121,225
- Closing costs
- $14,547
- Reserves months
- —
- Total cash needed
- —
Loan-product check · same deal, 3 products live
Conventional
25% down · 7.5% · 30yr
- Down + closing
- —
- Monthly P&I
- —
- Monthly cashflow
- —
- DSCR
- —
- Eligible?
- —
Personal DTI + credit; lowest rate.
DSCR
20% down · 8.5% · 30yr
- Down + closing
- —
- Monthly P&I
- —
- Monthly cashflow
- —
- DSCR
- —
- Eligible?
- —
No personal income docs; deal must DSCR.
Hard money
10% down · 12.0% · 12mo
- Down + closing
- —
- Monthly P&I
- —
- Monthly cashflow
- —
- DSCR
- —
- Eligible?
- —
Short-term bridge; refi at stabilization.
Rent comps 2 comps
| Address | Beds | Baths | Sqft | Rent | $/sqft | DOM | Units | Dist |
|---|---|---|---|---|---|---|---|---|
| 1405 San Vicente Unit 3 Weslaco, TX | 3.0 | 2.0 | 4256 | $1,250 | $0.29 | 23d | 1 | 1.03mi |
| 1405 San Vicente Unit 1 Weslaco, TX | 3.0 | 2.0 | 4256 | $1,200 | $0.28 | 23d | 1 | 1.03mi |
HOA detail
- Monthly dues
- $21 · $252/yr
Listing history 12 events
-
2026-06-18days on market $484,900 Active 7 DOM
-
2026-06-17days on market $484,900 Active 6 DOM
-
2026-06-16days on market $484,900 Active 5 DOM
-
2026-06-15days on market $484,900 Active 4 DOM
-
2026-06-15days on market $484,900 Active 3 DOM
-
2026-06-13days on market $484,900 Active 2 DOM
-
2026-06-12days on market $484,900 Active 1 DOM
-
2026-05-31days on market $484,900 Active 110 DOM
-
2026-05-19price $484,900 672-char remark
Show marketing remark (672 chars)
Newer Construction – Turnkey Investment Opportunity! Built in 2025, this fully occupied fourplex consists of two separate buildings, each housing two units. The property includes two spacious 3 bed / 2 bath units and two 2 bed / 2 bath units, offering a desirable mix for a stable tenant base. All units are currently leased, generating a strong total monthly income of $4,825. With modern construction, separate structures, and low-maintenance appeal, this property is ideal for investors seeking immediate cash flow and long-term value. Conveniently located near schools, shopping, and public transportation. A solid, income-producing asset in excellent condition!
-
2026-05-14price $485,000 672-char remark
Show marketing remark (672 chars)
Newer Construction – Turnkey Investment Opportunity! Built in 2025, this fully occupied fourplex consists of two separate buildings, each housing two units. The property includes two spacious 3 bed / 2 bath units and two 2 bed / 2 bath units, offering a desirable mix for a stable tenant base. All units are currently leased, generating a strong total monthly income of $4,825. With modern construction, separate structures, and low-maintenance appeal, this property is ideal for investors seeking immediate cash flow and long-term value. Conveniently located near schools, shopping, and public transportation. A solid, income-producing asset in excellent condition!
-
2026-02-10$492,000 Active 672-char remark
Show marketing remark (672 chars)
Newer Construction – Turnkey Investment Opportunity! Built in 2025, this fully occupied fourplex consists of two separate buildings, each housing two units. The property includes two spacious 3 bed / 2 bath units and two 2 bed / 2 bath units, offering a desirable mix for a stable tenant base. All units are currently leased, generating a strong total monthly income of $4,825. With modern construction, separate structures, and low-maintenance appeal, this property is ideal for investors seeking immediate cash flow and long-term value. Conveniently located near schools, shopping, and public transportation. A solid, income-producing asset in excellent condition!
-
2025-09-18$492,000 Active
ⓘ Source: listings_history table (triggers on properties + properties_extension) + one-shot
backfill from property_details.listing_events for pre-trigger history.
Nearby sold comps map
Loading sold comps map…
Walkable amenities ~0.75 mi
Loading nearby amenities…
Taxation est. · year 1
- Rental income
- $56,808
- − Mortgage interest
- −$27,162
- − Property taxes
- −$7,274
- − Insurance
- −$2,424
- − Repairs & maintenance
- −$4,545
- − Management
- −$4,545
- − HOA
- −$252
- − Depreciation
- −$14,106
- Taxable loss
- −$3,499
- Est. tax savings @ 24.0%
- +$840
- After-tax cash flow
- $5,254/yr
For passive investors: Depreciation is non-cash, so a rental often shows a tax loss while cash-flowing — sheltering income. Rental losses are passive: they offset passive income freely, and up to $25,000/yr can offset ordinary (W-2) income if you actively participate and your MAGI is under $100k (phasing out to $0 by $150k); unused losses carry forward. On sale, claimed depreciation is recaptured at up to 25%, and gains may owe capital-gains tax (a 1031 exchange can defer both). Figures are a year-1 estimate at your 24.0% rate — not tax advice; consult a CPA.
Condition & rehab AI · 4 photos
This fourplex is in excellent condition with no visible repairs or maintenance needed. It offers a turnkey investment opportunity with a strong monthly income and low-maintenance appeal.
Value-add opportunities
- Both Painting exterior and interior — Enhances curb appeal and interior aesthetics
- Both Landscaping and curb appeal improvements — Improves property's visual appeal and marketability
- Both Addition of smart home features — Enhances convenience and marketability
Renovation cost estimate screening
Value-add ROI direction
- Both Painting exterior and interior — Enhances curb appeal and interior aesthetics ↑
- Both Landscaping and curb appeal improvements — Improves property's visual appeal and marketability ↑
- Both Addition of smart home features — Enhances convenience and marketability ↑
ⓘ Cost ranges are severity-bucket heuristics (US national rule-of-thumb). Get contractor quotes + a written scope before underwriting a rehab budget.
Schools (NCES district)
- District
- Weslaco ISD
- NCES district ID
- 4844960
- Math proficiency
- 23% ▼ -29.00%
- Reading proficiency
- 31% ▼ -9.00%
- Median HH income
- $32,867
- Composite
- 22.05/100
- National rank
- #8196
- State rank
- #705 of 826 in TX
Livability — Midway South
- Score
- 58/100
- State rank
- #1201
- US rank
- #21023
Category grades
Schools grade is shown separately in the Schools card above.
Census & demographics
- Census place
- Midway South, TX
- Population (ZIP)
- 38,942
Population outlook (Hidalgo County) Hauer SSP2
- Today (2025)
- 955,232 people
- By 2030
- 1,009,774 · +5.7%
- By 2040
- 1,120,332 · +17.3%
- By 2050
- 1,225,036 · +28.2%
- By 2075
- 1,439,189 · +50.7%
- By 2100
- 1,533,429 · +60.5%
Race, ethnicity, and origin ACS 2023
- Neighborhood character
- Predominantly Hispanic (86%)
- Race & ethnicity
- Hispanic / Latino 86% Two or more races 38% White 13%
- Hispanic origin (detail)
- Mexican 82%
- Common ancestry
- Slovak 1%
- Foreign-born
- 17% · Canada
- Languages at home
- 27% English-only · Spanish 72%
Political lean MEDSL · Hidalgo
- 2024 margin
- Toss-up / Even · D 48.1% · R 51.0%
- 2008→2024 swing
- -41.6pp toward R · 2008: 38.7pp · 2024: -2.9pp
- All cycles
- 2024: R+2.9 2020: D+17.1 2016: D+40.5 2012: D+41.8 2008: D+38.7
Not yet ingested
- Civics
- —
Market trends
- HPI YoY
- ▼ -0.58%
- Current HPI
- 261.5117
- Rent YoY
- —
- Metro
- —
- State GDP YoY
- ▲ 3.95%
- F500 in state
- 110
Industry mix (Fortune 500 HQ in TX)
| Industry | F500 HQs | Revenue |
|---|---|---|
| Energy | 16 | $1,198B |
|
||
| Technology | 5 | $198B |
|
||
| Engineering / Construction | 4 | $72B |
|
||
| Energy Services | 3 | $60B |
|
||
| Utilities | 3 | $41B |
|
||
| Healthcare | 2 | $330B |
|
||
Price history
-1.4% since first listed4 events — show timeline
- 2026-05-19 Price Changed $484,900 MCALLENMLS
- 2026-05-14 Price Changed $485,000 MCALLENMLS
- 2026-02-10 Listed $492,000 MCALLENMLS
- 2025-09-18 Listed $492,000 MCALLENMLS
Cash-flow waterfall
monthlySold comps — $/sqft
last 12 mo · ≤1 miLoading sold comps…