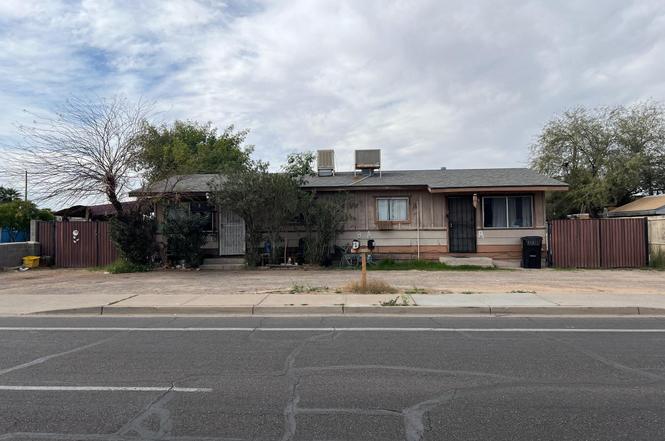
 Duplex
6410 S 7th St · Phoenix, AZ
Flood risk 1/10 · Minimal
- FEMA flood zone
- X (shaded)
- Chance of flooding over 30 yrs
- 0.0%
- Est. flood insurance / yr
- $507 – $1,088
Fire risk 1/10 · Minimal
- Est. fire insurance / yr
- $610 – $1,132
Heat risk 9/10 · Severe
- Hot days now (above 111°F)
- 7 days/yr
- Hot days in 30 yrs
- 19 days/yr
Wind risk 1/10 · Minimal
- Chance of severe wind over 30 yrs
- —
Air-quality risk 2/10 · Minimal
- Unhealthy air days now
- 2 days/yr
- Unhealthy air days in 30 yrs
- 2 days/yr
Risk factors via First Street. Map © Google.
Why this score? — see what drove the D grade
The composite is a weighted blend of 9 inputs, each scored 0–100. Each bar is that input's sub-score; the figure is the points it added to the 100-point composite (weight × sub-score).
- Cash flow +17.1/30.0
- ARV discount +7.5/15.0
- DSCR +5.3/10.0
- 1% rule +4.6/10.0
- Livability +3.8/5.0
- Condition / age +2.5/5.0
- Rent growth +1.5/5.0
- Schools +1.0/10.0
- Appreciation +0.0/10.0
$250,000
🖨 Deal sheet (PDF) 📄 Offer letter ✓ Due diligence
Multi-family units
County records classify this as Multi-Family (2-4 Unit). Listing-text estimate: 2 units. confirmed
Listing remarks MLS
Long term tenants..great investment property in south central location....
Key facts
- Laundry hookups
- 2 parking spots
- Built 1970
Tags
Property features AI
Exterior
- Parking: 2 open parking spaces (1 space per unit); 2 total parking spaces
- Utilities: SRP electric service; Public sewer; City franchise water
- Home design: Fee simple ownership; 1 building on the property
- Construction: Wood-frame construction; Painted exterior; Composition roof
- Exterior features: Asphalt road access
Interior
- Kitchen: Free-standing range; Refrigerator
- Bedrooms: 1 bedroom (unit)
- Flooring: Concrete flooring
- Bathrooms: 1 bathroom (unit)
- Heating & cooling: Electric heating; Window/wall cooling unit
- Interior features: No community pool
- Laundry & utility: Washer and dryer included
Neighborhood map
What this means for you Summary
Snapshot
- This is a 2 × 1-bed/1.0-bath units multifamily listed at $250k.
Deal economics
- At list price, monthly cash flow is $172 ($2k/yr) — positive. Per door: $86/mo.
- The deal already cash-flows at list — no discount required.
- To meet the 1% rule (rent ≥ 1% of price), the offer needs to be $240k (3.8% below list).
- Recommended offer: $240k (3.8% below list) — sets the bar for 1% rule.
- Cap rate 7.1% vs local median 3.3% in Phoenix — top-decile yield for the area; either an underpriced asset or a hidden risk that comps aren't pricing in. Stress-test before assuming the spread holds.
Location & tenants
- Location reads 75/100 on livability (#16 in AZ, #3,924 nationally) — a middle-class / working-renter tenant base. Strengths: amenities A+, commute A+, housing A+; Watch: health & safety C-, crime F.
- Roosevelt Elementary District (4279) (urban): math 8% / reading 14% proficiency, ranked #234 of 249 in AZ (top 94%) — low school quality limits family demand, transient renter base, plan for 1-2y turnover.
- Zoned schools: John F Kennedy Elementary School (math 2% / reading 12%, grade F, #1,064 of 1,109 statewide, top 97%, 360 students, 81% FRL); C O Greenfield School (math 8% / reading 14%, grade F, #183 of 218 statewide, top 85%, 481 students, 97% FRL); South Mountain High School (math 7% / reading 15%, grade F, #292 of 381 statewide, top 77%, 2,146 students, 85% FRL) — zoned schools average 87% FRL vs 36% district-wide (52 pts higher); higher-poverty schools than district average — tighter screening recommended.
- Market conditions: Rents falling (-4.0%/yr); 235 active listings in the ZIP; 23 comparable units currently listed for rent nearby; rentals leasing fast (median 1d on market — plan ~1-2 weeks tenant-placement turnaround); solid renter incomes; 36,011 units permitted in Maricopa County in 2024 (12,801 in 5+ unit buildings).
- This rent runs 33% of the median local income ($89k/yr) — at the standard rent-burdened threshold; future hikes will face affordability resistance.
Forward outlook
- Local home prices are declining (-3.0%/yr); year-one equity from $2k of loan paydown is wiped out by about $8k of value loss. Plan a longer hold.
- Maricopa County population projected at +38% by 2050 — long-run rental-demand tailwind backs the buy-and-hold thesis.
Negotiation context
- It's been on market 59 days — a 3% lower offer ($242k) is reasonable based on typical stale-listing flexibility.
- 4 sale attempts since 21y ago with the ask held roughly flat each time — persistent listings suggest the price (not the market) is what's stuck; bring a comps-based counter.
- Current owner paid $147k; list at $250k implies a 70% gain — meaningful room to come down on a strong offer.
Risks & watch-outs
- Climate carrying-cost: extreme-heat days projected 7→19/yr by 2055 (HVAC capex compounding) — expect insurance premiums to compound above CPI over the hold.
Questions for the listing agent
- It's been on market 59 days. Have you received any prior offers? Is the seller open to a 4% concession, seller financing, or rate buy-down credit?
- Can we see the unit-by-unit rent roll, current vacancy, and any below-market leases? What's the average tenancy length?
- What capital expenditures (roof, boiler, parking lot, exteriors) have been made in the last 5 years, and what's planned in the next 2?
- Built in 1970 — when were the roof, HVAC, electrical panel, plumbing, and water heater last replaced?
- Is there a deadline driving the sale (1031 exchange, divorce, estate, relocation)? That informs how much negotiation room exists.
- Crime grade is F in this area — have there been break-ins, vandalism, or insurance claims at this property in the last 3 years? What carrier currently insures it and at what premium?
- The area grade is low — what's the realistic commute time and amenity access for the typical tenant pool here? Any planned neighborhood developments (good or bad) we should know about?
- What's the average days-on-market for RENTAL listings here right now (not sales)? A rising rental-DOM trend means longer vacancies and softer asking-rent achievability than the comps imply.
- What's the recent tenant-quality profile in this submarket — average credit score on applications, eviction rate, late-payment / NSF rate, and stable-employment percentage? A property-management company in the area should have these aggregated.
- How much new apartment / multifamily construction is in the pipeline within 1–3 miles? Heavy new supply (>2% of stock underway) typically softens rents 12–24 months out; light construction supports rent growth.
Investment metrics
- 1% rule
- 0.96% ✗
- Cap rate
- 7.12%
- Cash-on-cash
- 2.95%
- DSCR
- 1.13
- GRM
- 8.7
CMA / ARV
No comps found within radius.
Projected returns pro-forma
-3.0% appreciation · 0.0% rent growth · sell at horizon
- IRR
- -15.1%
- Equity multiple
- 0.48×
- Total profit
- $-36,551
- Equity at exit
- $37,276
- IRR
- -12.6%
- Equity multiple
- 0.36×
- Total profit
- $-44,792
- Equity at exit
- $21,615
Cash invested: $70,000 (down + closing). Projections, not guarantees.
Landlord ↔ Tenant lean methodology
- Overall (STATE)
- 87 Strongly Landlord-Friendly
- State Arizona
- 87 Strongly Landlord-Friendly · R+3
- County
- — inherits STATE
- City
- — inherits STATE
ZIP-level market 85042
- Home prices YoY
- -27.7%
- Rents YoY
- -4.0%
- Active inventory
- 235
- Price-to-rent
- 17.3×
Monthly cashflow live
- Estimated rent
- $2,405 high interval (Pro) →
- Mortgage (P&I)
- −$1,311
- Tax est. 1.5%
- −$312 /mo · $3,750/yr
- Insurance
- −$104
- HOA
- −$0
- Vacancy / Maint / Mgmt
- −$505
- Net cashflow
- $172
Break-even live
Sensitivity live
| Price | -10% $345 | -5% $259 | +0% $172 | +5% $86 | +10% $-1 |
|---|---|---|---|---|---|
| Rent | -10% $-18 | -5% $77 | +0% $172 | +5% $267 | +10% $362 |
| Rate | -1.0pp $298 | -0.5pp $236 | base $172 | +0.5pp $107 | +1.0pp $42 |
2-unit breakdown (identical units grouped — click to expand)
| Units | Beds | Baths | Est. rent |
|---|---|---|---|
| 2× units | 1 | 1 | $2,404 |
| #1 | 1 | 1 | $1,202 |
| #2 | 1 | 1 | $1,202 |
| Total (2 units) | $2,405 | ||
UW: 25.0% down · 7.5% · 30yr · 1.5% tax · 5.0% vac · 8.0% maint · 8.0% mgmt
Financing live
Cash to close
- Down payment
- $62,500
- Closing costs
- $7,500
- Reserves months
- —
- Total cash needed
- —
Loan-product check · same deal, 3 products live
Conventional
25% down · 7.5% · 30yr
- Down + closing
- —
- Monthly P&I
- —
- Monthly cashflow
- —
- DSCR
- —
- Eligible?
- —
Personal DTI + credit; lowest rate.
DSCR
20% down · 8.5% · 30yr
- Down + closing
- —
- Monthly P&I
- —
- Monthly cashflow
- —
- DSCR
- —
- Eligible?
- —
No personal income docs; deal must DSCR.
Hard money
10% down · 12.0% · 12mo
- Down + closing
- —
- Monthly P&I
- —
- Monthly cashflow
- —
- DSCR
- —
- Eligible?
- —
Short-term bridge; refi at stabilization.
Rent comps 23 comps
| Address | Beds | Baths | Sqft | Rent | $/sqft | DOM | Units | Dist |
|---|---|---|---|---|---|---|---|---|
| 300 E Jessie Owens Pkwy Phoenix, AZ | 1.0–3.0 | 1.0–2.0 | 916 | $1,666 | $1.82 | 0d | 1 | 0.55mi |
| 1224 E Huntington Dr Phoenix, AZ | 4.0 | 2.0 | 1396 | $1,849 | $1.32 | 3d | 1 | 0.71mi |
| 6821 S Montezuma St Phoenix, AZ | 3.0–4.0 | 2.5 | 1286 | $2,295 | $1.78 | 0d | 11 | 0.74mi |
| 1216 E Graham Trl Phoenix, AZ | 4.0 | 2.5 | 1420 | $1,900 | $1.34 | 0d | 1 | 0.82mi |
| 1216 E Graham Trl Phoenix, AZ | 4.0 | 2.5 | 1420 | $1,900 | $1.34 | 7d | 1 | 0.82mi |
| 1417 E Irwin Ave Phoenix, AZ | 3.0 | 2.0 | 1408 | $1,980 | $1.41 | 13d | 1 | 0.91mi |
| 1417 E Irwin Ave Phoenix, AZ | 3.0 | 2.0 | 1408 | $1,985 | $1.41 | 20d | 1 | 0.91mi |
| 358 E Roeser Rd Phoenix, AZ | 3.0 | 1.0–2.0 | 698 | $1,995 | $2.86 | 0d | 5 | 0.91mi |
| 1516 E Bowker St Phoenix, AZ | 3.0 | 2.0 | 1454 | $2,145 | $1.48 | 3d | 1 | 1.15mi |
| 1516 E Bowker St Phoenix, AZ | 3.0 | 2.0 | 1454 | $2,095 | $1.44 | 0d | 1 | 1.15mi |
| 1016 W Lydia Ln Phoenix, AZ | 3.0 | 2.0 | 1263 | $1,875 | $1.48 | 13d | 1 | 1.19mi |
| 105 W Latona Rd Phoenix, AZ | 3.0 | 2.5 | 1499 | $2,350 | $1.57 | 0d | 1 | 1.22mi |
| 916 W Carter Rd Phoenix, AZ | 3.0 | 2.0 | 1350 | $2,199 | $1.63 | 16d | 1 | 1.22mi |
| 6614 S 10th Dr Phoenix, AZ | 3.0 | 2.0 | 1347 | $2,200 | $1.63 | 18d | 1 | 1.23mi |
| 6055 S 11th Ave Phoenix, AZ | 2.0–3.0 | 1.0–2.0 | 956 | $1,600 | $1.67 | 0d | 7 | 1.24mi |
| 136 W Latona Rd Phoenix, AZ | 3.0 | 2.5 | 1499 | $2,350 | $1.57 | 0d | 1 | 1.26mi |
| 8350 S Central Ave Phoenix, AZ | 2.0–4.0 | 1.5–2.5 | 1167 | $2,345 | $2.01 | 0d | 8 | 1.27mi |
| 915 W Bowker St Phoenix, AZ | 3.0 | 2.0 | 1455 | $1,850 | $1.27 | 0d | 1 | 1.27mi |
| 207 W Latona Rd Phoenix, AZ | 3.0 | 2.0 | 1319 | $2,205 | $1.67 | 3d | 1 | 1.31mi |
| 5926 S 12th Ln Phoenix, AZ | 4.0 | 2.0 | 1470 | $2,695 | $1.83 | 26d | 1 | 1.36mi |
| 5636 S 12th Ln Phoenix, AZ | 4.0 | 2.0 | 1470 | $2,695 | $1.83 | 0d | 1 | 1.41mi |
| 8017 S 6th Dr Phoenix, AZ | 3.0 | 2.0 | 1361 | $2,299 | $1.69 | 0d | 1 | 1.41mi |
| 825 E Euclid Ave Phoenix, AZ | 2.0–3.0 | 2.0–2.5 | 1278 | $2,815 | $2.20 | 0d | 35 | 1.47mi |
Listing history 13 events
-
2026-05-05status Pending
-
2026-04-28status Active
-
2026-04-17status Pending
-
2026-03-13status Active
-
2026-03-08historical Under Contract Accepting Backups
-
2026-02-23$250,000 Active
-
2020-08-31soldstatus $147,000
-
2006-03-28soldstatus $143,000
-
2006-02-13soldstatus $143,000 74-char remark
Show marketing remark (74 chars)
Long term tenants..great investment property in south central location....
-
2006-01-07historical 74-char remark
Show marketing remark (74 chars)
Long term tenants..great investment property in south central location....
-
2005-07-14$159,900 74-char remark
Show marketing remark (74 chars)
Long term tenants..great investment property in south central location....
-
2000-11-06soldstatus $65,000
-
1982-04-20soldstatus $225,000
ⓘ Source: listings_history table (triggers on properties + properties_extension) + one-shot
backfill from property_details.listing_events for pre-trigger history.
Climate risk First Street
- Flood 1/10 Low FEMA zone X (shaded) · 0% chance over 30 yrs
- Wildfire 1/10 Low
- Heat 9/10 Extreme 7 d/yr ≥111°F today · 19 d/yr by 30 yrs out
- Wind 1/10 Low
- Air quality 2/10 Low 2 unhealthy d/yr today · 2 by 30 yrs out
Nearby sold comps map
Loading sold comps map…
Walkable amenities ~0.75 mi
Loading nearby amenities…
Taxation est. · year 1
- Rental income
- $28,860
- − Mortgage interest
- −$14,004
- − Property taxes
- −$3,750
- − Insurance
- −$1,250
- − Repairs & maintenance
- −$2,309
- − Management
- −$2,309
- − Depreciation
- −$7,273
- Taxable loss
- −$2,034
- Est. tax savings @ 24.0%
- +$488
- After-tax cash flow
- $2,555/yr
For passive investors: Depreciation is non-cash, so a rental often shows a tax loss while cash-flowing — sheltering income. Rental losses are passive: they offset passive income freely, and up to $25,000/yr can offset ordinary (W-2) income if you actively participate and your MAGI is under $100k (phasing out to $0 by $150k); unused losses carry forward. On sale, claimed depreciation is recaptured at up to 25%, and gains may owe capital-gains tax (a 1031 exchange can defer both). Figures are a year-1 estimate at your 24.0% rate — not tax advice; consult a CPA.
Schools (NCES district)
- District
- Roosevelt Elementary District (4279)
- NCES district ID
- 0407080
- Math proficiency
- 8% ▼ -13.00%
- Reading proficiency
- 14% ▼ -8.00%
- Median HH income
- $42,813
- Composite
- 9.74/100
- National rank
- #9829
- State rank
- #234 of 249 in AZ
Livability — Phoenix
- Score
- 75/100
- State rank
- #16
- US rank
- #3924
Category grades
Schools grade is shown separately in the Schools card above.
Census & demographics
- Census place
- Phoenix, AZ
- County
- Maricopa County · 4,537,380 people
- City population
- 1,500,198
- Metro
- Phoenix-Mesa-Chandler, AZ
- Population (ZIP)
- 45,903
- Household income
- $88,717
- Rent vs Own
- Severe rent burden
- 1624.0
Population outlook (Maricopa County) Hauer SSP2
- Today (2025)
- 4,979,203 people
- By 2030
- 5,378,229 · +8.0%
- By 2040
- 6,156,598 · +23.6%
- By 2050
- 6,872,376 · +38.0%
- By 2075
- 8,401,270 · +68.7%
- By 2100
- 9,247,439 · +85.7%
Race, ethnicity, and origin ACS 2023
- Neighborhood character
- Diverse neighborhood (Simpson 0.66)
- Race & ethnicity
- Hispanic / Latino 50% Two or more races 29% White 25% Black 14% Asian 4% Native American 2% Pacific Islander 1%
- Hispanic origin (detail)
- Mexican 45%
- Common ancestry
- Romanian 1% Lithuanian 1% Italian 1%
- Foreign-born
- 17% · Canada, China, Vietnam
- Languages at home
- 65% English-only · Spanish 29% Other Asian/Pacific 1% Other Indo-European 1%
Political lean MEDSL · Maricopa
- 2024 margin
- Toss-up / Even · D 47.7% · R 51.2% · Other 1.1%
- 2008→2024 swing
- +7.1pp toward D · 2008: -10.6pp · 2024: -3.5pp
- All cycles
- 2024: R+3.5 2020: D+2.2 2016: R+3.5 2012: R+12.0 2008: R+10.6
Not yet ingested
- Civics
- —
Market trends
- HPI YoY
- ▼ -122.03%
- Current HPI
- 318.0601
- Rent YoY
- ▼ -4.00%
- Metro
- Phoenix-Mesa-Chandler, AZ
- State GDP YoY
- ▲ 4.54%
- F500 in state
- 20
Industry mix (Fortune 500 HQ in AZ)
| Industry | F500 HQs | Revenue |
|---|---|---|
| Technology | 2 | $13B |
|
||
| Mining / Metals | 1 | $23B |
|
||
| Environmental Services | 1 | $16B |
|
||
| Metals / Steel | 1 | $14B |
|
||
| Technology Distribution | 1 | $9B |
|
||
| Homebuilding | 1 | $8B |
|
||
Price history
+11.1% since first listed13 events — show timeline
- 2026-05-05 Pending — ARMLS
- 2026-04-28 Relisted — ARMLS
- 2026-04-17 Pending — ARMLS
- 2026-03-13 Relisted — ARMLS
- 2026-03-08 Contingent — ARMLS
- 2026-02-23 Listed $250,000 ARMLS
- 2020-08-31 Sold (Public Records) $147,000 Public Records
- 2006-03-28 Sold (Public Records) $143,000 Public Records
- 2006-02-13 Sold (MLS) $143,000 ARMLS
- 2006-01-07 Listing Removed — ARMLS
- 2005-07-14 Listed $159,900 ARMLS
- 2000-11-06 Sold (Public Records) $65,000 Public Records
- 1982-04-20 Sold (Public Records) $225,000 Public Records
Property tax history
-4.5%/yrLatest (2025): $487 · +2.7% YoY. Source: county tax records.
Cash-flow waterfall
monthlySold comps — $/sqft
last 12 mo · ≤1 miLoading sold comps…