5126 Farr · San Antonio, TX
Flood risk 1/10 · Minimal
- FEMA flood zone
- X (unshaded)
- Chance of flooding over 30 yrs
- 0.0%
- Est. flood insurance / yr
- $507 – $1,088
Fire risk 4/10 · Minor
- Est. fire insurance / yr
- $1,222 – $2,270
Heat risk 8/10 · Major
- Hot days now (above 109°F)
- 6 days/yr
- Hot days in 30 yrs
- 17 days/yr
Wind risk 8/10 · Major
- Chance of severe wind over 30 yrs
- 80.0%
Air-quality risk 2/10 · Minimal
- Unhealthy air days now
- 1 days/yr
- Unhealthy air days in 30 yrs
- 1 days/yr
Risk factors via First Street. Map © Google.
Why this score? — see what drove the B- grade
The composite is a weighted blend of 9 inputs, each scored 0–100. Each bar is that input's sub-score; the figure is the points it added to the 100-point composite (weight × sub-score).
- Cash flow +30.0/30.0
- 1% rule +10.0/10.0
- DSCR +10.0/10.0
- ARV discount +7.5/15.0
- Livability +4.0/5.0
- Condition / age +2.5/5.0
- Rent growth +2.2/5.0
- Schools +2.2/10.0
- Appreciation +0.0/10.0
$110,000
🖨 Deal sheet (PDF) 📄 Offer letter ✓ Due diligence
Listing remarks MLS
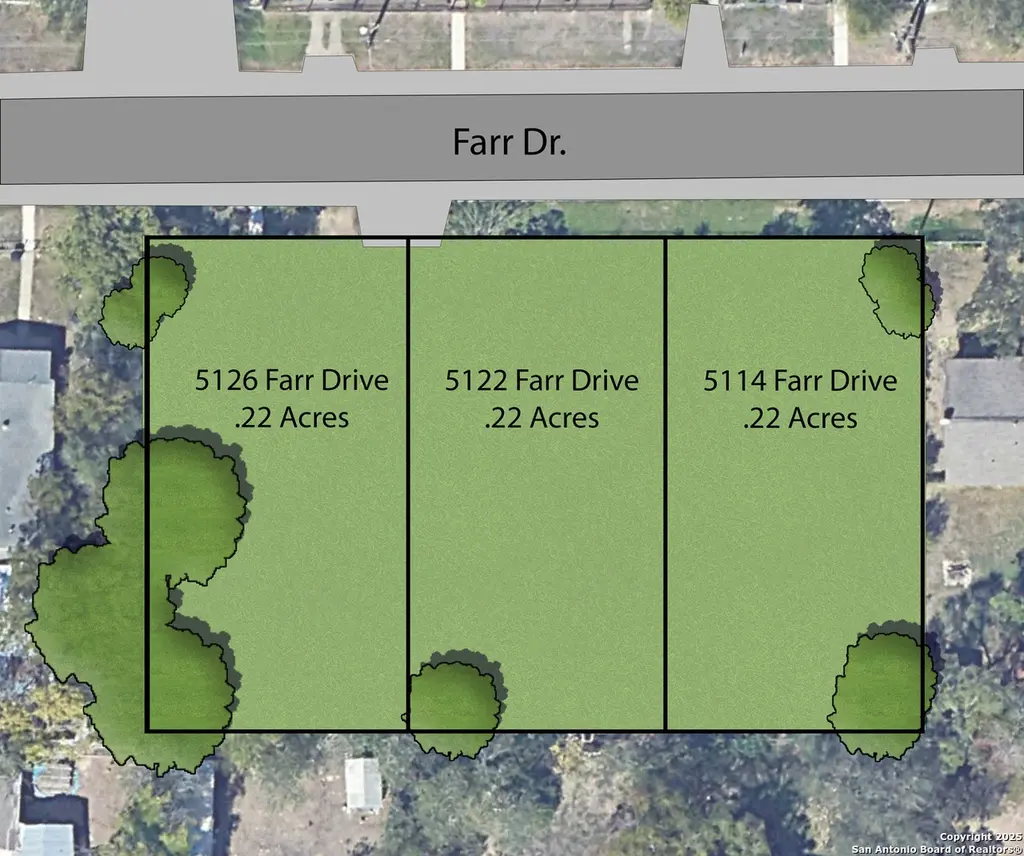
Fantastic development opportunity! This unique property features three contiguous lots totaling approximately 0.66 acres, sold together with the flexibility to develop individually or as a single project. Each 0.22+/- acre lot offers exceptional potential, whether you choose to place a mobile home on each lot or build new homes to sell separately. Located in a diverse neighborhood of both traditional and manufactured homes, this property sits in a rapidly growing area with convenient access to major highways. Existing mobile home can be rehabbed.
Key facts
- 0.66 acre lot
- Built 1995
- Listed 138 days
Tags
Neighborhood map
What this means for you Summary
Snapshot
- This is a 3-bed/2.0-bath single-family listed at $110k.
Deal economics
- At list price, monthly cash flow is $738 ($9k/yr) — positive.
- The deal already cash-flows at list — no discount required.
- Meets the 1% rule at list price ($2k rent vs $110k).
- Recommended offer: $97k (12.0% below list) — sets the bar for market timing.
- Cap rate 14.3% vs local median 3.8% in San Antonio — top-decile yield for the area; either an underpriced asset or a hidden risk that comps aren't pricing in. Stress-test before assuming the spread holds.
Location & tenants
- Location reads 80/100 on livability (#31 in TX, #1,616 nationally) — a professional / high-income tenant draw. Strengths: amenities A+, commute A+, cost of living A+; Watch: schools C-, crime F.
- Southwest ISD (rural): math 21% / reading 31% proficiency, ranked #701 of 826 in TX (top 85%) — low school quality limits family demand, transient renter base, plan for 1-2y turnover; 75% free/reduced lunch — lower-income household profile, screen leases tightly.
- Market conditions: Rents soft (-1.3%/yr); 92 active listings in the ZIP; 24 comparable units currently listed for rent nearby; rentals at typical pace (median 23d on market — plan ~3-4 weeks tenant-placement turnaround); 8,308 units permitted in Bexar County in 2024 (2,506 in 5+ unit buildings).
- This rent runs 44% of the median local income ($51k/yr) — at the standard rent-burdened threshold; future hikes will face affordability resistance.
Forward outlook
- Local home prices are declining (-3.0%/yr); year-one equity from $761 of loan paydown is wiped out by about $3k of value loss. Plan a longer hold.
- Bexar County population projected at +50% by 2050 — long-run rental-demand tailwind backs the buy-and-hold thesis.
- At projected returns (-3.0% appreciation + 0.0% rent growth), your $31k cash investment doubles in ~5 years — after that, you're playing with house money.
Negotiation context
- It's been on market 139 days — a 12% lower offer ($97k) is reasonable based on typical stale-listing flexibility.
Risks & watch-outs
- Climate carrying-cost: severe wind risk, 80% chance of damaging wind over 30y; extreme-heat days projected 6→17/yr by 2055 (HVAC capex compounding) — expect insurance premiums to compound above CPI over the hold.
Questions for the listing agent
- It's been on market 139 days. Have you received any prior offers? Is the seller open to a 12% concession, seller financing, or rate buy-down credit?
- Why hasn't it sold? Are there any deal-killer items the seller is aware of (foundation, flood, title, zoning, code violations)?
- Is there a deadline driving the sale (1031 exchange, divorce, estate, relocation)? That informs how much negotiation room exists.
- Crime grade is F in this area — have there been break-ins, vandalism, or insurance claims at this property in the last 3 years? What carrier currently insures it and at what premium?
- What's the average days-on-market for RENTAL listings here right now (not sales)? A rising rental-DOM trend means longer vacancies and softer asking-rent achievability than the comps imply.
- What's the recent tenant-quality profile in this submarket — average credit score on applications, eviction rate, late-payment / NSF rate, and stable-employment percentage? A property-management company in the area should have these aggregated.
- How much new for-sale + rental construction is in the pipeline within 1–3 miles? Heavy new supply typically softens prices + rents 12–24 months out; constrained supply supports both.
Investment metrics
- 1% rule
- 1.68% ✓
- Cap rate
- 14.34%
- Cash-on-cash
- 28.75%
- DSCR
- 2.28
- GRM
- 4.9
CMA / ARV
- ARV (median comp)
- $287,395
- List price
- $110,000
- Delta
- -61.73%
- Verdict
- UNDERPRICED
- Comps
- 20 within 1.0 mi
Show comp detail 9 sales within ~0.75 mi
| Address | Dist | Beds/Ba | Sqft | Sold | Price | $/sf | Match |
|---|---|---|---|---|---|---|---|
| 6910 Emerald Vly | 0.64mi | 3/2.0 | 2,014 (+9%) | 6mo | $299,999 | $149 | 50 |
| 5527 Jade Vly | 0.60mi | 3/2.0 | 1,930 (+4%) | 21mo | $305,990 | $159 | 47 |
| 7039 Diamond Vly | 0.56mi | 4/2.0 (+1) | 1,997 (+8%) | 13mo | $264,900 | $133 | 45 |
| 5515 Jade Vly | 0.58mi | 3/2.0 | 1,697 (-8%) | 20mo | $288,990 | $170 | 43 |
| 6810 Emerald Vly | 0.72mi | 3/2.5 | 2,078 (+12%) | 1mo | $310,000 | $149 | 43 |
| 8306 Rain Dance | 0.70mi | 4/3.0 (+1) | 1,760 (-5%) | 16mo | $229,900 | $131 | 37 |
| 5626 Mountain | 0.73mi | 4/2.0 (+1) | 1,668 (-10%) | 10mo | $225,000 | $135 | 36 |
| 5518 Onyx Vly | 0.60mi | 3/2.5 | 2,034 (+10%) | 21mo | $279,990 | $138 | 36 |
| 5539 Jade Vly | 0.63mi | 3/2.5 | 2,034 (+10%) | 22mo | $299,990 | $147 | 33 |
Match score weights: distance 35% · size 25% · config 20% · recency 20%. Top-matched comps best support the ARV.
Projected returns pro-forma
-3.0% appreciation · 0.0% rent growth · sell at horizon
- IRR
- 19.7%
- Equity multiple
- 1.77×
- Total profit
- $23,752
- Equity at exit
- $16,401
- IRR
- 25.9%
- Equity multiple
- 2.96×
- Total profit
- $60,245
- Equity at exit
- $9,511
Cash invested: $30,800 (down + closing). Projections, not guarantees.
Landlord ↔ Tenant lean methodology
- Overall (STATE)
- 87 Strongly Landlord-Friendly
- State Texas
- 87 Strongly Landlord-Friendly · R+5
- County
- — inherits STATE
- City
- — inherits STATE
ZIP-level market 78242
- Home prices YoY
- -17.6%
- Rents YoY
- -1.3%
- Active inventory
- 92
- Price-to-rent
- 4.9×
Monthly cashflow live
- Estimated rent
- $1,853 high interval (Pro) →
- Mortgage (P&I)
- −$577
- Tax from tax record
- −$103 /mo · $1,238/yr
- Insurance
- −$46
- HOA
- −$0
- Vacancy / Maint / Mgmt
- −$389
- Net cashflow
- $738
Break-even live
Sensitivity live
| Price | -10% $800 | -5% $769 | +0% $738 | +5% $707 | +10% $676 |
|---|---|---|---|---|---|
| Rent | -10% $592 | -5% $665 | +0% $738 | +5% $811 | +10% $884 |
| Rate | -1.0pp $793 | -0.5pp $766 | base $738 | +0.5pp $709 | +1.0pp $680 |
UW: 25.0% down · 7.5% · 30yr · 1.5% tax · 5.0% vac · 8.0% maint · 8.0% mgmt
Financing live
Cash to close
- Down payment
- $27,500
- Closing costs
- $3,300
- Reserves months
- —
- Total cash needed
- —
Loan-product check · same deal, 3 products live
Conventional
25% down · 7.5% · 30yr
- Down + closing
- —
- Monthly P&I
- —
- Monthly cashflow
- —
- DSCR
- —
- Eligible?
- —
Personal DTI + credit; lowest rate.
DSCR
20% down · 8.5% · 30yr
- Down + closing
- —
- Monthly P&I
- —
- Monthly cashflow
- —
- DSCR
- —
- Eligible?
- —
No personal income docs; deal must DSCR.
Hard money
10% down · 12.0% · 12mo
- Down + closing
- —
- Monthly P&I
- —
- Monthly cashflow
- —
- DSCR
- —
- Eligible?
- —
Short-term bridge; refi at stabilization.
Rent comps 24 comps
| Address | Beds | Baths | Sqft | Rent | $/sqft | DOM | Units | Dist |
|---|---|---|---|---|---|---|---|---|
| 8167 Dempsey Dr San Antonio, TX | 3.0 | 2.5 | 1777 | $1,610 | $0.91 | 45d | 1 | 0.44mi |
| 5406 Elm Valley Dr San Antonio, TX | 4.0 | 2.0 | 1667 | $3,000 | $1.80 | 0d | 1 | 0.53mi |
| 6943 Emerald Vly San Antonio, TX | 3.0 | 2.0 | 1341 | $1,650 | $1.23 | 16d | 1 | 0.58mi |
| 8311 Big Creek Dr San Antonio, TX | 3.0 | 2.5 | 1777 | $1,610 | $0.91 | 45d | 1 | 0.60mi |
| 5538 Jade Vly San Antonio, TX | 4.0 | 3.0 | 2061 | $2,100 | $1.02 | 45d | 1 | 0.61mi |
| 8522 Tesoro Hls San Antonio, TX | 3.0 | 2.5 | 1539 | $1,540 | $1.00 | 45d | 1 | 0.68mi |
| 5611 Elm Valley Dr San Antonio, TX | 3.0 | 2.0 | 1445 | $1,700 | $1.18 | 45d | 1 | 0.72mi |
| 6802 Emerald Vly San Antonio, TX | 3.0 | 2.5 | 2034 | $2,300 | $1.13 | 0d | 1 | 0.73mi |
| 5535 Cool Valley St San Antonio, TX | 4.0 | 3.0 | 1716 | $1,700 | $0.99 | 4d | 1 | 0.73mi |
| 5634 Mountain Pt San Antonio, TX | 4.0 | 2.5 | 1874 | $1,745 | $0.93 | 23d | 1 | 0.74mi |
| 8619 Tesoro Hls San Antonio, TX | 3.0 | 2.5 | 1539 | $1,540 | $1.00 | 25d | 1 | 0.75mi |
| 5715 Mountain Pt San Antonio, TX | 4.0 | 2.0 | 1668 | $1,900 | $1.14 | 45d | 1 | 0.82mi |
| 7026 Randado Ct San Antonio, TX | 4.0 | 2.0 | 1667 | $3,000 | $1.80 | 0d | 1 | 0.84mi |
| 8739 Tesoro Hls San Antonio, TX | 3.0 | 2.5 | 1777 | $1,595 | $0.90 | 5d | 1 | 0.87mi |
| 5539 Pearl Vly San Antonio, TX | 3.0 | 2.0 | 1770 | $1,925 | $1.09 | 5d | 1 | 0.88mi |
| 5543 Coral Vly San Antonio, TX | 3.0 | 2.0 | 1533 | $1,750 | $1.14 | 25d | 1 | 0.92mi |
| 4750 Military Dr W San Antonio, TX | 1.0–3.0 | 1.0–2.0 | 1015 | $1,969 | $1.94 | 0d | 10 | 0.94mi |
| 5542 Snow Fox St San Antonio, TX | 4.0 | 1.5 | 1280 | $1,900 | $1.48 | 45d | 1 | 1.05mi |
| 5927 Mohave Vly San Antonio, TX | 3.0 | 2.0 | 1464 | $1,750 | $1.20 | 25d | 1 | 1.05mi |
| 8905 Seacliff St San Antonio, TX | 3.0 | 2.5 | 1230 | $1,250 | $1.02 | 17d | 1 | 1.12mi |
| 150 Rustleaf Dr San Antonio, TX | 1.0–3.0 | 1.0–2.0 | 898 | $1,099 | $1.22 | 3d | 46 | 1.15mi |
| 5331 Beryl Cv San Antonio, TX | 3.0 | 2.0 | 1301 | $2,000 | $1.54 | 5d | 1 | 1.22mi |
| 7058 Dominic Vly San Antonio, TX | 4.0 | 2.5 | 1687 | $1,650 | $0.98 | 45d | 1 | 1.25mi |
| 5938 Autumn Palms San Antonio, TX | 3.0 | 2.0 | 1350 | $2,400 | $1.78 | 0d | 1 | 1.42mi |
Listing history 16 events
-
2026-06-21days on market $110,000 Active 139 DOM
-
2026-06-18days on market $110,000 Active 136 DOM
-
2026-06-17days on market $110,000 Active 135 DOM
-
2026-06-16days on market $110,000 Active 134 DOM
-
2026-06-15days on market $110,000 Active 133 DOM
-
2026-06-13days on market $110,000 Active 131 DOM
-
2026-06-09days on market $110,000 Active 127 DOM
-
2026-06-08days on market $110,000 Active 126 DOM
-
2026-06-07days on market $110,000 Active 125 DOM
-
2026-06-04days on market $110,000 Active 122 DOM
-
2026-06-03days on market $110,000 Active 121 DOM
-
2026-06-02days on market $110,000 Active 120 DOM
-
2026-06-01days on market $110,000 Active 119 DOM
-
2026-05-31days on market $110,000 Active 118 DOM
-
2026-03-20price $110,000 552-char remark
Show marketing remark (552 chars)
Fantastic development opportunity! This unique property features three contiguous lots totaling approximately 0.66 acres, sold together with the flexibility to develop individually or as a single project. Each 0.22+/- acre lot offers exceptional potential, whether you choose to place a mobile home on each lot or build new homes to sell separately. Located in a diverse neighborhood of both traditional and manufactured homes, this property sits in a rapidly growing area with convenient access to major highways. Existing mobile home can be rehabbed.
-
2026-02-02$135,000 New 552-char remark
Show marketing remark (552 chars)
Fantastic development opportunity! This unique property features three contiguous lots totaling approximately 0.66 acres, sold together with the flexibility to develop individually or as a single project. Each 0.22+/- acre lot offers exceptional potential, whether you choose to place a mobile home on each lot or build new homes to sell separately. Located in a diverse neighborhood of both traditional and manufactured homes, this property sits in a rapidly growing area with convenient access to major highways. Existing mobile home can be rehabbed.
ⓘ Source: listings_history table (triggers on properties + properties_extension) + one-shot
backfill from property_details.listing_events for pre-trigger history.
Tax reassessment forecast TX · Resets to sale price
- Current annual tax
- $1,238 · $103/mo
- Projected year-2 tax
- $2,013 · $168/mo
- Expected delta
- +$775/yr (+$65/mo · 62.6%)
ⓘ Screening estimate from a state-policy table — verify with the county assessor before closing.
Climate risk First Street
- Flood 1/10 Low FEMA zone X (unshaded) · 0% chance over 30 yrs
- Wildfire 4/10 Moderate
- Heat 8/10 Severe 6 d/yr ≥109°F today · 17 d/yr by 30 yrs out
- Wind 8/10 Severe 80% chance of damaging wind over 30 yrs
- Air quality 2/10 Low 1 unhealthy d/yr today · 1 by 30 yrs out
Nearby sold comps map
Loading sold comps map…
Walkable amenities ~0.75 mi
Loading nearby amenities…
Taxation est. · year 1
- Rental income
- $22,235
- − Mortgage interest
- −$6,162
- − Property taxes
- −$1,238
- − Insurance
- −$550
- − Repairs & maintenance
- −$1,779
- − Management
- −$1,779
- − Depreciation
- −$3,200
- Taxable income
- $7,528
- Est. tax owed @ 24.0%
- −$1,807
- After-tax cash flow
- $7,049/yr
For passive investors: Depreciation is non-cash, so a rental often shows a tax loss while cash-flowing — sheltering income. Rental losses are passive: they offset passive income freely, and up to $25,000/yr can offset ordinary (W-2) income if you actively participate and your MAGI is under $100k (phasing out to $0 by $150k); unused losses carry forward. On sale, claimed depreciation is recaptured at up to 25%, and gains may owe capital-gains tax (a 1031 exchange can defer both). Figures are a year-1 estimate at your 24.0% rate — not tax advice; consult a CPA.
Schools (NCES district)
- District
- Southwest ISD
- NCES district ID
- 4840950
- Math proficiency
- 21% ▼ -21.00%
- Reading proficiency
- 31% ▼ -5.00%
- Median HH income
- $43,362
- Composite
- 22.22/100
- National rank
- #8153
- State rank
- #701 of 826 in TX
Livability — San Antonio
- Score
- 80/100
- State rank
- #31
- US rank
- #1616
Category grades
Schools grade is shown separately in the Schools card above.
Census & demographics
- Census place
- San Antonio, TX
- County
- Bexar County · 1,990,555 people
- City population
- 1,806,925
- Metro
- San Antonio-New Braunfels, TX
- Population (ZIP)
- 36,168
- Household income
- $50,644
- Rent vs Own
- Severe rent burden
- 1778.0
Population outlook (Bexar County) Hauer SSP2
- Today (2025)
- 2,336,851 people
- By 2030
- 2,560,728 · +9.6%
- By 2040
- 3,020,569 · +29.3%
- By 2050
- 3,493,522 · +49.5%
- By 2075
- 4,668,459 · +99.8%
- By 2100
- 5,533,242 · +136.8%
Race, ethnicity, and origin ACS 2023
- Neighborhood character
- Predominantly Hispanic (86%)
- Race & ethnicity
- Hispanic / Latino 86% Two or more races 25% White 8% Black 3% Native American 2%
- Hispanic origin (detail)
- Mexican 67%
- Common ancestry
- Romanian 1% Italian 1%
- Foreign-born
- 20% · Canada
- Languages at home
- 43% English-only · Spanish 55%
Political lean MEDSL · Bexar
- 2024 margin
- Lean D (+9.8) · D 54.3% · R 44.6% · Other 1.1%
- 2008→2024 swing
- +4.2pp toward D · 2008: 5.6pp · 2024: 9.8pp
- All cycles
- 2024: D+9.8 2020: D+18.2 2016: D+13.5 2012: D+4.6 2008: D+5.6
Not yet ingested
- Civics
- —
Market trends
- HPI YoY
- ▼ -55.63%
- Current HPI
- 259.9788
- Rent YoY
- ▼ -1.32%
- Metro
- San Antonio-New Braunfels, TX
- State GDP YoY
- ▲ 3.95%
- F500 in state
- 110
Industry mix (Fortune 500 HQ in TX)
| Industry | F500 HQs | Revenue |
|---|---|---|
| Energy | 16 | $1,198B |
|
||
| Technology | 5 | $198B |
|
||
| Engineering / Construction | 4 | $72B |
|
||
| Energy Services | 3 | $60B |
|
||
| Utilities | 3 | $41B |
|
||
| Healthcare | 2 | $330B |
|
||
Price history
-18.5% since first listed2 events — show timeline
- 2026-03-20 Price Changed $110,000 LERA
- 2026-02-02 Listed $135,000 LERA
Property tax history
+10.1%/yrLatest (2025): $1,238 · -0.4% YoY. Source: county tax records.
Cash-flow waterfall
monthlySold comps — $/sqft
last 12 mo · ≤1 miLoading sold comps…