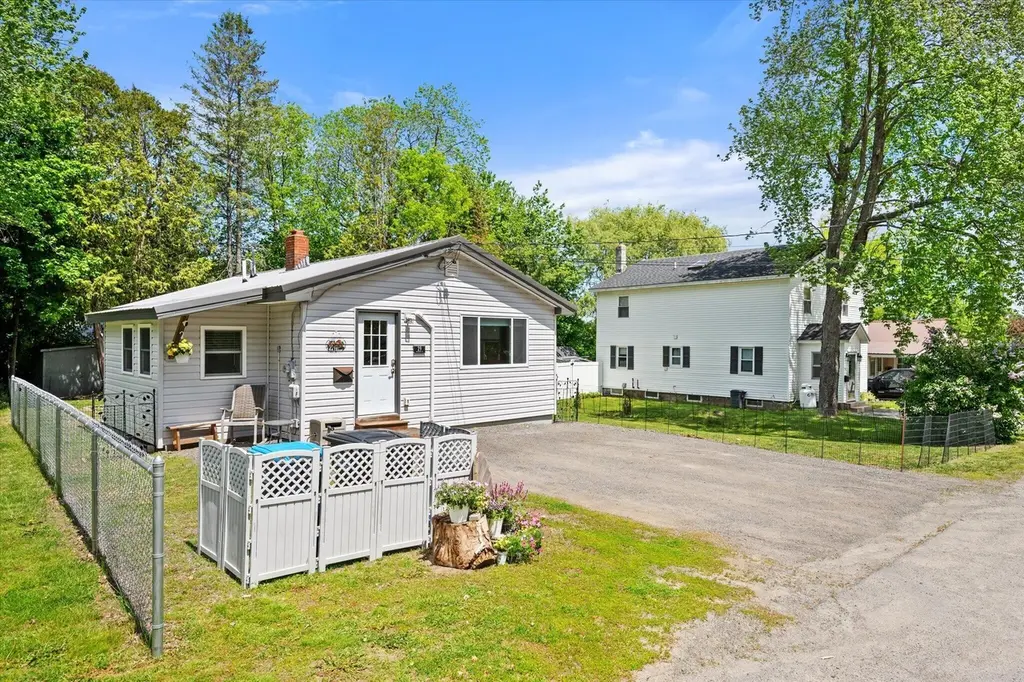
29 Wilson St · Old Town, ME
Flood risk 1/10 · Minimal
- FEMA flood zone
- X (unshaded)
- Chance of flooding over 30 yrs
- 0.0%
- Est. flood insurance / yr
- $507 – $1,088
Fire risk 1/10 · Minimal
- Est. fire insurance / yr
- $669 – $1,243
Heat risk 2/10 · Minimal
- Hot days now (above 92°F)
- 7 days/yr
- Hot days in 30 yrs
- 15 days/yr
Wind risk 6/10 · Moderate
- Chance of severe wind over 30 yrs
- 27.0%
Air-quality risk 1/10 · Minimal
- Unhealthy air days now
- 0 days/yr
- Unhealthy air days in 30 yrs
- 0 days/yr
Risk factors via First Street. Map © Google.
Why this score? — see what drove the C- grade
The composite is a weighted blend of 9 inputs, each scored 0–100. Each bar is that input's sub-score; the figure is the points it added to the 100-point composite (weight × sub-score).
- Cash flow +15.6/30.0
- ARV discount +11.9/15.0
- Schools +6.8/10.0
- DSCR +4.8/10.0
- 1% rule +4.3/10.0
- Livability +3.8/5.0
- Rent growth +2.5/5.0
- Condition / age +2.5/5.0
- Appreciation +2.4/10.0
$199,900
🖨 Deal sheet (PDF) 📄 Offer letter ✓ Due diligence
Listing remarks MLS
Looking for an affordable house without any worries of maintenance?! This is the house for you!! Fully renovated in 2019!! New Vinyl Siding, metal roof, and Tile and Wood flooring throughout! The open concept design makes this small house feel big! Its even right next door to a lovely park! This won't last long, come take a look!
Key facts
- Metal roof
- Heat pump
- One-floor living
Tags
Property features AI
Exterior
- Parking: Gravel parking with 1–4 spaces
- Utilities: Public water; Public sewer; Water heater off heating system
- Home design: Single family residence; Facing information not provided
- Construction: Built in 1970; Wood frame construction; Vinyl siding; Metal roof; Block foundation
- Exterior features: Intown location; Neighborhood setting; Level lot; Sidewalks; Paved road
Interior
- Kitchen: Dishwasher; Electric range; Microwave; Refrigerator
- Bedrooms: Bedroom 1 (first floor); Bedroom 2 (first floor); Bedroom 3 (first floor)
- Flooring: Tile; Wood
- Bathrooms: 1 full bathroom
- Heating & cooling: Heat pump (heating and cooling); Baseboard heating; Hot water heating; Circuit breakers
- Interior features: One-floor living; First-floor bedroom; Bathtub and shower; Double-pane windows; Cable available; Tankless water heater; Ceiling fans; Thermostat
- Laundry & utility: Washer; Dryer; Laundry on main level
Neighborhood map
What this means for you Summary
Snapshot
- This is a 3-bed/1.0-bath single-family listed at $200k.
Deal economics
- At list price, monthly cash flow is $86 ($1k/yr) — positive.
- The deal already cash-flows at list — no discount required.
- To meet the 1% rule (rent ≥ 1% of price), the offer needs to be $185k (7.4% below list).
- Recommended offer: $185k (7.4% below list) — sets the bar for 1% rule.
Location & tenants
- Location reads 75/100 on livability (#38 in ME, #3,905 nationally) — a middle-class / working-renter tenant base. Strengths: crime A+, cost of living A+, housing A+; Watch: employment D, amenities F, commute F.
- RSU 34 (suburban): math 81% / reading 83% proficiency, ranked #80 of 112 in ME (top 71%) — strong family-tenant draw, lease renewals of 3-5y typical.
- Zoned schools: Old Town Elementary School (math 83% / reading 83%, grade A+, #151 of 294 statewide, top 52%, 427 students, 57% FRL); Leonard Middle School (math 80% / reading 80%, grade A+, #59 of 85 statewide, top 71%, 306 students, 49% FRL); Old Town High School (math 87% / reading 98%, grade A+, #26 of 108 statewide, top 23%, 536 students, 46% FRL).
- Market conditions: 46 active listings in the ZIP; 2 comparable units currently listed for rent nearby; 440 units permitted in Penobscot County in 2024 (40 in 5+ unit buildings).
- This rent runs 39% of the median local income ($56k/yr) — at the standard rent-burdened threshold; future hikes will face affordability resistance.
Forward outlook
- Local home prices are declining (-3.0%/yr); year-one equity from $1k of loan paydown is wiped out by about $6k of value loss. Plan a longer hold.
- Penobscot County population projected at -17% by 2050 — secular population decline; favor cash flow + early exit over multi-decade hold.
Negotiation context
- Only 1 days on market — expect competitive offers; lowballing is unlikely to land.
- 3 sale attempts since 7y ago with the ask held roughly flat each time — persistent listings suggest the price (not the market) is what's stuck; bring a comps-based counter.
Risks & watch-outs
- Climate carrying-cost: major wind risk, 27% chance of damaging wind over 30y — expect insurance premiums to compound above CPI over the hold.
Questions for the listing agent
- Built in 1970 — when were the roof, HVAC, electrical panel, plumbing, and water heater last replaced?
- Is there a deadline driving the sale (1031 exchange, divorce, estate, relocation)? That informs how much negotiation room exists.
- Schools are D-rated, which usually means shorter tenancies and higher turnover. Who's the typical renter profile here, and what's been the actual vacancy rate?
- What's the average days-on-market for RENTAL listings here right now (not sales)? A rising rental-DOM trend means longer vacancies and softer asking-rent achievability than the comps imply.
- What's the recent tenant-quality profile in this submarket — average credit score on applications, eviction rate, late-payment / NSF rate, and stable-employment percentage? A property-management company in the area should have these aggregated.
- How much new for-sale + rental construction is in the pipeline within 1–3 miles? Heavy new supply typically softens prices + rents 12–24 months out; constrained supply supports both.
Investment metrics
- 1% rule
- 0.93% ✗
- Cap rate
- 6.81%
- Cash-on-cash
- 1.84%
- DSCR
- 1.08
- GRM
- 9.0
CMA / ARV
- ARV (on-the-fly)
- $221,556
- Comps found
- 12
Show comp detail 12 sales within ~0.75 mi
| Address | Dist | Beds/Ba | Sqft | Sold | Price | $/sf | Match |
|---|---|---|---|---|---|---|---|
| 85 Lincoln St | 0.07mi | 3/1.0 | 1,008 (+1%) | 1mo | $224,000 | $222 | 94 |
| 124 Jefferson St | 0.07mi | 3/1.0 | 933 (-6%) | 1mo | $210,000 | $225 | 85 |
| 19 Harding St | 0.13mi | 3/1.0 | 1,000 (+0%) | 12mo | $192,000 | $192 | 84 |
| 55 Lincoln St | 0.05mi | 2/1.0 (-1) | 912 (-9%) | 3mo | $80,000 | $88 | 76 |
| 103 Sixth St | 0.22mi | 3/1.0 | 1,029 (+3%) | 11mo | $190,000 | $185 | 76 |
| 115 7th St | 0.17mi | 3/1.5 | 1,040 (+4%) | 15mo | $150,000 | $144 | 71 |
| 189 Oak St | 0.25mi | 2/1.0 (-1) | 882 (-12%) | 10mo | $199,000 | $226 | 56 |
| 32 Cooper St | 0.48mi | 3/1.0 | 1,014 (+2%) | 23mo | $246,000 | $243 | 56 |
| 569 Brunswick St | 0.70mi | 2/1.0 (-1) | 1,000 (+0%) | 13mo | $270,000 | $270 | 51 |
| 6 Nadeau St | 0.69mi | 3/1.5 | 966 (-3%) | 16mo | $160,000 | $166 | 47 |
| 23 Lee Ln | 0.58mi | 3/1.0 | 1,040 (+4%) | 23mo | $244,200 | $235 | 47 |
| 556 Brunswick St | 0.69mi | 3/1.0 | 1,136 (+14%) | 24mo | $238,000 | $210 | 25 |
Match score weights: distance 35% · size 25% · config 20% · recency 20%. Top-matched comps best support the ARV.
Projected returns pro-forma
-3.0% appreciation · 3.0% rent growth · sell at horizon
- IRR
- -13.4%
- Equity multiple
- 0.52×
- Total profit
- $-26,900
- Equity at exit
- $29,806
- IRR
- -4.4%
- Equity multiple
- 0.71×
- Total profit
- $-16,282
- Equity at exit
- $17,284
Cash invested: $55,972 (down + closing). Projections, not guarantees.
Landlord ↔ Tenant lean methodology
- Overall (STATE)
- 41 Moderately Tenant-Leaning
- State Maine
- 41 Moderately Tenant-Leaning · D+2
- County
- — inherits STATE
- City
- — inherits STATE
ZIP-level market 04468
- Home prices YoY
- -1.8%
- Active inventory
- 46
- Price-to-rent
- 9.0×
Monthly cashflow live
- Estimated rent
- $1,851 medium interval (Pro) →
- Mortgage (P&I)
- −$1,048
- Tax from tax record
- −$245 /mo · $2,941/yr
- Insurance
- −$83
- HOA
- −$0
- Vacancy / Maint / Mgmt
- −$389
- Net cashflow
- $86
Break-even live
Sensitivity live
| Price | -10% $199 | -5% $142 | +0% $86 | +5% $29 | +10% $-27 |
|---|---|---|---|---|---|
| Rent | -10% $-60 | -5% $13 | +0% $86 | +5% $159 | +10% $232 |
| Rate | -1.0pp $187 | -0.5pp $137 | base $86 | +0.5pp $34 | +1.0pp $-19 |
UW: 25.0% down · 7.5% · 30yr · 1.5% tax · 5.0% vac · 8.0% maint · 8.0% mgmt
Financing live
Cash to close
- Down payment
- $49,975
- Closing costs
- $5,997
- Reserves months
- —
- Total cash needed
- —
Loan-product check · same deal, 3 products live
Conventional
25% down · 7.5% · 30yr
- Down + closing
- —
- Monthly P&I
- —
- Monthly cashflow
- —
- DSCR
- —
- Eligible?
- —
Personal DTI + credit; lowest rate.
DSCR
20% down · 8.5% · 30yr
- Down + closing
- —
- Monthly P&I
- —
- Monthly cashflow
- —
- DSCR
- —
- Eligible?
- —
No personal income docs; deal must DSCR.
Hard money
10% down · 12.0% · 12mo
- Down + closing
- —
- Monthly P&I
- —
- Monthly cashflow
- —
- DSCR
- —
- Eligible?
- —
Short-term bridge; refi at stabilization.
Rent comps 2 comps
| Address | Beds | Baths | Sqft | Rent | $/sqft | DOM | Units | Dist |
|---|---|---|---|---|---|---|---|---|
| 21 Jefferson St Unit 1 Old Town, ME | 2.0 | 1.0 | 925 | $1,795 | $1.94 | 45d | 1 | 0.19mi |
| 41 County Rd Milford, ME | 3.0 | 2.0 | 1000 | $1,500 | $1.50 | 45d | 1 | 1.23mi |
Listing history 2 events
-
2026-06-07remarks 580-char remark
-
2026-06-07$199,900 Pending 1 DOM
ⓘ Source: listings_history table (triggers on properties + properties_extension) + one-shot
backfill from property_details.listing_events for pre-trigger history.
Tax reassessment forecast ME · Partial reset (capped growth)
- Current annual tax
- $2,941 · $245/mo
- Projected year-2 tax
- $2,941 · $245/mo
- Expected delta
- $0/yr ($0/mo · 0.0%)
ⓘ Screening estimate from a state-policy table — verify with the county assessor before closing.
Climate risk First Street
- Flood 1/10 Low FEMA zone X (unshaded) · 0% chance over 30 yrs
- Wildfire 1/10 Low
- Heat 2/10 Low 7 d/yr ≥92°F today · 15 d/yr by 30 yrs out
- Wind 6/10 Major 27% chance of damaging wind over 30 yrs
- Air quality 1/10 Low 0 unhealthy d/yr today · 0 by 30 yrs out
Nearby sold comps map
Loading sold comps map…
Walkable amenities ~0.75 mi
Loading nearby amenities…
Taxation est. · year 1
- Rental income
- $22,215
- − Mortgage interest
- −$11,198
- − Property taxes
- −$2,941
- − Insurance
- −$1,000
- − Repairs & maintenance
- −$1,777
- − Management
- −$1,777
- − Depreciation
- −$5,815
- Taxable loss
- −$2,292
- Est. tax savings @ 24.0%
- +$550
- After-tax cash flow
- $1,580/yr
For passive investors: Depreciation is non-cash, so a rental often shows a tax loss while cash-flowing — sheltering income. Rental losses are passive: they offset passive income freely, and up to $25,000/yr can offset ordinary (W-2) income if you actively participate and your MAGI is under $100k (phasing out to $0 by $150k); unused losses carry forward. On sale, claimed depreciation is recaptured at up to 25%, and gains may owe capital-gains tax (a 1031 exchange can defer both). Figures are a year-1 estimate at your 24.0% rate — not tax advice; consult a CPA.
Schools (NCES district)
- District
- RSU 34
- NCES district ID
- 2314782
- Math proficiency
- 81% ▲ 48.00%
- Reading proficiency
- 83% ▲ 31.00%
- Median HH income
- $39,466
- Composite
- 68.31/100
- National rank
- #351
- State rank
- #80 of 112 in ME
Livability — Old Town
- Score
- 75/100
- State rank
- #38
- US rank
- #3905
Category grades
Schools grade is shown separately in the Schools card above.
Census & demographics
- Census place
- Old Town, ME
- County
- Penobscot County · 81,539 people
- City population
- 9,291
- Metro
- Bangor, ME
- Population (ZIP)
- 9,291
- Household income
- $56,358
- Rent vs Own
- Severe rent burden
- 334.0
Population outlook (Penobscot County) Hauer SSP2
- Today (2025)
- 149,928 people
- By 2030
- 146,386 · -2.4%
- By 2040
- 135,952 · -9.3%
- By 2050
- 123,864 · -17.4%
- By 2075
- 97,825 · -34.8%
- By 2100
- 77,196 · -48.5%
Race, ethnicity, and origin ACS 2023
- Neighborhood character
- Predominantly White (88%)
- Race & ethnicity
- White 88% Native American 6% Two or more races 3% Hispanic / Latino 2%
- Common ancestry
- Lithuanian 18% Slovak 4% Romanian 1%
- Foreign-born
- 2% · Canada
- Languages at home
- 96% English-only · French/Haitian/Cajun 1% Other Indo-European 1%
Political lean MEDSL · Penobscot
- 2024 margin
- R (+10.9) · D 43.6% · R 54.5% · Other 1.9%
- 2008→2024 swing
- -15.9pp toward R · 2008: 5.0pp · 2024: -10.9pp
- All cycles
- 2024: R+10.9 2020: R+8.3 2016: R+10.9 2012: D+2.9 2008: D+5.0
Not yet ingested
- Civics
- —
Market trends
- HPI YoY
- ▼ -5.29%
- Current HPI
- 285.3183
- Rent YoY
- —
- Metro
- Bangor, ME
- State GDP YoY
- —
- F500 in state
- 0
Price history
+784.5% since first listed9 events — show timeline
- 2026-06-06 Pending — MREIS
- 2026-06-05 Contingent — MREIS
- 2026-06-03 Listed $199,900 MREIS
- 2022-03-25 Sold (MLS) $180,000 MREIS
- 2022-02-07 Pending — MREIS
- 2022-02-03 Listed $169,900 MREIS
- 2019-02-05 Sold (MLS) $22,000 MREIS
- 2019-01-03 Pending — MREIS
- 2019-01-03 Listed $22,600 MREIS
Property tax history
+7.2%/yrLatest (2025): $2,941 · +12.9% YoY. Source: county tax records.
Cash-flow waterfall
monthlySold comps — $/sqft
last 12 mo · ≤1 miLoading sold comps…