 Multi-family
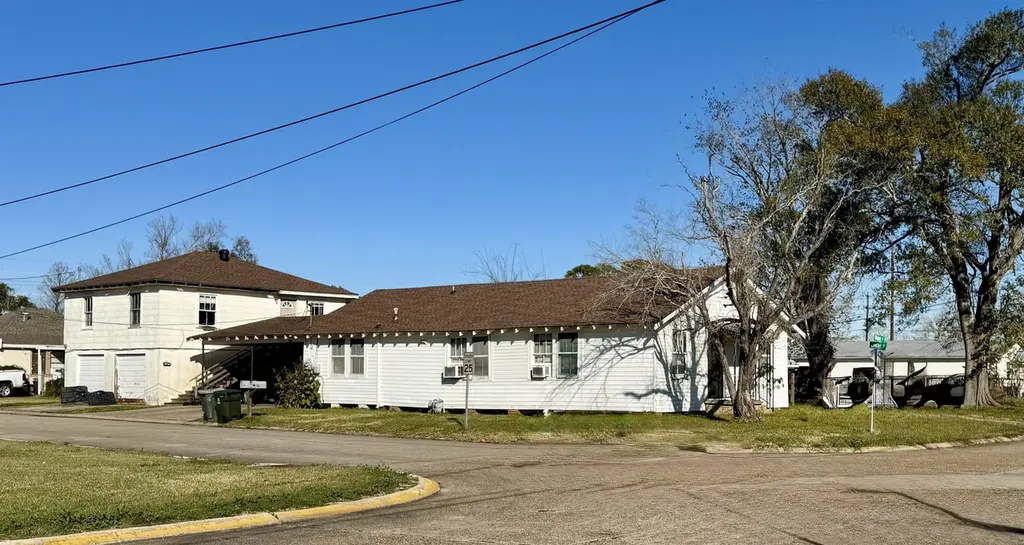
1301 & 1301 1/2 Bourg St · Houma, LA
Flood risk 8/10 · Major
- FEMA flood zone
- AE
- Chance of flooding over 30 yrs
- 0.98%
- Est. flood insurance / yr
- $1,737 – $8,500
Fire risk 1/10 · Minimal
- Est. fire insurance / yr
- $1,269 – $2,357
Heat risk 9/10 · Severe
- Hot days now (above 107°F)
- 7 days/yr
- Hot days in 30 yrs
- 22 days/yr
Wind risk 9/10 · Severe
- Chance of severe wind over 30 yrs
- 99.0%
Air-quality risk 1/10 · Minimal
- Unhealthy air days now
- 0 days/yr
- Unhealthy air days in 30 yrs
- 0 days/yr
Risk factors via First Street. Map © Google.
Why this score? — see what drove the B+ grade
The composite is a weighted blend of 9 inputs, each scored 0–100. Each bar is that input's sub-score; the figure is the points it added to the 100-point composite (weight × sub-score).
- Cash flow +30.0/30.0
- ARV discount +15.0/15.0
- 1% rule +10.0/10.0
- DSCR +10.0/10.0
- Schools +3.3/10.0
- Livability +3.2/5.0
- Rent growth +2.5/5.0
- Condition / age +1.0/5.0
- Appreciation +0.0/10.0
$140,000
🖨 Deal sheet (PDF) 📄 Offer letter ✓ Due diligence
Multi-family units
County records classify this as Multi-Family (2-4 Unit). Listing-text estimate: 1 unit. estimate disagrees with records
Listing remarks MLS
This property has 3 units, 2 with 2 bedrooms and 1 bath, and 1 with 1 bedroom 1 bath. 2 unites already have tenants in place. Put your personal mark on this great investment. Call your REALTOR for a viewing today!
Key facts
- 7,405 sq ft lot
- 3 parking spots
- Listed 513 days
Neighborhood map
What this means for you Summary
Snapshot
- This is a multifamily listed at $140k. Condition is rated poor.
Deal economics
- At list price, monthly cash flow is $1k ($18k/yr) — positive.
- The deal already cash-flows at list — no discount required.
- Meets the 1% rule at list price ($4k rent vs $140k).
- Recommended offer: $123k (12.0% below list) — sets the bar for market timing.
- Cap rate 22.6% vs local median 4.0% in Houma — top-decile yield for the area; either an underpriced asset or a hidden risk that comps aren't pricing in. Stress-test before assuming the spread holds.
Location & tenants
- Location reads 64/100 on livability (#165 in LA) — a middle-class / working-renter tenant base. Strengths: cost of living A+, housing A; Watch: employment D, crime D-, amenities F.
- Terrebonne Parish (other): math 32% / reading 46% proficiency, ranked #23 of 98 in LA (top 24%) — families likely to look elsewhere, expect single-tenant / working-renter base with shorter leases; 62% free/reduced lunch — lower-income household profile, screen leases tightly.
- Zoned schools: Southdown Elementary School (math 20% / reading 36%, grade F, #355 of 646 statewide, top 55%, 504 students, 76% FRL); Houma Junior High School (math 23% / reading 49%, grade F, #84 of 218 statewide, top 41%, 729 students, 56% FRL); Terrebonne High School (math 38% / reading 41%, grade F, #80 of 265 statewide, top 32%, 1,386 students, 49% FRL) — zoned schools at 61% FRL track the district average.
- Market conditions: 313 active listings in the ZIP; 300 units permitted in Terrebonne Parish in 2024 (0 in 5+ unit buildings).
- At $3,634/mo this rent would consume 63% of the median local household income ($69k/yr) (locally 387% of renters already pay >50% of income on rent) — very limited rent-growth headroom before tenants either downsize or default.
Forward outlook
- Local home prices are declining (-3.0%/yr); year-one equity from $968 of loan paydown is wiped out by about $4k of value loss. Plan a longer hold.
- At projected returns (-3.0% appreciation + 3.0% rent growth), your $39k cash investment doubles in ~3 years — after that, you're playing with house money.
Negotiation context
- It's been on market 513 days — a 12% lower offer ($123k) is reasonable based on typical stale-listing flexibility.
- 2 sale attempts with the ask held roughly flat each time — persistent listings suggest the price (not the market) is what's stuck; bring a comps-based counter.
Risks & watch-outs
- Watch-outs: flood insurance adds $427/mo.
- Climate carrying-cost: in FEMA flood zone AE (mandatory federal flood insurance); severe wind risk, 99% chance of damaging wind over 30y; extreme-heat days projected 7→22/yr by 2055 (HVAC capex compounding) — expect insurance premiums to compound above CPI over the hold.
Questions for the listing agent
- It's been on market 513 days. Have you received any prior offers? Is the seller open to a 12% concession, seller financing, or rate buy-down credit?
- Have any recent inspections been done? Can we get a copy of the seller's disclosures and any deferred-maintenance estimates?
- What's the actual annual flood-insurance premium (NFIP or private), and is the property in a SFHA with mandatory coverage?
- Why hasn't it sold? Are there any deal-killer items the seller is aware of (foundation, flood, title, zoning, code violations)?
- Is there a deadline driving the sale (1031 exchange, divorce, estate, relocation)? That informs how much negotiation room exists.
- Schools are B-rated — typically a magnet for longer-tenancy family renters. What's the average tenant stay here, and is there a school-zone premium baked into asking?
- Crime grade is D in this area — have there been break-ins, vandalism, or insurance claims at this property in the last 3 years? What carrier currently insures it and at what premium?
- What's the average days-on-market for RENTAL listings here right now (not sales)? A rising rental-DOM trend means longer vacancies and softer asking-rent achievability than the comps imply.
- What's the recent tenant-quality profile in this submarket — average credit score on applications, eviction rate, late-payment / NSF rate, and stable-employment percentage? A property-management company in the area should have these aggregated.
- How much new apartment / multifamily construction is in the pipeline within 1–3 miles? Heavy new supply (>2% of stock underway) typically softens rents 12–24 months out; light construction supports rent growth.
Investment metrics
- 1% rule
- 2.60% ✓
- Cap rate
- 22.61%
- Cash-on-cash
- 58.27%
- DSCR
- 3.59
- GRM
- 3.2
CMA / ARV
- ARV (median comp)
- $247,818
- List price
- $140,000
- Delta
- -43.51%
- Verdict
- UNDERPRICED
- Comps
- 5 within 1.0 mi
Projected returns pro-forma
-3.0% appreciation · 3.0% rent growth · sell at horizon
- IRR
- 42.4%
- Equity multiple
- 2.83×
- Total profit
- $71,690
- Equity at exit
- $20,874
- IRR
- 48.6%
- Equity multiple
- 5.72×
- Total profit
- $184,830
- Equity at exit
- $12,105
Cash invested: $39,200 (down + closing). Projections, not guarantees.
Landlord ↔ Tenant lean methodology
- Overall (STATE)
- 90 Strongly Landlord-Friendly
- State Louisiana
- 90 Strongly Landlord-Friendly · R+12
- County
- — inherits STATE
- City
- — inherits STATE
ZIP-level market 70364
- Active inventory
- 313
- Price-to-rent
- 9.2×
Monthly cashflow live
- Estimated rent
- $3,634 high interval (Pro) →
- Mortgage (P&I)
- −$734
- Tax est. 1.5%
- −$175 /mo · $2,100/yr
- Insurance
- −$58
- Flood insurance flood zone
- −$427 /mo · $5,118/yr
- HOA
- −$0
- Vacancy / Maint / Mgmt
- −$763
- Net cashflow
- $1,477
Break-even live
Sensitivity live
| Price | -10% $1,574 | -5% $1,525 | +0% $1,477 | +5% $1,428 | +10% $1,380 |
|---|---|---|---|---|---|
| Rent | -10% $1,190 | -5% $1,333 | +0% $1,477 | +5% $1,620 | +10% $1,764 |
| Rate | -1.0pp $1,547 | -0.5pp $1,512 | base $1,477 | +0.5pp $1,441 | +1.0pp $1,404 |
3-unit breakdown (identical units grouped — click to expand)
| Units | Beds | Baths | Est. rent |
|---|---|---|---|
| 2× units | 2 | 1 | $2,536 |
| #1 | 2 | 1 | $1,268 |
| #2 | 2 | 1 | $1,268 |
| 1× unit | 1 | 1 | $1,099 |
| Total (3 units) | $3,634 | ||
UW: 25.0% down · 7.5% · 30yr · 1.5% tax · 5.0% vac · 8.0% maint · 8.0% mgmt
Financing live
Cash to close
- Down payment
- $35,000
- Closing costs
- $4,200
- Reserves months
- —
- Total cash needed
- —
Loan-product check · same deal, 3 products live
Conventional
25% down · 7.5% · 30yr
- Down + closing
- —
- Monthly P&I
- —
- Monthly cashflow
- —
- DSCR
- —
- Eligible?
- —
Personal DTI + credit; lowest rate.
DSCR
20% down · 8.5% · 30yr
- Down + closing
- —
- Monthly P&I
- —
- Monthly cashflow
- —
- DSCR
- —
- Eligible?
- —
No personal income docs; deal must DSCR.
Hard money
10% down · 12.0% · 12mo
- Down + closing
- —
- Monthly P&I
- —
- Monthly cashflow
- —
- DSCR
- —
- Eligible?
- —
Short-term bridge; refi at stabilization.
Listing history 20 events
-
2026-06-21days on market $140,000 Active 513 DOM
-
2026-06-19days on market $140,000 Active 511 DOM
-
2026-06-18days on market $140,000 Active 510 DOM
-
2026-06-17days on market $140,000 Active 509 DOM
-
2026-06-16days on market $140,000 Active 508 DOM
-
2026-06-15days on market $140,000 Active 507 DOM
-
2026-06-14days on market $140,000 Active 505 DOM
-
2026-06-13days on market $140,000 Active 504 DOM
-
2026-06-10days on market $140,000 Active 502 DOM
-
2026-06-09days on market $140,000 Active 501 DOM
-
2026-06-08days on market $140,000 Active 500 DOM
-
2026-06-07days on market $140,000 Active 499 DOM
-
2026-06-05days on market $140,000 Active 496 DOM
-
2026-06-03days on market $140,000 Active 495 DOM
-
2026-06-02days on market $140,000 Active 494 DOM
-
2026-06-01days on market $140,000 Active 493 DOM
-
2026-05-31days on market $140,000 Active 492 DOM
-
2026-05-30days on market $140,000 Active 491 DOM
-
2025-01-25$140,000 Active 213-char remark
Show marketing remark (213 chars)
This property has 3 units, 2 with 2 bedrooms and 1 bath, and 1 with 1 bedroom 1 bath. 2 unites already have tenants in place. Put your personal mark on this great investment. Call your REALTOR for a viewing today!
-
2025-01-24$140,000 Active 213-char remark
Show marketing remark (213 chars)
This property has 3 units, 2 with 2 bedrooms and 1 bath, and 1 with 1 bedroom 1 bath. 2 unites already have tenants in place. Put your personal mark on this great investment. Call your REALTOR for a viewing today!
ⓘ Source: listings_history table (triggers on properties + properties_extension) + one-shot
backfill from property_details.listing_events for pre-trigger history.
Climate risk First Street
- Flood 8/10 Severe FEMA zone AE · 98% chance over 30 yrs
- Wildfire 1/10 Low
- Heat 9/10 Extreme 7 d/yr ≥107°F today · 22 d/yr by 30 yrs out
- Wind 9/10 Extreme 99% chance of damaging wind over 30 yrs
- Air quality 1/10 Low 0 unhealthy d/yr today · 0 by 30 yrs out
Nearby sold comps map
Loading sold comps map…
Walkable amenities ~0.75 mi
Loading nearby amenities…
Taxation est. · year 1
- Rental income
- $43,608
- − Mortgage interest
- −$7,842
- − Property taxes
- −$2,100
- − Insurance
- −$5,818
- − Repairs & maintenance
- −$3,489
- − Management
- −$3,489
- − Depreciation
- −$4,073
- Taxable income
- $16,797
- Est. tax owed @ 24.0%
- −$4,031
- After-tax cash flow
- $13,690/yr
For passive investors: Depreciation is non-cash, so a rental often shows a tax loss while cash-flowing — sheltering income. Rental losses are passive: they offset passive income freely, and up to $25,000/yr can offset ordinary (W-2) income if you actively participate and your MAGI is under $100k (phasing out to $0 by $150k); unused losses carry forward. On sale, claimed depreciation is recaptured at up to 25%, and gains may owe capital-gains tax (a 1031 exchange can defer both). Figures are a year-1 estimate at your 24.0% rate — not tax advice; consult a CPA.
Condition & rehab AI · 3 photos
This multi-family property requires extensive repairs and maintenance to bring it up to a livable condition. Immediate focus should be on exterior siding, roof, and landscaping to improve its resale and rental value.
Repairs flagged
- Major exterior siding — Significant peeling and damage
- Major roof — Visible signs of wear and tear
- Major landscaping — Overgrown vegetation needs trimming
Value-add opportunities
- Both landscaping and exterior maintenance — Improves curb appeal and property value
- Both exterior siding and roof repairs — Essential for structural integrity and appearance
Renovation cost estimate screening
| Repair item | Severity | Est. cost |
|---|---|---|
| exterior siding · Significant peeling and damage | Major | $15,000–50,000 |
| roof · Visible signs of wear and tear | Major | $15,000–50,000 |
| landscaping · Overgrown vegetation needs trimming | Major | $15,000–50,000 |
| Total estimated repair cost · 3 items | $45,000–150,000 |
Value-add ROI direction
- Both landscaping and exterior maintenance — Improves curb appeal and property value ↑
- Both exterior siding and roof repairs — Essential for structural integrity and appearance ↑
ⓘ Cost ranges are severity-bucket heuristics (US national rule-of-thumb). Get contractor quotes + a written scope before underwriting a rehab budget.
Schools (NCES district)
- District
- Terrebonne Parish
- NCES district ID
- 2201740
- Math proficiency
- 32% ▼ -36.00%
- Reading proficiency
- 46% ▼ -30.00%
- Median HH income
- $47,612
- Composite
- 33.38/100
- National rank
- #5480
- State rank
- #23 of 98 in LA
Livability — Houma
- Score
- 64/100
- State rank
- #165
- US rank
- #13966
Category grades
Schools grade is shown separately in the Schools card above.
Census & demographics
- Census place
- Houma, LA
- County
- Terrebonne Parish · 57,290 people
- City population
- 57,290
- Metro
- Houma-Thibodaux, LA
- Population (ZIP)
- 28,716
- Household income
- $68,843
- Rent vs Own
- Severe rent burden
- 387.0
Population outlook (Terrebonne County) Hauer SSP2
- Today (2025)
- 118,724 people
- By 2030
- 120,321 · +1.3%
- By 2040
- 121,894 · +2.7%
- By 2050
- 121,119 · +2.0%
- By 2075
- 117,270 · -1.2%
- By 2100
- 107,544 · -9.4%
Race, ethnicity, and origin ACS 2023
- Neighborhood character
- Majority White (65%)
- Race & ethnicity
- White 65% Black 16% Hispanic / Latino 9% Two or more races 9% Native American 7% Asian 1%
- Hispanic origin (detail)
- Mexican 7% Puerto Rican 1%
- Common ancestry
- Lithuanian 17% Slovak 1% Serbian 1%
- Foreign-born
- 3% · Canada, Vietnam
- Languages at home
- 92% English-only · Spanish 4% French/Haitian/Cajun 2% Other Indo-European 1%
Political lean MEDSL · Terrebonne
- 2024 margin
- Solid R (+51.8) · D 23.5% · R 75.3% · Other 1.2%
- 2008→2024 swing
- -11.0pp toward R · 2008: -40.9pp · 2024: -51.8pp
- All cycles
- 2024: R+51.8 2020: R+50.0 2016: R+48.4 2012: R+41.2 2008: R+40.9
Not yet ingested
- Civics
- —
Market trends
- HPI YoY
- ▼ -99.75%
- Current HPI
- 113.1047
- Rent YoY
- —
- Metro
- Houma-Thibodaux, LA
- State GDP YoY
- ▲ 3.29%
- F500 in state
- 10
Industry mix (Fortune 500 HQ in LA)
| Industry | F500 HQs | Revenue |
|---|---|---|
| Telecommunications | 2 | $23B |
|
||
| Utilities | 1 | $12B |
|
||
| Wholesale / Distribution | 1 | $5B |
|
||
| Advertising | 1 | $2B |
|
||
Price history
+0.0% since first listed2 events — show timeline
- 2025-01-25 Listed $140,000 GBRMLS
- 2025-01-24 Listed $140,000 AcadianaMLS
Cash-flow waterfall
monthlySold comps — $/sqft
last 12 mo · ≤1 miLoading sold comps…