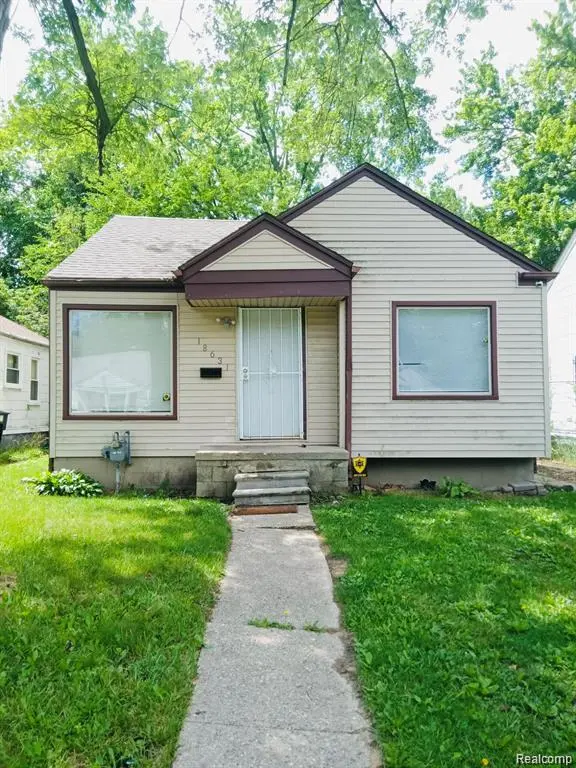
18631 Margareta St · Detroit, MI
Flood risk 1/10 · Minimal
- FEMA flood zone
- X (unshaded)
- Chance of flooding over 30 yrs
- 0.0%
- Est. flood insurance / yr
- $473 – $860
Fire risk 1/10 · Minimal
- Est. fire insurance / yr
- $784 – $1,456
Heat risk 3/10 · Minor
- Hot days now (above 98°F)
- 7 days/yr
- Hot days in 30 yrs
- 15 days/yr
Wind risk 2/10 · Minimal
- Chance of severe wind over 30 yrs
- —
Air-quality risk 3/10 · Minor
- Unhealthy air days now
- 2 days/yr
- Unhealthy air days in 30 yrs
- 5 days/yr
Risk factors via First Street. Map © Google.
Why this score? — see what drove the B- grade
The composite is a weighted blend of 9 inputs, each scored 0–100. Each bar is that input's sub-score; the figure is the points it added to the 100-point composite (weight × sub-score).
- Cash flow +30.0/30.0
- 1% rule +10.0/10.0
- DSCR +10.0/10.0
- ARV discount +6.0/15.0
- Rent growth +4.5/5.0
- Livability +3.7/5.0
- Condition / age +2.5/5.0
- Schools +1.3/10.0
- Appreciation +0.0/10.0
$69,000
🖨 Deal sheet (PDF) 📄 Offer letter ✓ Due diligence
Listing remarks MLS
A fantastic opportunity in a highly coveted location! This home - featuring 3 bedrooms, 1 bathroom, a kitchen, a living room, a dining room, a basement, and a parking space for one vehicle - boasts a comfortable layout. Don't let this opportunity slip away!
Key facts
- 4,792 sq ft lot
- Garage
- Built 1949
Property features AI
Exterior
- Parking: Detached garage (1 car) with side-facing garage
- Utilities: Public water; Sewer available
- Home design: Single-family residence; One level; Brick exterior
- Construction: Block foundation; Home warranty included
- Exterior features: Paved road access; Lot dimensions approximately 39 x 125 (0.11 acre); Pets not allowed
Interior
- Bedrooms: Total of 4 rooms (includes bedrooms and living spaces)
- Bathrooms: 1 full bathroom
- Heating & cooling: Forced air heating; Hot water heating; Natural gas fuel; No central cooling
- Interior features: Unfinished basement; Ground-level entry
Neighborhood map
What this means for you Summary
Snapshot
- This is a 3-bed/1.0-bath single-family listed at $69k.
Deal economics
- At list price, monthly cash flow is $614 ($7k/yr) — positive.
- The deal already cash-flows at list — no discount required.
- Meets the 1% rule at list price ($1k rent vs $69k).
- Recommended offer: $68k (1.5% below list) — sets the bar for market timing.
- Cap rate 17.0% vs local median 10.0% in Detroit — top-decile yield for the area; either an underpriced asset or a hidden risk that comps aren't pricing in. Stress-test before assuming the spread holds.
Location & tenants
- Location reads 73/100 on livability (#218 in MI) — a middle-class / working-renter tenant base. Strengths: amenities A+, commute A+, cost of living A+; Watch: schools F, crime F, employment F.
- Detroit Public Schools Community District (urban): math 10% / reading 24% proficiency, ranked #499 of 540 in MI (top 92%) — low school quality limits family demand, transient renter base, plan for 1-2y turnover; 90% free/reduced lunch — lower-income household profile, screen leases tightly.
- Market conditions: Rents rising fast (+8.0%/yr); 308 active listings in the ZIP; 40 comparable units currently listed for rent nearby; rentals at typical pace (median 18d on market — plan ~3-4 weeks tenant-placement turnaround); lower-income renter base — watch delinquency; 2,639 units permitted in Wayne County in 2024 (1,216 in 5+ unit buildings).
- This rent runs 38% of the median local income ($44k/yr) — at the standard rent-burdened threshold; future hikes will face affordability resistance.
Forward outlook
- Local home prices are declining (-3.0%/yr); year-one equity from $477 of loan paydown is wiped out by about $2k of value loss. Plan a longer hold.
- Wayne County population projected at -17% by 2050 — secular population decline; favor cash flow + early exit over multi-decade hold.
- At projected returns (-3.0% appreciation + 8.0% rent growth), your $19k cash investment doubles in ~3 years — after that, you're playing with house money.
Negotiation context
- It's been on market 17 days — a 2% lower offer ($68k) is reasonable based on typical stale-listing flexibility.
- 7 sale attempts; this cycle's ask has dropped $6k (8%) from the opening price — seller is motivated, your offer sets the floor, not the list.
Risks & watch-outs
- Watch-outs: built in 1949 — expect roof / HVAC / electrical / plumbing capex.
Questions for the listing agent
- Built in 1949 — when were the roof, HVAC, electrical panel, plumbing, and water heater last replaced?
- Is there a deadline driving the sale (1031 exchange, divorce, estate, relocation)? That informs how much negotiation room exists.
- Schools are F-rated, which usually means shorter tenancies and higher turnover. Who's the typical renter profile here, and what's been the actual vacancy rate?
- Crime grade is F in this area — have there been break-ins, vandalism, or insurance claims at this property in the last 3 years? What carrier currently insures it and at what premium?
- What's the average days-on-market for RENTAL listings here right now (not sales)? A rising rental-DOM trend means longer vacancies and softer asking-rent achievability than the comps imply.
- What's the recent tenant-quality profile in this submarket — average credit score on applications, eviction rate, late-payment / NSF rate, and stable-employment percentage? A property-management company in the area should have these aggregated.
- How much new for-sale + rental construction is in the pipeline within 1–3 miles? Heavy new supply typically softens prices + rents 12–24 months out; constrained supply supports both.
Investment metrics
- 1% rule
- 2.00% ✓
- Cap rate
- 16.97%
- Cash-on-cash
- 38.11%
- DSCR
- 2.70
- GRM
- 4.2
CMA / ARV
- ARV (median comp)
- $66,736
- List price
- $69,000
- Delta
- 3.39%
- Verdict
- FAIR
- Comps
- 20 within 1.0 mi
Show comp detail 12 sales within ~0.75 mi
| Address | Dist | Beds/Ba | Sqft | Sold | Price | $/sf | Match |
|---|---|---|---|---|---|---|---|
| 18631 Margareta St | 0.00mi | 3/1.0 | 950 (-1%) | 0mo | $62,000 | $65 | 98 |
| 18494 Ashton Ave | 0.31mi | 3/1.0 | 943 (-2%) | 2mo | $95,000 | $101 | 81 |
| 18555 Edinborough Rd | 0.44mi | 3/1.0 | 950 (-1%) | 2mo | $70,000 | $74 | 76 |
| 18937 Lindsay St | 0.64mi | 3/1.0 | 951 (-1%) | 2mo | $59,000 | $62 | 68 |
| 19352 Margareta St | 0.35mi | 3/1.0 | 1,060 (+11%) | 3mo | $105,000 | $99 | 64 |
| 19365 Fenmore St | 0.60mi | 3/1.0 | 912 (-5%) | 1mo | $94,900 | $104 | 63 |
| 19455 Avon Ave | 0.54mi | 3/1.0 | 1,023 (+7%) | 2mo | $72,000 | $70 | 61 |
| 17706 Stahelin Ave | 0.31mi | 3/1.0 | 818 (-15%) | 0mo | $106,000 | $130 | 61 |
| 18926 Ashton Ave | 0.32mi | 3/1.0 | 1,095 (+14%) | 3mo | $125,000 | $114 | 59 |
| 17511 Westmoreland Rd | 0.72mi | 3/2.0 | 939 (-2%) | 1mo | $100,000 | $106 | 58 |
| 18217 Archdale St | 0.51mi | 3/1.0 | 1,085 (+13%) | 0mo | $82,000 | $76 | 54 |
| 18418 Heyden St | 0.74mi | 2/1.0 (-1) | 865 (-10%) | 3mo | $17,000 | $20 | 42 |
Match score weights: distance 35% · size 25% · config 20% · recency 20%. Top-matched comps best support the ARV.
Projected returns pro-forma
-3.0% appreciation · 8.0% rent growth · sell at horizon
- IRR
- 39.8%
- Equity multiple
- 2.82×
- Total profit
- $35,218
- Equity at exit
- $10,288
- IRR
- 48.5%
- Equity multiple
- 6.92×
- Total profit
- $114,281
- Equity at exit
- $5,966
Cash invested: $19,320 (down + closing). Projections, not guarantees.
Landlord ↔ Tenant lean methodology
- Overall (STATE)
- 62 Landlord-Friendly
- State Michigan
- 62 Landlord-Friendly · EVEN
- County
- — inherits STATE
- City
- — inherits STATE
ZIP-level market 48219
- Home prices YoY
- -10.3%
- Rents YoY
- 8.0%
- Active inventory
- 308
- Price-to-rent
- 4.2×
Monthly cashflow live
- Estimated rent
- $1,380 high interval (Pro) →
- Mortgage (P&I)
- −$362
- Tax est. 1.5%
- −$86 /mo · $1,035/yr
- Insurance
- −$29
- HOA
- −$0
- Vacancy / Maint / Mgmt
- −$290
- Net cashflow
- $614
Break-even live
Sensitivity live
| Price | -10% $661 | -5% $637 | +0% $614 | +5% $590 | +10% $566 |
|---|---|---|---|---|---|
| Rent | -10% $505 | -5% $559 | +0% $614 | +5% $668 | +10% $723 |
| Rate | -1.0pp $648 | -0.5pp $631 | base $614 | +0.5pp $596 | +1.0pp $578 |
UW: 25.0% down · 7.5% · 30yr · 1.5% tax · 5.0% vac · 8.0% maint · 8.0% mgmt
Financing live
Cash to close
- Down payment
- $17,250
- Closing costs
- $2,070
- Reserves months
- —
- Total cash needed
- —
Loan-product check · same deal, 3 products live
Conventional
25% down · 7.5% · 30yr
- Down + closing
- —
- Monthly P&I
- —
- Monthly cashflow
- —
- DSCR
- —
- Eligible?
- —
Personal DTI + credit; lowest rate.
DSCR
20% down · 8.5% · 30yr
- Down + closing
- —
- Monthly P&I
- —
- Monthly cashflow
- —
- DSCR
- —
- Eligible?
- —
No personal income docs; deal must DSCR.
Hard money
10% down · 12.0% · 12mo
- Down + closing
- —
- Monthly P&I
- —
- Monthly cashflow
- —
- DSCR
- —
- Eligible?
- —
Short-term bridge; refi at stabilization.
Rent comps 40 comps
| Address | Beds | Baths | Sqft | Rent | $/sqft | DOM | Units | Dist |
|---|---|---|---|---|---|---|---|---|
| 18452 Shaftsbury Ave Detroit, MI | 3.0 | 1.0 | 927 | $1,500 | $1.62 | 18d | 1 | 0.23mi |
| 18659 Shaftsbury Ave Detroit, MI | 3.0 | 1.0 | 763 | $1,323 | $1.73 | 0d | 1 | 0.29mi |
| 18699 Shaftsbury Ave Detroit, MI | 2.0 | 1.0 | 800 | $1,000 | $1.25 | 45d | 1 | 0.30mi |
| 18494 Ashton Ave Detroit, MI | 3.0 | 1.0 | 1000 | $1,600 | $1.60 | 18d | 1 | 0.30mi |
| 17654 Sunderland Rd Detroit, MI | 3.0 | 1.0 | 1100 | $1,500 | $1.36 | 45d | 1 | 0.34mi |
| 18450 Edinborough Rd Detroit, MI | 3.0 | 1.0 | 1000 | $1,500 | $1.50 | 45d | 1 | 0.41mi |
| 19329 Stahelin Ave Unit 1 Detroit, MI | 3.0 | 1.5 | 833 | $1,250 | $1.50 | 45d | 1 | 0.45mi |
| 19176 Grandville Ave Detroit, MI | 3.0 | 1.0 | 941 | $1,300 | $1.38 | 6d | 1 | 0.46mi |
| 19445 Avon Ave Detroit, MI | 3.0 | 1.0 | 1023 | $1,550 | $1.52 | 45d | 1 | 0.57mi |
| 19372 Grandville Ave Detroit, MI | 2.0 | 1.5 | 733 | $1,025 | $1.40 | 0d | 1 | 0.58mi |
| 18276 Oakfield St Detroit, MI | 2.0 | 1.0 | 726 | $1,175 | $1.62 | 45d | 1 | 0.60mi |
| 18134 Vaughan St Detroit, MI | 3.0 | 1.0 | 1060 | $1,150 | $1.08 | 18d | 1 | 0.73mi |
| 19307 Lindsay St Detroit, MI | 2.0 | 1.0 | 900 | $1,100 | $1.22 | 0d | 1 | 0.73mi |
| 18461 Heyden St Detroit, MI | 2.0 | 1.0 | 1000 | $1,050 | $1.05 | 6d | 1 | 0.76mi |
| 18191 Heyden St Detroit, MI | 2.0 | 1.0 | 917 | $1,100 | $1.20 | 25d | 1 | 0.78mi |
| 18556 Kentfield St Detroit, MI | 3.0 | 1.0 | 952 | $1,250 | $1.31 | 4d | 1 | 0.79mi |
| 19818 Fenmore St Detroit, MI | 3.0 | 1.0 | 902 | $1,275 | $1.41 | 45d | 1 | 0.86mi |
| 19457 Evergreen Rd Detroit, MI | 2.0 | 1.0 | 1100 | $1,200 | $1.09 | 45d | 1 | 0.88mi |
| 19918 Southfield Fwy Detroit, MI | 3.0 | 1.0 | 915 | $1,375 | $1.50 | 16d | 1 | 0.88mi |
| 18205 Stout St Detroit, MI | 3.0 | 1.0 | 901 | $1,078 | $1.20 | 25d | 1 | 0.90mi |
| 20011 Avon Ave Detroit, MI | 3.0 | 1.0 | 1000 | $1,200 | $1.20 | 6d | 1 | 0.90mi |
| 18274 Fielding St Detroit, MI | 2.0 | 1.0 | 700 | $1,200 | $1.71 | 18d | 1 | 0.92mi |
| 19970 Ashton Ave Detroit, MI | 3.0 | 1.0 | 1000 | $1,000 | $1.00 | 45d | 1 | 0.92mi |
| 17573 Asbury Park Detroit, MI | 3.0 | 2.0 | 990 | $1,400 | $1.41 | 0d | 1 | 0.92mi |
| 20068 Faust Ave Detroit, MI | 2.0 | 1.0 | 750 | $1,100 | $1.47 | 25d | 1 | 0.96mi |
| 19736 Gilchrist St Detroit, MI | 2.0 | 1.0 | 696 | $995 | $1.43 | 14d | 1 | 0.97mi |
| 20043 Fenmore St Detroit, MI | 3.0 | 1.0 | 1030 | $1,423 | $1.38 | 0d | 1 | 1.02mi |
| 18268 Mansfield St Detroit, MI | 2.0 | 1.0 | 800 | $1,200 | $1.50 | 18d | 1 | 1.04mi |
| 18400 Rutherford St Detroit, MI | 3.0 | 1.0 | 1050 | $1,400 | $1.33 | 5d | 1 | 1.09mi |
| 20271 Grandville Ave Detroit, MI | 3.0 | 1.0 | 1010 | $1,550 | $1.53 | 25d | 1 | 1.14mi |
| 20527 Rosemont Ave Detroit, MI | 2.0 | 2.0 | 975 | $1,528 | $1.57 | 45d | 1 | 1.18mi |
| 19781 Fielding St Detroit, MI | 3.0 | 1.0 | 1000 | $1,294 | $1.29 | 6d | 1 | 1.18mi |
| 20259 Oakfield St Detroit, MI | 3.0 | 1.0 | 1056 | $1,250 | $1.18 | 18d | 1 | 1.20mi |
| 19467 Rutherford St Detroit, MI | 3.0 | 1.0 | 1002 | $1,200 | $1.20 | 18d | 1 | 1.21mi |
| 20203 Gilchrist St Detroit, MI | 3.0 | 1.0 | 1031 | $1,250 | $1.21 | 6d | 1 | 1.21mi |
| 18437 Trinity St Detroit, MI | 3.0 | 1.0 | 875 | $1,364 | $1.56 | 16d | 1 | 1.22mi |
| 19440 Rutherford St Detroit, MI | 3.0 | 1.0 | 1000 | $1,400 | $1.40 | 25d | 1 | 1.22mi |
| 20210 Biltmore St Detroit, MI | 3.0 | 1.0 | 1033 | $1,350 | $1.31 | 25d | 1 | 1.27mi |
| 17165 Prevost St Detroit, MI | 3.0 | 1.0 | 1060 | $2,400 | $2.26 | 3d | 1 | 1.30mi |
| 20314 Gilchrist St Detroit, MI | 3.0 | 1.0 | 1042 | $1,500 | $1.44 | 6d | 1 | 1.32mi |
Listing history 15 events
-
2026-05-12price $69,000 257-char remark
Show marketing remark (257 chars)
A fantastic opportunity in a highly coveted location! This home - featuring 3 bedrooms, 1 bathroom, a kitchen, a living room, a dining room, a basement, and a parking space for one vehicle - boasts a comfortable layout. Don't let this opportunity slip away!
-
2026-05-11price $69,000 265-char remark
-
2026-05-04$75,000 Active 257-char remark
Show marketing remark (257 chars)
A fantastic opportunity in a highly coveted location! This home - featuring 3 bedrooms, 1 bathroom, a kitchen, a living room, a dining room, a basement, and a parking space for one vehicle - boasts a comfortable layout. Don't let this opportunity slip away!
-
2026-05-04$75,000 Active 265-char remark
Show marketing remark (257 chars)
A fantastic opportunity in a highly coveted location! This home - featuring 3 bedrooms, 1 bathroom, a kitchen, a living room, a dining room, a basement, and a parking space for one vehicle - boasts a comfortable layout. Don't let this opportunity slip away!
-
2026-04-29historical
-
2026-04-29historical
-
2026-04-28$1,300
-
2026-04-27$59,900 Active
-
2026-04-27$59,900 Active
-
2026-03-20historical
-
2026-03-20historical
-
2025-08-02$85,000 Active
-
2025-08-02$85,000 Active
-
2021-03-15soldstatus $78,900
-
2021-02-10soldstatus $69,900
ⓘ Source: listings_history table (triggers on properties + properties_extension) + one-shot
backfill from property_details.listing_events for pre-trigger history.
Climate risk First Street
- Flood 1/10 Low FEMA zone X (unshaded) · 0% chance over 30 yrs
- Wildfire 1/10 Low
- Heat 3/10 Moderate 7 d/yr ≥98°F today · 15 d/yr by 30 yrs out
- Wind 2/10 Low
- Air quality 3/10 Moderate 2 unhealthy d/yr today · 5 by 30 yrs out
Nearby sold comps map
Loading sold comps map…
Walkable amenities ~0.75 mi
Loading nearby amenities…
Taxation est. · year 1
- Rental income
- $16,564
- − Mortgage interest
- −$3,865
- − Property taxes
- −$1,035
- − Insurance
- −$345
- − Repairs & maintenance
- −$1,325
- − Management
- −$1,325
- − Depreciation
- −$2,007
- Taxable income
- $6,662
- Est. tax owed @ 24.0%
- −$1,599
- After-tax cash flow
- $5,765/yr
For passive investors: Depreciation is non-cash, so a rental often shows a tax loss while cash-flowing — sheltering income. Rental losses are passive: they offset passive income freely, and up to $25,000/yr can offset ordinary (W-2) income if you actively participate and your MAGI is under $100k (phasing out to $0 by $150k); unused losses carry forward. On sale, claimed depreciation is recaptured at up to 25%, and gains may owe capital-gains tax (a 1031 exchange can defer both). Figures are a year-1 estimate at your 24.0% rate — not tax advice; consult a CPA.
Schools (NCES district)
- District
- Detroit Public Schools Community District
- NCES district ID
- 2601103
- Math proficiency
- 10% ▼ -2.00%
- Reading proficiency
- 24% ▲ 6.00%
- Median HH income
- $25,815
- Composite
- 13.06/100
- National rank
- #9564
- State rank
- #499 of 540 in MI
Livability — Detroit
- Score
- 73/100
- State rank
- #218
- US rank
- #5427
Category grades
Schools grade is shown separately in the Schools card above.
Census & demographics
- Census place
- Detroit, MI
- County
- Wayne County · 1,562,939 people
- City population
- 572,865
- Metro
- Detroit-Warren-Dearborn, MI
- Population (ZIP)
- 47,208
- Household income
- $43,655
- Rent vs Own
- Severe rent burden
- 3584.0
Population outlook (Wayne County) Hauer SSP2
- Today (2025)
- 1,675,273 people
- By 2030
- 1,620,300 · -3.3%
- By 2040
- 1,502,341 · -10.3%
- By 2050
- 1,384,039 · -17.4%
- By 2075
- 1,124,592 · -32.9%
- By 2100
- 881,193 · -47.4%
Race, ethnicity, and origin ACS 2023
- Neighborhood character
- Predominantly Black (88%)
- Race & ethnicity
- Black 88% White 5% Two or more races 4% Hispanic / Latino 1%
- Common ancestry
- Romanian 1% Lithuanian 1%
- Foreign-born
- 2% · Canada
- Languages at home
- 96% English-only · Spanish 1% French/Haitian/Cajun 1%
Political lean MEDSL · Wayne
- 2024 margin
- Strong D (+29.0) · D 62.7% · R 33.7% · Other 3.6%
- 2008→2024 swing
- -20.5pp toward R · 2008: 49.5pp · 2024: 29.0pp
- All cycles
- 2024: D+29.0 2020: D+38.1 2016: D+37.3 2012: D+46.9 2008: D+49.5
Not yet ingested
- Civics
- —
Market trends
- HPI YoY
- ▼ -65.06%
- Current HPI
- 563.3263
- Rent YoY
- ▲ 8.04%
- Metro
- Detroit-Warren-Dearborn, MI
- State GDP YoY
- ▲ 1.37%
- F500 in state
- 28
Industry mix (Fortune 500 HQ in MI)
| Industry | F500 HQs | Revenue |
|---|---|---|
| Automotive Parts | 3 | $48B |
|
||
| Automotive | 2 | $372B |
|
||
| Chemicals | 1 | $45B |
|
||
| Automotive Retail | 1 | $29B |
|
||
| Healthcare / Medical Devices | 1 | $23B |
|
||
| Automotive Technology | 1 | $20B |
|
||
Price history
-11.3% since first listed20 events — show timeline
- 2026-06-11 Sold (MLS) $62,000 REALCOMP
- 2026-06-11 Sold (MLS) $62,000 MiRealSource-MiMLS
- 2026-05-21 Rental Removed $1,300 REALSOURCE
- 2026-05-21 Pending — MiRealSource-MiMLS
- 2026-05-21 Pending — REALCOMP
- 2026-05-12 Price Changed $69,000 MiRealSource-MiMLS
- 2026-05-11 Price Changed $69,000 REALCOMP
- 2026-05-04 Listed $75,000 REALCOMP
- 2026-05-04 Listed $75,000 MiRealSource-MiMLS
- 2026-04-29 Listing Removed — REALCOMP
- 2026-04-29 Listing Removed — MiRealSource-MiMLS
- 2026-04-28 Listed for Rent $1,300 REALSOURCE
- 2026-04-27 Listed $59,900 REALCOMP
- 2026-04-27 Listed $59,900 MiRealSource-MiMLS
- 2026-03-20 Listing Removed — MiRealSource-MiMLS
- 2026-03-20 Listing Removed — REALCOMP
- 2025-08-02 Listed $85,000 REALCOMP
- 2025-08-02 Listed $85,000 MiRealSource-MiMLS
- 2021-03-15 Sold (Public Records) $78,900 Public Records
- 2021-02-10 Sold (Public Records) $69,900 Public Records
Property tax history
+9.5%/yrLatest (2025): $4,626 · +97.8% YoY. Source: county tax records.
Cash-flow waterfall
monthlySold comps — $/sqft
last 12 mo · ≤1 miLoading sold comps…