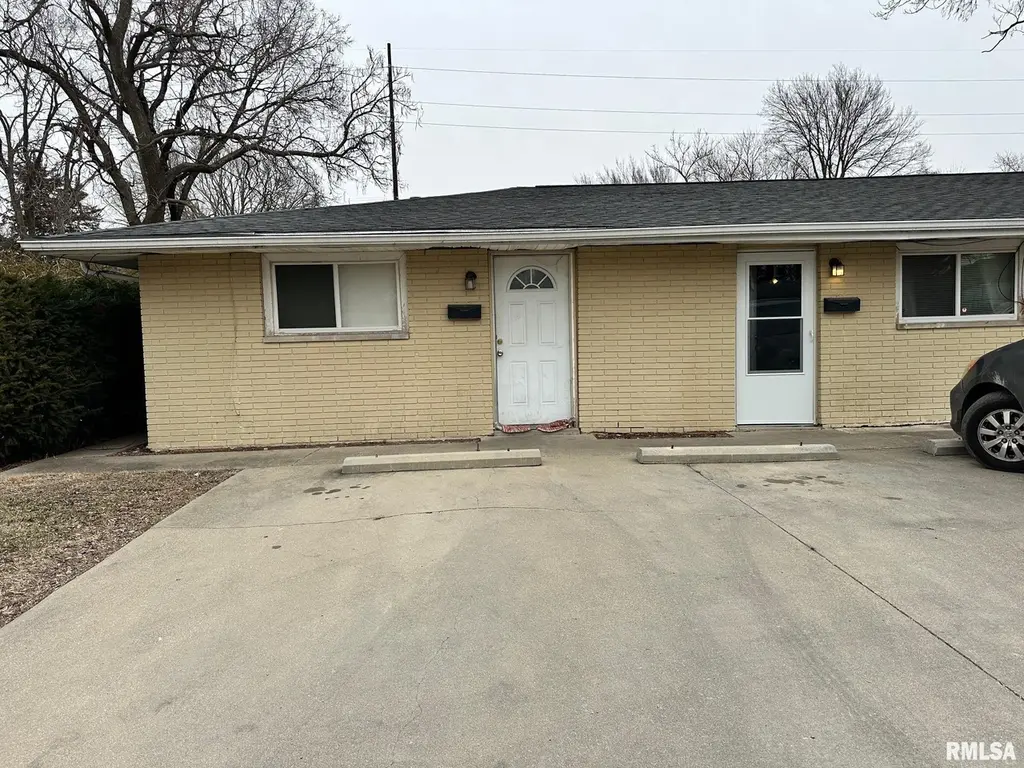
 6-Plex
1546 E Cornell St · Springfield, IL
Flood risk No data
- FEMA flood zone
- —
- Chance of flooding over 30 yrs
- —
- Est. flood insurance / yr
- —
Fire risk No data
- Est. fire insurance / yr
- —
Heat risk No data
- Hot days now (above threshold)
- —
- Hot days in 30 yrs
- —
Wind risk No data
- Chance of severe wind over 30 yrs
- —
Air-quality risk No data
- Unhealthy air days now
- —
- Unhealthy air days in 30 yrs
- —
Risk factors via First Street. Map © Google.
Why this score? — see what drove the D- grade
The composite is a weighted blend of 9 inputs, each scored 0–100. Each bar is that input's sub-score; the figure is the points it added to the 100-point composite (weight × sub-score).
- Cash flow +15.0/30.0
- 1% rule +5.0/10.0
- DSCR +5.0/10.0
- Rent growth +5.0/5.0
- Livability +4.0/5.0
- Condition / age +2.5/5.0
- Schools +1.7/10.0
- ARV discount +1.6/15.0
- Appreciation +0.0/10.0
$160,000
🖨 Deal sheet (PDF) 📄 Offer letter ✓ Due diligence
Multi-family units
County records classify this as Multi-Family (5+ Unit). Listing-text estimate: 6 units. confirmed
5+ unit building — per-unit beds/baths from public records are typically unavailable; the breakdown below (if shown) is an estimate from the listing text.
Listing remarks MLS
All brick 6 unit 1 story apartment building. Individual electric meters. All units occupied and being sold As Is. Tenants pay electric and gas. House meter for water and sewer pay by landlord.
Key facts
- 9,750 sq ft lot
- 6 parking spots
- Built 1968
Neighborhood map
What this means for you Summary
Snapshot
- This is a 6 × 4-bed/4.0-bath units multifamily listed at $160k.
Deal economics
- At list price, monthly cash flow is $5k ($66k/yr) — positive. Per door: $914/mo.
- The deal already cash-flows at list — no discount required.
- Meets the 1% rule at list price ($8k rent vs $160k).
- Recommended offer: $150k (6.0% below list) — sets the bar for market timing.
- Cap rate 47.4% vs local median 4.9% in Springfield — top-decile yield for the area; either an underpriced asset or a hidden risk that comps aren't pricing in. Stress-test before assuming the spread holds.
Location & tenants
- Location reads 79/100 on livability (#122 in IL, #2,138 nationally) — a middle-class / working-renter tenant base. Strengths: amenities A+, commute A+, cost of living A+; Watch: crime F.
- Springfield SD 186 (urban): math 17% / reading 22% proficiency, ranked #438 of 620 in IL (top 71%) — low school quality limits family demand, transient renter base, plan for 1-2y turnover; 64% free/reduced lunch — lower-income household profile, screen leases tightly.
- Zoned schools: Harvard Park Elem School (math 2% / reading 2%, grade F, #1,927 of 2,056 statewide, top 100%, 346 students, 0% FRL); Jefferson Middle School (math 3% / reading 8%, grade F, #635 of 665 statewide, top 95%, 539 students, 0% FRL); Springfield Southeast High Sch (math 17% / reading 22%, grade F, #397 of 693 statewide, top 61%, 1,261 students, 0% FRL) — zoned schools average 0% FRL vs 64% district-wide (64 pts lower); this property's tenant base skews higher-income than the district average.
- Market conditions: Rents rising fast (+12.2%/yr); 109 active listings in the ZIP; 225 units permitted in Sangamon County in 2024 (48 in 5+ unit buildings).
- At $8,339/mo this rent would consume 222% of the median local household income ($45k/yr) (locally 1626% of renters already pay >50% of income on rent) — very limited rent-growth headroom before tenants either downsize or default.
Forward outlook
- Local home prices are declining (-3.0%/yr); year-one equity from $1k of loan paydown is wiped out by about $5k of value loss. Plan a longer hold.
- Sangamon County population projected to shrink 9% by 2050 — rents likely to lag national; underwrite the cash flow, not the appreciation.
- At projected returns (-3.0% appreciation + 8.0% rent growth), your $45k cash investment doubles in ~1 year — after that, you're playing with house money.
Negotiation context
- It's been on market 83 days — a 6% lower offer ($150k) is reasonable based on typical stale-listing flexibility.
- 4 sale attempts since 27y ago with the ask held roughly flat each time — persistent listings suggest the price (not the market) is what's stuck; bring a comps-based counter.
- Current owner paid $38k; list at $160k implies a 321% gain — meaningful room to come down on a strong offer.
Questions for the listing agent
- It's been on market 83 days. Have you received any prior offers? Is the seller open to a 6% concession, seller financing, or rate buy-down credit?
- Can we see the unit-by-unit rent roll, current vacancy, and any below-market leases? What's the average tenancy length?
- What capital expenditures (roof, boiler, parking lot, exteriors) have been made in the last 5 years, and what's planned in the next 2?
- Built in 1968 — when were the roof, HVAC, electrical panel, plumbing, and water heater last replaced?
- Why hasn't it sold? Are there any deal-killer items the seller is aware of (foundation, flood, title, zoning, code violations)?
- Is there a deadline driving the sale (1031 exchange, divorce, estate, relocation)? That informs how much negotiation room exists.
- Schools are D-rated, which usually means shorter tenancies and higher turnover. Who's the typical renter profile here, and what's been the actual vacancy rate?
- Crime grade is F in this area — have there been break-ins, vandalism, or insurance claims at this property in the last 3 years? What carrier currently insures it and at what premium?
- The area grade is low — what's the realistic commute time and amenity access for the typical tenant pool here? Any planned neighborhood developments (good or bad) we should know about?
- What's the average days-on-market for RENTAL listings here right now (not sales)? A rising rental-DOM trend means longer vacancies and softer asking-rent achievability than the comps imply.
- What's the recent tenant-quality profile in this submarket — average credit score on applications, eviction rate, late-payment / NSF rate, and stable-employment percentage? A property-management company in the area should have these aggregated.
- How much new apartment / multifamily construction is in the pipeline within 1–3 miles? Heavy new supply (>2% of stock underway) typically softens rents 12–24 months out; light construction supports rent growth.
Investment metrics
- 1% rule
- 5.21% ✓
- Cap rate
- 47.41%
- Cash-on-cash
- 146.84%
- DSCR
- 7.53
- GRM
- 1.6
CMA / ARV
- ARV (median comp)
- $141,554
- List price
- $160,000
- Delta
- 13.03%
- Verdict
- OVERPRICED
- Comps
- 20 within 2.0 mi
Projected returns pro-forma
-3.0% appreciation · 8.0% rent growth · sell at horizon
- IRR
- —
- Equity multiple
- 9.20×
- Total profit
- $367,426
- Equity at exit
- $23,857
- IRR
- —
- Equity multiple
- 22.67×
- Total profit
- $970,634
- Equity at exit
- $13,834
Cash invested: $44,800 (down + closing). Projections, not guarantees.
Landlord ↔ Tenant lean methodology
- Overall (STATE)
- 43 Moderately Tenant-Leaning
- State Illinois
- 43 Moderately Tenant-Leaning · D+7
- County
- — inherits STATE
- City
- — inherits STATE
ZIP-level market 62703
- Home prices YoY
- -28.9%
- Rents YoY
- 12.2%
- Active inventory
- 109
- Price-to-rent
- 9.6×
Monthly cashflow live
- Estimated rent
- $8,339 medium interval (Pro) →
- Mortgage (P&I)
- −$839
- Tax est. 1.5%
- −$200 /mo · $2,400/yr
- Insurance
- −$67
- HOA
- −$0
- Lot rent
- −$0
- Vacancy / Maint / Mgmt
- −$1,751
- Net cashflow
- $5,482
Break-even live
Sensitivity live
| Price | -10% $5,593 | -5% $5,537 | +0% $5,482 | +5% $5,427 | +10% $5,372 |
|---|---|---|---|---|---|
| Rent | -10% $4,823 | -5% $5,153 | +0% $5,482 | +5% $5,811 | +10% $6,141 |
| Rate | -1.0pp $5,563 | -0.5pp $5,523 | base $5,482 | +0.5pp $5,441 | +1.0pp $5,398 |
6-unit breakdown (identical units grouped — click to expand)
| Units | Beds | Baths | Est. rent |
|---|---|---|---|
| 6× units | 4 | 4 | $8,340 |
| #1 | 4 | 4 | $1,390 |
| #2 | 4 | 4 | $1,390 |
| #3 | 4 | 4 | $1,390 |
| #4 | 4 | 4 | $1,390 |
| #5 | 4 | 4 | $1,390 |
| #6 | 4 | 4 | $1,390 |
| Total (6 units) | $8,339 | ||
UW: 25.0% down · 7.5% · 30yr · 1.5% tax · 5.0% vac · 8.0% maint · 8.0% mgmt
Financing live
Cash to close
- Down payment
- $40,000
- Closing costs
- $4,800
- Reserves months
- —
- Total cash needed
- —
Loan-product check · same deal, 3 products live
Conventional
25% down · 7.5% · 30yr
- Down + closing
- —
- Monthly P&I
- —
- Monthly cashflow
- —
- DSCR
- —
- Eligible?
- —
Personal DTI + credit; lowest rate.
DSCR
20% down · 8.5% · 30yr
- Down + closing
- —
- Monthly P&I
- —
- Monthly cashflow
- —
- DSCR
- —
- Eligible?
- —
No personal income docs; deal must DSCR.
Hard money
10% down · 12.0% · 12mo
- Down + closing
- —
- Monthly P&I
- —
- Monthly cashflow
- —
- DSCR
- —
- Eligible?
- —
Short-term bridge; refi at stabilization.
Listing history 27 events
-
2026-06-23days on market $160,000 Active 83 DOM
-
2026-06-22days on market $160,000 Active 82 DOM
-
2026-06-19days on market $160,000 Active 80 DOM
-
2026-06-18days on market $160,000 Active 79 DOM
-
2026-06-17days on market $160,000 Active 78 DOM
-
2026-06-16days on market $160,000 Active 77 DOM
-
2026-06-15days on market $160,000 Active 76 DOM
-
2026-06-14days on market $160,000 Active 74 DOM
-
2026-06-13days on market $160,000 Active 73 DOM
-
2026-06-10days on market $160,000 Active 71 DOM
-
2026-06-09days on market $160,000 Active 70 DOM
-
2026-06-08days on market $160,000 Active 69 DOM
-
2026-06-07days on market $160,000 Active 68 DOM
-
2026-06-05days on market $160,000 Active 65 DOM
-
2026-06-03days on market $160,000 Active 64 DOM
-
2026-06-02days on market $160,000 Active 63 DOM
-
2026-06-01days on market $160,000 Active 62 DOM
-
2026-05-31days on market $160,000 Active 61 DOM
-
2026-05-30days on market $160,000 Active 60 DOM
-
2026-03-31$160,000 Active 195-char remark
Show marketing remark (195 chars)
All brick 6 unit 1 story apartment building. Individual electric meters. All units occupied and being sold As Is. Tenants pay electric and gas. House meter for water and sewer pay by landlord.
-
2021-08-06historical
-
2009-09-16soldstatus $38,000
-
2009-05-08$45,000
-
2004-02-03soldstatus $30,750
-
2003-11-24$39,900
-
1999-10-04soldstatus $128,500
-
1999-03-15$130,000
ⓘ Source: listings_history table (triggers on properties + properties_extension) + one-shot
backfill from property_details.listing_events for pre-trigger history.
Nearby sold comps map
Loading sold comps map…
Walkable amenities ~0.75 mi
Loading nearby amenities…
Taxation est. · year 1
- Rental income
- $100,068
- − Mortgage interest
- −$8,962
- − Property taxes
- −$2,400
- − Insurance
- −$800
- − Repairs & maintenance
- −$8,005
- − Management
- −$8,005
- − Depreciation
- −$4,655
- Taxable income
- $67,240
- Est. tax owed @ 24.0%
- −$16,138
- After-tax cash flow
- $49,647/yr
For passive investors: Depreciation is non-cash, so a rental often shows a tax loss while cash-flowing — sheltering income. Rental losses are passive: they offset passive income freely, and up to $25,000/yr can offset ordinary (W-2) income if you actively participate and your MAGI is under $100k (phasing out to $0 by $150k); unused losses carry forward. On sale, claimed depreciation is recaptured at up to 25%, and gains may owe capital-gains tax (a 1031 exchange can defer both). Figures are a year-1 estimate at your 24.0% rate — not tax advice; consult a CPA.
Schools (NCES district)
- District
- Springfield SD 186
- NCES district ID
- 1737080
- Math proficiency
- 17% ▼ -7.00%
- Reading proficiency
- 22% ▼ -5.00%
- Median HH income
- $43,744
- Composite
- 16.89/100
- National rank
- #9142
- State rank
- #438 of 620 in IL
Livability — Springfield
- Score
- 79/100
- State rank
- #122
- US rank
- #2138
Category grades
Schools grade is shown separately in the Schools card above.
Census & demographics
- Census place
- Springfield, IL
- County
- Sangamon County · 115,414 people
- City population
- 59,955
- Metro
- Springfield, IL
- Population (ZIP)
- 28,922
- Household income
- $45,009
- Rent vs Own
- Severe rent burden
- 1626.0
Population outlook (Sangamon County) Hauer SSP2
- Today (2025)
- 198,317 people
- By 2030
- 196,127 · -1.1%
- By 2040
- 188,664 · -4.9%
- By 2050
- 179,624 · -9.4%
- By 2075
- 155,027 · -21.8%
- By 2100
- 122,588 · -38.2%
Race, ethnicity, and origin ACS 2023
- Neighborhood character
- Diverse neighborhood (Simpson 0.59)
- Race & ethnicity
- White 53% Black 35% Two or more races 7% Hispanic / Latino 5%
- Common ancestry
- Lithuanian 2% Romanian 2% Italian 1%
- Foreign-born
- 3% · Canada
- Languages at home
- 95% English-only · Spanish 3% Arabic 1%
Political lean MEDSL · Sangamon
- 2024 margin
- Toss-up / Even · D 46.6% · R 51.6% · Other 1.8%
- 2008→2024 swing
- -9.3pp toward R · 2008: 4.4pp · 2024: -5.0pp
- All cycles
- 2024: R+5.0 2020: R+4.4 2016: R+9.4 2012: R+8.7 2008: D+4.4
Not yet ingested
- Civics
- —
Market trends
- HPI YoY
- ▼ -59.69%
- Current HPI
- 147.0877
- Rent YoY
- ▲ 12.19%
- Metro
- Springfield, IL
- State GDP YoY
- ▲ 1.59%
- F500 in state
- 60
Industry mix (Fortune 500 HQ in IL)
| Industry | F500 HQs | Revenue |
|---|---|---|
| Insurance | 4 | $201B |
|
||
| Consumer Goods | 4 | $87B |
|
||
| Industrial Machinery | 3 | $64B |
|
||
| Healthcare | 2 | $55B |
|
||
| Retail / Pharmacy | 1 | $148B |
|
||
| Agriculture / Food | 1 | $86B |
|
||
Price history
+23.1% since first listed8 events — show timeline
- 2026-03-31 Listed $160,000 RMLSA as Distributed by MLS Grid
- 2021-08-06 Listing Removed — RMLSA as Distributed by MLS Grid
- 2009-09-16 Sold (MLS) $38,000 RMLSA as Distributed by MLS Grid
- 2009-05-08 Listed $45,000 RMLSA as Distributed by MLS Grid
- 2004-02-03 Sold (MLS) $30,750 RMLSA as Distributed by MLS Grid
- 2003-11-24 Listed $39,900 RMLSA as Distributed by MLS Grid
- 1999-10-04 Sold (MLS) $128,500 RMLSA as Distributed by MLS Grid
- 1999-03-15 Listed $130,000 RMLSA as Distributed by MLS Grid
Cash-flow waterfall
monthlySold comps — $/sqft
last 12 mo · ≤1 miLoading sold comps…