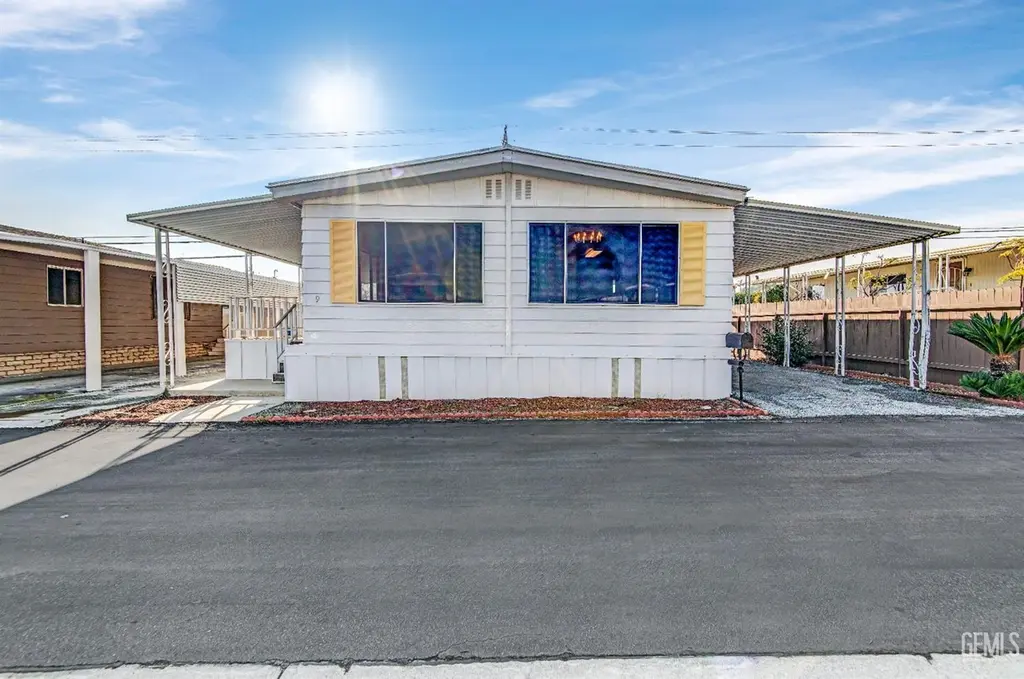
9 Tee Ln · Oildale, CA
Flood risk 1/10 · Minimal
- FEMA flood zone
- X (unshaded)
- Chance of flooding over 30 yrs
- 0.0%
- Est. flood insurance / yr
- $507 – $1,088
Fire risk 6/10 · Moderate
- Est. fire insurance / yr
- $659 – $1,223
Heat risk 8/10 · Major
- Hot days now (above 104°F)
- 5 days/yr
- Hot days in 30 yrs
- 12 days/yr
Wind risk 1/10 · Minimal
- Chance of severe wind over 30 yrs
- —
Air-quality risk 10/10 · Severe
- Unhealthy air days now
- 39 days/yr
- Unhealthy air days in 30 yrs
- 45 days/yr
Risk factors via First Street. Map © Google.
Why this score? — see what drove the B+ grade
The composite is a weighted blend of 9 inputs, each scored 0–100. Each bar is that input's sub-score; the figure is the points it added to the 100-point composite (weight × sub-score).
- Cash flow +30.0/30.0
- ARV discount +15.0/15.0
- 1% rule +10.0/10.0
- DSCR +10.0/10.0
- Rent growth +3.1/5.0
- Livability +2.9/5.0
- Appreciation +2.7/10.0
- Condition / age +2.5/5.0
- Schools +2.1/10.0
$45,000
🖨 Deal sheet 📄 Offer letter ✓ Due diligence
Listing remarks MLS
Welcome to a beautiful opportunity in the Highland Knolls Mobile Estates 55+ community with an updated water heater! This inviting home features a spacious great room with soft carpet and abundant natural light, creating a warm and comfortable setting for everyday living. The kitchen offers generous storage and functionality, while the dining/bonus room is perfect for hosting gatherings or enjoying hobbies. Retreat to the extremely large primary suite, complete with a roomy closet and private restroom for added comfort. Outside, enjoy the convenience of a storage shed, covered patio, and grassy area ideal for relaxing or entertaining. With a some cosmetic touches, this home can truly shine - don't miss your chance to make it your own. Schedule your private showing today!
Key facts
- Spacious great room
- Generous storage
- Roomy closet
Tags
Neighborhood map
What this means for you Summary
Snapshot
- This is a 3-bed/2.0-bath manufactured listed at $45k.
Deal economics
- At list price, monthly cash flow is $1k ($13k/yr) — positive.
- The deal already cash-flows at list — no discount required.
- Meets the 1% rule at list price ($2k rent vs $45k).
- Recommended offer: $40k (12.0% below list) — sets the bar for market timing.
- Cap rate 34.7% vs local median 3.9% in Oildale — top-decile yield for the area; either an underpriced asset or a hidden risk that comps aren't pricing in. Stress-test before assuming the spread holds.
Location & tenants
- Location reads 58/100 on livability (#680 in CA) — a working-class tenant base; expect higher turnover. Strengths: housing A+, schools B+; Watch: crime F, amenities F, commute F.
- Standard Elementary (suburban): math 16% / reading 27% proficiency, ranked #1,227 of 1,400 in CA (top 88%) — low school quality limits family demand, transient renter base, plan for 1-2y turnover; 66% free/reduced lunch — lower-income household profile, screen leases tightly.
- Market conditions: Rents rising (+2.2%/yr); 307 active listings in the ZIP; 24 comparable units currently listed for rent nearby; rentals leasing fast (median 3d on market — plan ~1-2 weeks tenant-placement turnaround); 3,244 units permitted in Kern County in 2024 (73 in 5+ unit buildings).
- This rent runs 33% of the median local income ($62k/yr) — at the standard rent-burdened threshold; future hikes will face affordability resistance.
Forward outlook
- Local home prices are declining (-3.0%/yr); year-one equity from $311 of loan paydown is wiped out by about $1k of value loss. Plan a longer hold.
- Kern County population projected at +17% by 2050 — long-run rental-demand tailwind backs the buy-and-hold thesis.
- At projected returns (-3.0% appreciation + 2.2% rent growth), your $13k cash investment doubles in ~2 years — after that, you're playing with house money.
Negotiation context
- It's been on market 153 days — a 12% lower offer ($40k) is reasonable based on typical stale-listing flexibility.
Risks & watch-outs
- Climate carrying-cost: major wildfire risk; extreme-heat days projected 5→12/yr by 2055 (HVAC capex compounding) — expect insurance premiums to compound above CPI over the hold.
Questions for the listing agent
- It's been on market 153 days. Have you received any prior offers? Is the seller open to a 12% concession, seller financing, or rate buy-down credit?
- Built in 1973 — when were the roof, HVAC, electrical panel, plumbing, and water heater last replaced?
- Why hasn't it sold? Are there any deal-killer items the seller is aware of (foundation, flood, title, zoning, code violations)?
- Is there a deadline driving the sale (1031 exchange, divorce, estate, relocation)? That informs how much negotiation room exists.
- Schools are B-rated — typically a magnet for longer-tenancy family renters. What's the average tenant stay here, and is there a school-zone premium baked into asking?
- Crime grade is F in this area — have there been break-ins, vandalism, or insurance claims at this property in the last 3 years? What carrier currently insures it and at what premium?
- What's the average days-on-market for RENTAL listings here right now (not sales)? A rising rental-DOM trend means longer vacancies and softer asking-rent achievability than the comps imply.
- What's the recent tenant-quality profile in this submarket — average credit score on applications, eviction rate, late-payment / NSF rate, and stable-employment percentage? A property-management company in the area should have these aggregated.
- How much new for-sale + rental construction is in the pipeline within 1–3 miles? Heavy new supply typically softens prices + rents 12–24 months out; constrained supply supports both.
Investment metrics
- 1% rule
- 3.78% ✓
- Cap rate
- 34.66%
- Cash-on-cash
- 101.33%
- DSCR
- 5.51
- GRM
- 2.2
CMA / ARV
- ARV (median comp)
- $68,195
- List price
- $45,000
- Delta
- -34.01%
- Verdict
- UNDERPRICED
- Comps
- 6 within 1.0 mi
Show comp detail 7 sales within ~0.75 mi
| Address | Dist | Beds/Ba | Sqft | Sold | Price | $/sf | Match |
|---|---|---|---|---|---|---|---|
| 80 Eagle Ln | 0.11mi | 2/2.0 (-1) | 1,200 (0%) | 2mo | $109,500 | $91 | 88 |
| 214 Par Ln | 0.20mi | 3/2.0 | 1,164 (-3%) | 4mo | $62,500 | $54 | 83 |
| 370 Petrol Rd | 0.46mi | 2/1.8 (-1) | 1,200 (0%) | 5mo | $55,000 | $46 | 69 |
| 46 Golfers Ln | 0.08mi | 3/2.0 | 1,344 (+12%) | 19mo | $83,000 | $62 | 60 |
| 116 Serve Ln | 0.11mi | 3/2.0 | 1,056 (-12%) | 18mo | $43,000 | $41 | 60 |
| 144 Love Ln | 0.19mi | 2/2.0 (-1) | 1,316 (+10%) | 22mo | $110,000 | $84 | 52 |
| 900 James Rd #83 | 0.52mi | 2/2.0 (-1) | 1,248 (+4%) | 23mo | $49,950 | $40 | 45 |
Match score weights: distance 35% · size 25% · config 20% · recency 20%. Top-matched comps best support the ARV.
Projected returns pro-forma
-3.0% appreciation · 2.22% rent growth · sell at horizon
- IRR
- —
- Equity multiple
- 5.69×
- Total profit
- $59,154
- Equity at exit
- $6,710
- IRR
- —
- Equity multiple
- 11.59×
- Total profit
- $133,444
- Equity at exit
- $3,891
Cash invested: $12,600 (down + closing). Projections, not guarantees.
Landlord ↔ Tenant lean methodology
- Overall (STATE)
- 18 Strongly Tenant-Friendly
- State California
- 18 Strongly Tenant-Friendly · D+13
- County
- — inherits STATE
- City
- — inherits STATE
ZIP-level market 93308
- Home prices YoY
- -0.5%
- Rents YoY
- 2.2%
- Active inventory
- 307
- Price-to-rent
- 2.2×
Monthly cashflow live
- Estimated rent
- $1,699 high interval (Pro) →
- Mortgage (P&I)
- −$236
- Tax from tax record
- −$24 /mo · $282/yr
- Insurance
- −$19
- HOA
- −$0
- Vacancy / Maint / Mgmt
- −$357
- Net cashflow
- $1,064
Break-even live
UW: 25.0% down · 7.5% · 30yr · 1.5% tax · 5.0% vac · 8.0% maint · 8.0% mgmt
Financing live
Cash to close
- Down payment
- $11,250
- Closing costs
- $1,350
- Reserves months
- —
- Total cash needed
- —
Loan-product check · same deal, 3 products live
Conventional
25% down · 7.5% · 30yr
- Down + closing
- —
- Monthly P&I
- —
- Monthly cashflow
- —
- DSCR
- —
- Eligible?
- —
Personal DTI + credit; lowest rate.
DSCR
20% down · 8.5% · 30yr
- Down + closing
- —
- Monthly P&I
- —
- Monthly cashflow
- —
- DSCR
- —
- Eligible?
- —
No personal income docs; deal must DSCR.
Hard money
10% down · 12.0% · 12mo
- Down + closing
- —
- Monthly P&I
- —
- Monthly cashflow
- —
- DSCR
- —
- Eligible?
- —
Short-term bridge; refi at stabilization.
Rent comps 24 comps
| Address | Beds | Baths | Sqft | Rent | $/sqft | DOM | Units | Dist |
|---|---|---|---|---|---|---|---|---|
| 730 James Rd Bakersfield, CA | 2.0 | 1.0 | 835 | $1,175 | $1.41 | 2d | 1 | 0.29mi |
| 3600 N Chester Ave Unit 10-B Bakersfield, CA | 2.0 | 1.0 | 953 | $1,295 | $1.36 | 2d | 1 | 0.48mi |
| 524 Sunset Meadow Ln Bakersfield, CA | 4.0 | 2.0 | 1346 | $2,150 | $1.60 | 2d | 1 | 0.63mi |
| 530 Sunset Meadow Ln Bakersfield, CA | 3.0 | 2.0 | 1116 | $2,050 | $1.84 | 2d | 1 | 0.64mi |
| 516 Yellow Meadow Ct Unit C Bakersfield, CA | 2.0 | 2.0 | 977 | $1,720 | $1.76 | 2d | 1 | 0.68mi |
| 548 Yellow Meadow Ct Unit C Bakersfield, CA | 2.0 | 2.0 | 925 | $1,595 | $1.72 | 2d | 1 | 0.71mi |
| 549 Yellow Meadow Ct Unit D Bakersfield, CA | 3.0 | 2.0 | 1200 | $1,825 | $1.52 | 23d | 1 | 0.76mi |
| 725 Greenwood Meadow Ln Bakersfield, CA | 2.0 | 1.0 | 935 | $1,600 | $1.71 | 21d | 1 | 0.87mi |
| 805 Sunset Meadow Ln Bakersfield, CA | 3.0 | 2.0 | 1163 | $2,050 | $1.76 | 2d | 1 | 0.88mi |
| 3433 Rustic Meadow Ct Apt B Bakersfield, CA | 2.0 | 2.0 | 1115 | $1,750 | $1.57 | 2d | 1 | 0.91mi |
| 3125 Park Meadows Dr Unit B Bakersfield, CA | 2.0 | 2.0 | 898 | $1,595 | $1.78 | 2d | 1 | 0.98mi |
| 101 Star Ct Bakersfield, CA | 3.0 | 2.0 | 1040 | $2,145 | $2.06 | 44d | 1 | 1.03mi |
| 930 Day Ave Unit A Bakersfield, CA | 2.0 | 1.5 | 900 | $1,395 | $1.55 | 2d | 1 | 1.04mi |
| 930 Day Ave Unit C Bakersfield, CA | 2.0 | 1.5 | 900 | $1,395 | $1.55 | 44d | 1 | 1.04mi |
| 932 Day Ave Unit D Bakersfield, CA | 2.0 | 1.0 | 900 | $1,295 | $1.44 | 2d | 1 | 1.05mi |
| 706 Orchid Dr Apt A Bakersfield, CA | 3.0 | 2.0 | 1233 | $1,900 | $1.54 | 2d | 1 | 1.10mi |
| 2609 Violet Ct Bakersfield, CA | 3.0 | 2.0 | 1471 | $2,100 | $1.43 | 44d | 1 | 1.10mi |
| 2600 Park Meadows Dr Bakersfield, CA | 1.0–2.0 | 1.0–2.0 | 864 | $1,495 | $1.73 | 2d | 2 | 1.24mi |
| 210 Douglas St Unit B Bakersfield, CA | 2.0 | 1.5 | 1274 | $1,400 | $1.10 | 2d | 1 | 1.28mi |
| 2413 Ashby St Unit 1 Bakersfield, CA | 3.0 | 1.0 | 1230 | $1,750 | $1.42 | 14d | 1 | 1.30mi |
| 615 W China Grade Loop Bakersfield, CA | 1.0–2.0 | 1.0–2.0 | 875 | $1,850 | $2.11 | 2d | 6 | 1.36mi |
| 411 Highland Dr Bakersfield, CA | 2.0 | 1.0 | 1051 | $1,650 | $1.57 | 2d | 1 | 1.39mi |
| 2309 Manor St Bakersfield, CA | 3.0 | 1.0 | 1090 | $1,725 | $1.58 | 2d | 1 | 1.40mi |
| 2001 Bedford Way Bakersfield, CA | 4.0 | 2.0 | 1500 | $2,500 | $1.67 | 3d | 1 | 1.46mi |
Listing history 15 events
-
2026-06-18days on market $45,000 Active 153 DOM
-
2026-06-17days on market $45,000 Active 152 DOM
-
2026-06-16days on market $45,000 Active 151 DOM
-
2026-06-15days on market $45,000 Active 150 DOM
-
2026-06-14days on market $45,000 Active 148 DOM
-
2026-06-10days on market $45,000 Active 145 DOM
-
2026-06-09days on market $45,000 Active 144 DOM
-
2026-06-08days on market $45,000 Active 143 DOM
-
2026-06-07days on market $45,000 Active 142 DOM
-
2026-06-05days on market $45,000 Active 139 DOM
-
2026-06-03days on market $45,000 Active 138 DOM
-
2026-06-03days on market $45,000 Active 137 DOM
-
2026-06-01days on market $45,000 Active 136 DOM
-
2026-05-31days on market $45,000 Active 135 DOM
-
2026-01-16$45,000 Active 781-char remark
Show marketing remark (781 chars)
Welcome to a beautiful opportunity in the Highland Knolls Mobile Estates 55+ community with an updated water heater! This inviting home features a spacious great room with soft carpet and abundant natural light, creating a warm and comfortable setting for everyday living. The kitchen offers generous storage and functionality, while the dining/bonus room is perfect for hosting gatherings or enjoying hobbies. Retreat to the extremely large primary suite, complete with a roomy closet and private restroom for added comfort. Outside, enjoy the convenience of a storage shed, covered patio, and grassy area ideal for relaxing or entertaining. With a some cosmetic touches, this home can truly shine - don't miss your chance to make it your own. Schedule your private showing today!
ⓘ Source: listings_history table (triggers on properties + properties_extension) + one-shot
backfill from property_details.listing_events for pre-trigger history.
Tax reassessment forecast CA · Resets to sale price
- Current annual tax
- $282 · $24/mo
- Projected year-2 tax
- $342 · $28/mo
- Expected delta
- +$60/yr (+$5/mo · 21.1%)
ⓘ Screening estimate from a state-policy table — verify with the county assessor before closing.
Climate risk First Street
- Flood 1/10 Low FEMA zone X (unshaded) · 0% chance over 30 yrs
- Wildfire 6/10 Major
- Heat 8/10 Severe 5 d/yr ≥104°F today · 12 d/yr by 30 yrs out
- Wind 1/10 Low
- Air quality 10/10 Extreme 39 unhealthy d/yr today · 45 by 30 yrs out
Nearby sold comps map
Loading sold comps map…
Walkable amenities ~0.75 mi
Loading nearby amenities…
Taxation est. · year 1
- Rental income
- $20,388
- − Mortgage interest
- −$2,521
- − Property taxes
- −$282
- − Insurance
- −$225
- − Repairs & maintenance
- −$1,631
- − Management
- −$1,631
- − Depreciation
- −$1,309
- Taxable income
- $12,789
- Est. tax owed @ 24.0%
- −$3,069
- After-tax cash flow
- $9,698/yr
For passive investors: Depreciation is non-cash, so a rental often shows a tax loss while cash-flowing — sheltering income. Rental losses are passive: they offset passive income freely, and up to $25,000/yr can offset ordinary (W-2) income if you actively participate and your MAGI is under $100k (phasing out to $0 by $150k); unused losses carry forward. On sale, claimed depreciation is recaptured at up to 25%, and gains may owe capital-gains tax (a 1031 exchange can defer both). Figures are a year-1 estimate at your 24.0% rate — not tax advice; consult a CPA.
Schools (NCES district)
- District
- Standard Elementary
- NCES district ID
- 0637890
- Math proficiency
- 16% ▬ 0.00%
- Reading proficiency
- 27% ▼ -3.00%
- Median HH income
- $40,574
- Composite
- 21.42/100
- National rank
- #13640
- State rank
- #1227 of 1400 in CA
Livability — Oildale
- Score
- 58/100
- State rank
- #680
- US rank
- #20848
Category grades
Schools grade is shown separately in the Schools card above.
Census & demographics
- Census place
- Oildale, CA
- County
- Kern County · 710,371 people
- Metro
- Bakersfield, CA
- Population (ZIP)
- 55,078
- Household income
- $62,445
- Rent vs Own
- Severe rent burden
- 2931.0
Population outlook (Kern County) Hauer SSP2
- Today (2025)
- 947,286 people
- By 2030
- 978,984 · +3.3%
- By 2040
- 1,045,018 · +10.3%
- By 2050
- 1,105,232 · +16.7%
- By 2075
- 1,229,538 · +29.8%
- By 2100
- 1,238,059 · +30.7%
Race, ethnicity, and origin ACS 2023
- Neighborhood character
- Diverse neighborhood (Simpson 0.57)
- Race & ethnicity
- White 57% Hispanic / Latino 32% Two or more races 15% Black 3% Asian 3% Native American 1%
- Hispanic origin (detail)
- Mexican 26%
- Common ancestry
- Slovak 3% Italian 1% Romanian 1%
- Foreign-born
- 8% · Canada, Vietnam
- Languages at home
- 80% English-only · Spanish 17%
Political lean MEDSL · Kern
- 2024 margin
- Strong R (+21.1) · D 38.2% · R 59.3% · Other 2.5%
- 2008→2024 swing
- -3.3pp toward R · 2008: -17.8pp · 2024: -21.1pp
- All cycles
- 2024: R+21.1 2020: R+10.2 2016: R+15.0 2012: R+20.9 2008: R+17.8
Not yet ingested
- Civics
- —
Market trends
- HPI YoY
- ▼ -4.52%
- Current HPI
- 825.65
- Rent YoY
- ▲ 2.22%
- Metro
- Bakersfield, CA
- State GDP YoY
- ▲ 3.21%
- F500 in state
- 116
Industry mix (Fortune 500 HQ in CA)
| Industry | F500 HQs | Revenue |
|---|---|---|
| Technology | 27 | $1,492B |
|
||
| Financial Services | 3 | $174B |
|
||
| Retail | 3 | $44B |
|
||
| Insurance | 3 | $26B |
|
||
| Media / Entertainment | 2 | $115B |
|
||
| Pharmaceuticals / Biotech | 2 | $62B |
|
||
Price history
1 event — show timeline
- 2026-01-16 Listed $45,000 GEMLS
Property tax history
+3.1%/yrLatest (2025): $282 · +93.2% YoY. Source: county tax records.
Cash-flow waterfall
monthlySold comps — $/sqft
last 12 mo · ≤1 miLoading sold comps…