 🌊 Lakefront
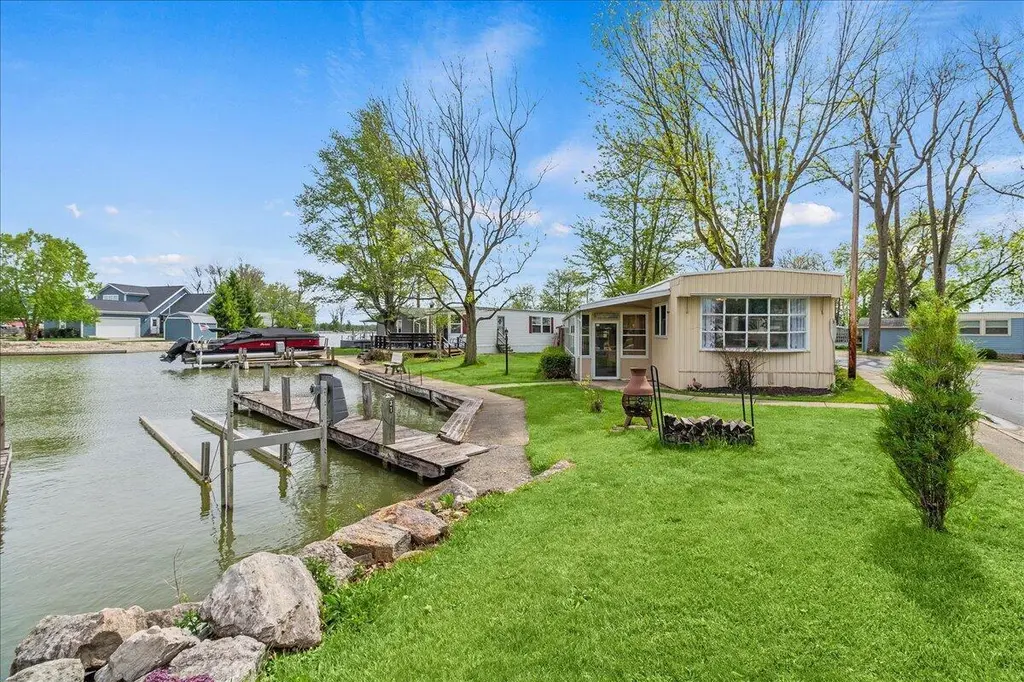
246 N Orchard Island Dr #31 · Russells Point, OH
Flood risk 1/10 · Minimal
- FEMA flood zone
- X (unshaded)
- Chance of flooding over 30 yrs
- 0.0%
- Est. flood insurance / yr
- $507 – $1,088
Fire risk 1/10 · Minimal
- Est. fire insurance / yr
- $713 – $1,323
Heat risk 3/10 · Minor
- Hot days now (above 100°F)
- 7 days/yr
- Hot days in 30 yrs
- 18 days/yr
Wind risk 2/10 · Minimal
- Chance of severe wind over 30 yrs
- —
Air-quality risk 2/10 · Minimal
- Unhealthy air days now
- 1 days/yr
- Unhealthy air days in 30 yrs
- 2 days/yr
Risk factors via First Street. Map © Google.
Why this score? — see what drove the B- grade
The composite is a weighted blend of 9 inputs, each scored 0–100. Each bar is that input's sub-score; the figure is the points it added to the 100-point composite (weight × sub-score).
- Cash flow +30.0/30.0
- 1% rule +10.0/10.0
- DSCR +10.0/10.0
- Schools +5.3/10.0
- Condition / age +3.8/5.0
- Livability +3.0/5.0
- Rent growth +2.5/5.0
- ARV discount +2.0/15.0
- Appreciation +0.0/10.0
$99,900
🖨 Deal sheet (PDF) 📄 Offer letter ✓ Due diligence
Listing remarks
Experience easy, affordable waterfront living at Indian Lake! This inviting channel-front home offers a bright, open-concept layout designed for comfort and relaxation. Inside, you'll love the abundance of natural light, updated flooring, and seamless flow into the spacious kitchen, perfect for hosting family and friends. The kitchen features ample cabinet and counter space, all appliances included, plus a large island with seating for four. Expansive windows showcase peaceful water views from multiple angles, creating a true lakefront atmosphere throughout the home. Enjoy the ideal 36x9 enclosed porch, offering the perfect space to unwind, entertain, or take in the beauty of waterfront liv
Key facts
- Built 1971
- Listed 45 days
Property features AI
Finance
- Other: Located in Beatley's Holiday Harbor; directions: Orchard Island Rd to right on Holiday Isle
- Financial info:
- HOA & community: Association maintains grounds and provides snow removal
Exterior
- Parking:
- Security:
- Utilities: Supplied water; Public sewer
- Home design: Residential mobile home; Leased lot
- Construction: Built in 1971; Aluminum siding; Pillar/post/pier foundation
- Exterior features: Dock; Porch (enclosed); Shed(s); Has waterfront
Interior
- Kitchen: Range; Microwave; Refrigerator; Kitchen (13 x 12)
- Bedrooms: Bedroom 1 (10 x 8); Bedroom 2 (13 x 12)
- Flooring: Carpet; Linoleum
- Bathrooms: 1 full bathroom; 1 half bathroom; 2 total bathrooms
- Heating & cooling: Natural gas heating; Central air conditioning
- Interior features: Ceiling fans
- Laundry & utility: Washer; Dryer; Gas water heater; Utility room (8 x 8)
Neighborhood map
What this means for you Summary
Snapshot
- This is a 2-bed/1.5-bath manufactured listed at $100k. Condition is rated good.
Deal economics
- At list price, monthly cash flow is $578 ($7k/yr) — positive.
- The deal already cash-flows at list — no discount required.
- Meets the 1% rule at list price ($2k rent vs $100k).
- Recommended offer: $97k (3.0% below list) — sets the bar for market timing.
- Cap rate 13.2% vs local median 2.8% in Russells Point — top-decile yield for the area; either an underpriced asset or a hidden risk that comps aren't pricing in. Stress-test before assuming the spread holds.
Location & tenants
- Location reads 60/100 on livability (#971 in OH) — a middle-class / working-renter tenant base. Strengths: crime A+, cost of living A+, housing A; Watch: schools F, amenities F, commute F.
- Indian Lake Local (rural): math 59% / reading 66% proficiency, ranked #261 of 656 in OH (top 40%) — acceptable for families but not a draw, mixed tenant base, ~2y average lease.
- Market conditions: 49 active listings in the ZIP; 2 comparable units currently listed for rent nearby; 121 units permitted in Logan County in 2024 (0 in 5+ unit buildings).
- This rent runs 38% of the median local income ($51k/yr) — at the standard rent-burdened threshold; future hikes will face affordability resistance.
Forward outlook
- Local home prices are declining (-3.0%/yr); year-one equity from $691 of loan paydown is wiped out by about $3k of value loss. Plan a longer hold.
- Logan County population projected at -15% by 2050 — secular population decline; favor cash flow + early exit over multi-decade hold.
- At projected returns (-3.0% appreciation + 3.0% rent growth), your $28k cash investment doubles in ~5 years — after that, you're playing with house money.
Negotiation context
- It's been on market 45 days — a 3% lower offer ($97k) is reasonable based on typical stale-listing flexibility.
Questions for the listing agent
- It's been on market 45 days. Have you received any prior offers? Is the seller open to a 3% concession, seller financing, or rate buy-down credit?
- Built in 1971 — when were the roof, HVAC, electrical panel, plumbing, and water heater last replaced?
- Is there a deadline driving the sale (1031 exchange, divorce, estate, relocation)? That informs how much negotiation room exists.
- Schools are F-rated, which usually means shorter tenancies and higher turnover. Who's the typical renter profile here, and what's been the actual vacancy rate?
- This sits on a lake — are riparian / water-frontage rights deeded with the parcel? Any dock permits, shoreline easements, or HOA water-use restrictions?
- What's the documented flood / surge / shoreline-erosion history here (FEMA AND non-FEMA — e.g., storm surge, creek backup, septic-field saturation)?
- Any water-quality or seasonal algae-bloom issues that affect tenant satisfaction or short-term-rental demand?
- What's the average days-on-market for RENTAL listings here right now (not sales)? A rising rental-DOM trend means longer vacancies and softer asking-rent achievability than the comps imply.
- What's the recent tenant-quality profile in this submarket — average credit score on applications, eviction rate, late-payment / NSF rate, and stable-employment percentage? A property-management company in the area should have these aggregated.
- How much new for-sale + rental construction is in the pipeline within 1–3 miles? Heavy new supply typically softens prices + rents 12–24 months out; constrained supply supports both.
Investment metrics
- 1% rule
- 1.61% ✓
- Cap rate
- 13.23%
- Cash-on-cash
- 24.78%
- DSCR
- 2.10
- GRM
- 5.2
CMA / ARV
- ARV (median comp)
- $89,000
- List price
- $99,900
- Delta
- 12.25%
- Verdict
- OVERPRICED
- Comps
- 5 within 1.0 mi
Show comp detail 4 sales within ~0.75 mi
| Address | Dist | Beds/Ba | Sqft | Sold | Price | $/sf | Match |
|---|---|---|---|---|---|---|---|
| 246 N Orchard Island Dr Lot 45 | 0.02mi | 2/1.0 | 972 (+5%) | 2mo | $89,000 | $92 | 87 |
| 246 N Orchard Island Rd #44 | 0.05mi | 2/1.0 | 966 (+4%) | 20mo | $120,000 | $124 | 72 |
| 246 S Orchard Island Dr #50 | 0.30mi | 2/2.0 | 992 (+7%) | 1mo | $169,000 | $170 | 71 |
| 8935 Chestnut #5 | 0.35mi | 2/2.0 | 1,028 (+11%) | 9mo | $85,000 | $83 | 55 |
Match score weights: distance 35% · size 25% · config 20% · recency 20%. Top-matched comps best support the ARV.
Projected returns pro-forma
-3.0% appreciation · 3.0% rent growth · sell at horizon
- IRR
- 18.2%
- Equity multiple
- 1.74×
- Total profit
- $20,621
- Equity at exit
- $14,895
- IRR
- 26.6%
- Equity multiple
- 3.34×
- Total profit
- $65,422
- Equity at exit
- $8,638
Cash invested: $27,972 (down + closing). Projections, not guarantees.
Landlord ↔ Tenant lean methodology
- Overall (STATE)
- 73 Landlord-Friendly
- State Ohio
- 73 Landlord-Friendly · R+6
- County
- — inherits STATE
- City
- — inherits STATE
ZIP-level market 43348
- Home prices YoY
- -29.2%
- Active inventory
- 49
- Price-to-rent
- 5.2×
Monthly cashflow live
- Estimated rent
- $1,605 medium interval (Pro) →
- Mortgage (P&I)
- −$524
- Tax est. 1.5%
- −$125 /mo · $1,498/yr
- Insurance
- −$42
- HOA
- −$0
- Vacancy / Maint / Mgmt
- −$337
- Net cashflow
- $578
Break-even live
Sensitivity live
| Price | -10% $647 | -5% $612 | +0% $578 | +5% $543 | +10% $509 |
|---|---|---|---|---|---|
| Rent | -10% $451 | -5% $514 | +0% $578 | +5% $641 | +10% $704 |
| Rate | -1.0pp $628 | -0.5pp $603 | base $578 | +0.5pp $552 | +1.0pp $525 |
UW: 25.0% down · 7.5% · 30yr · 1.5% tax · 5.0% vac · 8.0% maint · 8.0% mgmt
Financing live
Cash to close
- Down payment
- $24,975
- Closing costs
- $2,997
- Reserves months
- —
- Total cash needed
- —
Loan-product check · same deal, 3 products live
Conventional
25% down · 7.5% · 30yr
- Down + closing
- —
- Monthly P&I
- —
- Monthly cashflow
- —
- DSCR
- —
- Eligible?
- —
Personal DTI + credit; lowest rate.
DSCR
20% down · 8.5% · 30yr
- Down + closing
- —
- Monthly P&I
- —
- Monthly cashflow
- —
- DSCR
- —
- Eligible?
- —
No personal income docs; deal must DSCR.
Hard money
10% down · 12.0% · 12mo
- Down + closing
- —
- Monthly P&I
- —
- Monthly cashflow
- —
- DSCR
- —
- Eligible?
- —
Short-term bridge; refi at stabilization.
Rent comps 2 comps
| Address | Beds | Baths | Sqft | Rent | $/sqft | DOM | Units | Dist |
|---|---|---|---|---|---|---|---|---|
| 8926 Franklin Ave Lakeview, OH | 2.0 | 1.0 | 696 | $1,605 | $2.31 | 3d | 1 | 1.28mi |
| 8926 Franklin Ave Unit B Lakeview, OH | 2.0 | 1.0 | 696 | $1,605 | $2.31 | 3d | 1 | 1.28mi |
Listing history 17 events
-
2026-06-21days on market $99,900 Active 45 DOM
-
2026-06-18days on market $99,900 Active 43 DOM
-
2026-06-17days on market $99,900 Active 42 DOM
-
2026-06-16days on market $99,900 Active 41 DOM
-
2026-06-15days on market $99,900 Active 40 DOM
-
2026-06-13days on market $99,900 Active 38 DOM
-
2026-06-12days on market $99,900 Active 37 DOM
-
2026-06-09days on market $99,900 Active 34 DOM
-
2026-06-08days on market $99,900 Active 33 DOM
-
2026-06-08days on market $99,900 Active 32 DOM
-
2026-06-07days on market $99,900 Active 31 DOM
-
2026-06-04days on market $99,900 Active 28 DOM
-
2026-06-02days on market $99,900 Active 27 DOM
-
2026-06-01days on market $99,900 Active 26 DOM
-
2026-05-31days on market $99,900 Active 25 DOM
-
2026-05-31price $99,900 Active 24 DOM
-
2026-05-05$109,900 Active 912-char remark
ⓘ Source: listings_history table (triggers on properties + properties_extension) + one-shot
backfill from property_details.listing_events for pre-trigger history.
Climate risk First Street
- Flood 1/10 Low FEMA zone X (unshaded) · 0% chance over 30 yrs
- Wildfire 1/10 Low
- Heat 3/10 Moderate 7 d/yr ≥100°F today · 18 d/yr by 30 yrs out
- Wind 2/10 Low
- Air quality 2/10 Low 1 unhealthy d/yr today · 2 by 30 yrs out
Nearby sold comps map
Loading sold comps map…
Walkable amenities ~0.75 mi
Loading nearby amenities…
Taxation est. · year 1
- Rental income
- $19,260
- − Mortgage interest
- −$5,596
- − Property taxes
- −$1,498
- − Insurance
- −$500
- − Repairs & maintenance
- −$1,541
- − Management
- −$1,541
- − Depreciation
- −$2,906
- Taxable income
- $5,678
- Est. tax owed @ 24.0%
- −$1,363
- After-tax cash flow
- $5,568/yr
For passive investors: Depreciation is non-cash, so a rental often shows a tax loss while cash-flowing — sheltering income. Rental losses are passive: they offset passive income freely, and up to $25,000/yr can offset ordinary (W-2) income if you actively participate and your MAGI is under $100k (phasing out to $0 by $150k); unused losses carry forward. On sale, claimed depreciation is recaptured at up to 25%, and gains may owe capital-gains tax (a 1031 exchange can defer both). Figures are a year-1 estimate at your 24.0% rate — not tax advice; consult a CPA.
Condition & rehab AI · 12 photos
This waterfront home offers a good condition with updated flooring and appliances, and is ready for minor cosmetic improvements to enhance its resale and rental value.
Value-add opportunities
- Both Painting exterior and interior walls — Enhances curb appeal and interior aesthetics.
- Both Landscaping improvements — Enhances curb appeal and creates a more inviting atmosphere.
- Resale Kitchen backsplash replacement — Updates the kitchen and adds a modern touch.
- Resale New flooring in bathrooms — Enhances the overall aesthetic and functionality of the bathrooms.
Renovation cost estimate screening
Value-add ROI direction
- Both Painting exterior and interior walls — Enhances curb appeal and interior aesthetics. ↑
- Both Landscaping improvements — Enhances curb appeal and creates a more inviting atmosphere. ↑
- Resale Kitchen backsplash replacement — Updates the kitchen and adds a modern touch. ↑
- Resale New flooring in bathrooms — Enhances the overall aesthetic and functionality of the bathrooms. ↑
ⓘ Cost ranges are severity-bucket heuristics (US national rule-of-thumb). Get contractor quotes + a written scope before underwriting a rehab budget.
Schools (NCES district)
- District
- Indian Lake Local
- NCES district ID
- 3904808
- Math proficiency
- 59% ▼ -14.00%
- Reading proficiency
- 66% ▼ -4.00%
- Median HH income
- $44,496
- Composite
- 52.6/100
- National rank
- #1559
- State rank
- #261 of 656 in OH
Livability — Russells Point
- Score
- 60/100
- State rank
- #971
- US rank
- #18804
Category grades
Schools grade is shown separately in the Schools card above.
Census & demographics
- Census place
- Russells Point, OH
- County
- Logan · 47,256 people
- City population
- 1,865
- Population (ZIP)
- 1,865
- Household income
- $50,658
- Rent vs Own
- Severe rent burden
- 7.3
Population outlook (Logan County) Hauer SSP2
- Today (2025)
- 44,240 people
- By 2030
- 43,166 · -2.4%
- By 2040
- 40,495 · -8.5%
- By 2050
- 37,511 · -15.2%
- By 2075
- 30,453 · -31.2%
- By 2100
- 23,081 · -47.8%
Race, ethnicity, and origin ACS 2023
- Neighborhood character
- Predominantly White (92%)
- Race & ethnicity
- White 92% Black 3% Two or more races 2% Hispanic / Latino 2%
- Common ancestry
- Lithuanian 3% Czech 2% Italian 1%
- Foreign-born
- 1% · Canada
Political lean MEDSL · Logan
- 2024 margin
- Solid R (+56.2) · D 21.5% · R 77.7%
- 2008→2024 swing
- -29.6pp toward R · 2008: -26.6pp · 2024: -56.2pp
- All cycles
- 2024: R+56.2 2020: R+55.2 2016: R+52.6 2012: R+31.8 2008: R+26.6
Not yet ingested
- Civics
- —
Market trends
- HPI YoY
- ▼ -108.07%
- Current HPI
- 261.3567
- Rent YoY
- —
- Metro
- —
- State GDP YoY
- ▲ 1.98%
- F500 in state
- 48
Industry mix (Fortune 500 HQ in OH)
| Industry | F500 HQs | Revenue |
|---|---|---|
| Insurance | 3 | $145B |
|
||
| Industrial Machinery | 3 | $49B |
|
||
| Financial Services | 3 | $24B |
|
||
| Consumer Goods | 2 | $93B |
|
||
| Aerospace / Defense | 2 | $47B |
|
||
| Utilities | 2 | $33B |
|
||
Price history
-9.1% since first listed2 events — show timeline
- 2026-05-30 Price Changed $99,900 WRIST
- 2026-05-05 Listed $109,900 WRIST
Cash-flow waterfall
monthlySold comps — $/sqft
last 12 mo · ≤1 miLoading sold comps…