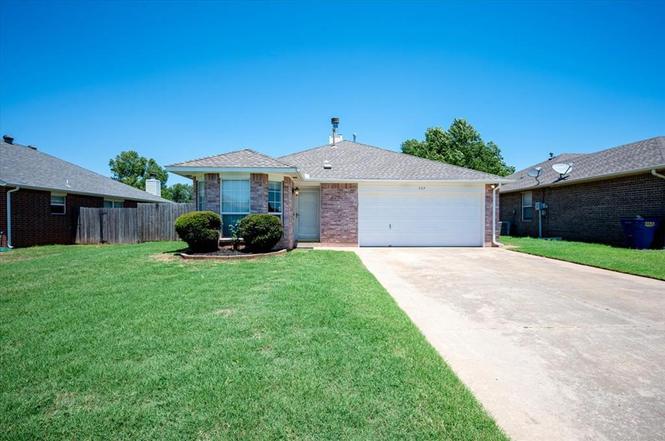
337 W Chantilly Way · Mustang, OK
Flood risk 1/10 · Minimal
- FEMA flood zone
- X (unshaded)
- Chance of flooding over 30 yrs
- 0.0%
- Est. flood insurance / yr
- $507 – $1,088
Fire risk 4/10 · Minor
- Est. fire insurance / yr
- $2,463 – $4,575
Heat risk 6/10 · Moderate
- Hot days now (above 107°F)
- 7 days/yr
- Hot days in 30 yrs
- 19 days/yr
Wind risk 2/10 · Minimal
- Chance of severe wind over 30 yrs
- 2.0%
Air-quality risk 1/10 · Minimal
- Unhealthy air days now
- 0 days/yr
- Unhealthy air days in 30 yrs
- 0 days/yr
Risk factors via First Street. Map © Google.
Why this score? — see what drove the D- grade
The composite is a weighted blend of 9 inputs, each scored 0–100. Each bar is that input's sub-score; the figure is the points it added to the 100-point composite (weight × sub-score).
- Cash flow +13.7/30.0
- ARV discount +5.1/15.0
- DSCR +4.1/10.0
- Livability +3.5/5.0
- Schools +3.1/10.0
- 1% rule +3.0/10.0
- Condition / age +2.5/5.0
- Rent growth +2.4/5.0
- Appreciation +0.0/10.0
$195,000
🖨 Deal sheet (PDF) 📄 Offer letter ✓ Due diligence
Listing remarks
Move in ready and full of charm! This adorable 3 bedroom, 2 bathroom home is located on a cul-de-sac street in the heart of Mustang, just minutes from Wild Horse Park. Step inside to find new carpet, fresh touch up paint throughout, and a bright, inviting living room filled with natural light. The living room offers a floor to ceiling stone fireplace with a cozy wood burning stove. The spacious primary bedroom offers a private ensuite bathroom with a garden tub, walk in closet, built in vanity nook and additional built in storage. Outside, you'll love the spacious backyard and covered side patio, perfect for relaxing, entertaining or enjoying Mustang's annual fireworks show from the comfort
Key facts
- Built in vanity nook
- Cul-de-sac street
- Walk in closet
Tags
Property features AI
Finance
- Other: Listing is active; Occupancy: Not occupied
- Financial info: Loan qualification: Yes; Not assumable
- HOA & community: No mandatory association dues
Exterior
- Parking: 2-car garage
- Utilities: No flood insurance required (per listing)
- Home design: Single-family residence; One level; Existing property
- Construction: Brick and brick & frame construction; Heavy composition roof; Built previously (existing)
- Exterior features: Covered patio; Rain gutters; Interior lot; Storm shelter (garage floor and below ground)
Interior
- Kitchen: Free-standing electric range; Dishwasher, Microwave, Refrigerator
- Bedrooms: 3 bedrooms
- Flooring: Carpet; Tile
- Bathrooms: 2 full bathrooms
- Interior features: Dishwasher, Microwave, Refrigerator; Carpet and tile flooring; Wood-burning fireplace (1)
- Laundry & utility: Slab foundation
Neighborhood map
What this means for you Summary
Snapshot
- This is a 3-bed/2.0-bath single-family listed at $195k.
Deal economics
- At list price, monthly cash flow is $15 ($178/yr) — positive.
- The deal already cash-flows at list — no discount required.
- To meet the 1% rule (rent ≥ 1% of price), the offer needs to be $156k (19.8% below list).
- Recommended offer: $156k (19.8% below list) — sets the bar for 1% rule.
- Cap rate 6.4% vs local median 4.6% in Mustang — top-decile yield for the area; either an underpriced asset or a hidden risk that comps aren't pricing in. Stress-test before assuming the spread holds.
Location & tenants
- Location reads 69/100 on livability (#52 in OK) — a middle-class / working-renter tenant base. Strengths: crime A+, cost of living A+, housing A+; Watch: amenities F, commute F, health & safety F.
- Mustang (suburban): math 35% / reading 33% proficiency, ranked #28 of 270 in OK (top 10%) — families likely to look elsewhere, expect single-tenant / working-renter base with shorter leases.
- Zoned schools: Mustang Centennial Es (math 46% / reading 42%, grade F, #73 of 845 statewide, top 9%, 643 students, 0% FRL); Mustang Ms (math 30% / reading 29%, grade F, #52 of 345 statewide, top 15%, 723 students, 0% FRL); Mustang Hs (math 28% / reading 39%, grade F, #65 of 447 statewide, top 14%, 3,756 students, 0% FRL) — zoned schools average 0% FRL vs 28% district-wide (28 pts lower); this property's tenant base skews higher-income than the district average.
- Market conditions: Rents soft (-0.3%/yr); 523 active listings in the ZIP; 14 comparable units currently listed for rent nearby; rentals at typical pace (median 18d on market — plan ~3-4 weeks tenant-placement turnaround); solid renter incomes; 260 units permitted in Canadian County in 2024 (0 in 5+ unit buildings).
Forward outlook
- Local home prices are declining (-3.0%/yr); year-one equity from $1k of loan paydown is wiped out by about $6k of value loss. Plan a longer hold.
- Canadian County population projected at +64% by 2050 — long-run rental-demand tailwind backs the buy-and-hold thesis.
Negotiation context
- Only 1 days on market — expect competitive offers; lowballing is unlikely to land.
- 2 sale attempts since 21y ago with the ask held roughly flat each time — persistent listings suggest the price (not the market) is what's stuck; bring a comps-based counter.
- Current owner paid $92k; list at $195k implies a 112% gain — meaningful room to come down on a strong offer.
Risks & watch-outs
- Climate carrying-cost: extreme-heat days projected 7→19/yr by 2055 (HVAC capex compounding) — expect insurance premiums to compound above CPI over the hold.
Questions for the listing agent
- Is there a deadline driving the sale (1031 exchange, divorce, estate, relocation)? That informs how much negotiation room exists.
- The area grade is low — what's the realistic commute time and amenity access for the typical tenant pool here? Any planned neighborhood developments (good or bad) we should know about?
- What's the average days-on-market for RENTAL listings here right now (not sales)? A rising rental-DOM trend means longer vacancies and softer asking-rent achievability than the comps imply.
- What's the recent tenant-quality profile in this submarket — average credit score on applications, eviction rate, late-payment / NSF rate, and stable-employment percentage? A property-management company in the area should have these aggregated.
- How much new for-sale + rental construction is in the pipeline within 1–3 miles? Heavy new supply typically softens prices + rents 12–24 months out; constrained supply supports both.
Investment metrics
- 1% rule
- 0.80% ✗
- Cap rate
- 6.38%
- Cash-on-cash
- 0.33%
- DSCR
- 1.01
- GRM
- 10.4
CMA / ARV
- ARV (on-the-fly)
- $184,946
- Comps found
- 12
Show comp detail 12 sales within ~0.75 mi
| Address | Dist | Beds/Ba | Sqft | Sold | Price | $/sf | Match |
|---|---|---|---|---|---|---|---|
| 405 W Twisted Branch Way | 0.25mi | 3/2.0 | 1,258 (+7%) | 0mo | $200,000 | $159 | 77 |
| 611 S Forest Dr | 0.58mi | 3/2.0 | 1,203 (+2%) | 3mo | $200,000 | $166 | 66 |
| 344 W Forest Dr | 0.51mi | 3/2.0 | 1,210 (+3%) | 7mo | $199,900 | $165 | 66 |
| 246 W Chantilly Way | 0.11mi | 2/1.0 (-1) | 1,070 (-9%) | 7mo | $171,500 | $160 | 65 |
| 433 W Forest Dr | 0.48mi | 3/1.5 | 1,135 (-4%) | 6mo | $188,000 | $166 | 64 |
| 335 W Cedar Dr | 0.38mi | 3/2.0 | 1,318 (+12%) | 0mo | $204,000 | $155 | 62 |
| 732 W Elder Dr | 0.64mi | 3/2.0 | 1,133 (-4%) | 3mo | $170,000 | $150 | 61 |
| 620 S Woodland Dr | 0.64mi | 3/2.0 | 1,246 (+6%) | 0mo | $185,000 | $148 | 60 |
| 912 W Tesio Way | 0.69mi | 3/2.0 | 1,116 (-5%) | 2mo | $171,000 | $153 | 58 |
| 425 W Linden Dr | 0.70mi | 3/1.0 | 1,212 (+3%) | 9mo | $182,000 | $150 | 51 |
| 910 W Kyle Way | 0.70mi | 3/1.5 | 1,016 (-14%) | 1mo | $160,000 | $157 | 42 |
| 413 W Linden Dr | 0.70mi | 4/1.0 (+1) | 1,335 (+13%) | 5mo | $187,000 | $140 | 32 |
Match score weights: distance 35% · size 25% · config 20% · recency 20%. Top-matched comps best support the ARV.
Projected returns pro-forma
-3.0% appreciation · 0.0% rent growth · sell at horizon
- IRR
- -18.9%
- Equity multiple
- 0.35×
- Total profit
- $-35,293
- Equity at exit
- $29,075
- IRR
- -18.3%
- Equity multiple
- 0.13×
- Total profit
- $-47,453
- Equity at exit
- $16,860
Cash invested: $54,600 (down + closing). Projections, not guarantees.
Landlord ↔ Tenant lean methodology
- Overall (STATE)
- 83 Strongly Landlord-Friendly
- State Oklahoma
- 83 Strongly Landlord-Friendly · R+20
- County
- — inherits STATE
- City
- — inherits STATE
ZIP-level market 73064
- Home prices YoY
- -17.9%
- Rents YoY
- -0.3%
- Active inventory
- 523
- Price-to-rent
- 10.4×
Monthly cashflow live
- Estimated rent
- $1,564 high interval (Pro) →
- Mortgage (P&I)
- −$1,023
- Tax from tax record
- −$117 /mo · $1,405/yr
- Insurance
- −$81
- HOA
- −$0
- Vacancy / Maint / Mgmt
- −$328
- Net cashflow
- $15
Break-even live
Sensitivity live
| Price | -10% $125 | -5% $70 | +0% $15 | +5% $-40 | +10% $-96 |
|---|---|---|---|---|---|
| Rent | -10% $-109 | -5% $-47 | +0% $15 | +5% $77 | +10% $138 |
| Rate | -1.0pp $113 | -0.5pp $64 | base $15 | +0.5pp $-36 | +1.0pp $-87 |
UW: 25.0% down · 7.5% · 30yr · 1.5% tax · 5.0% vac · 8.0% maint · 8.0% mgmt
Financing live
Cash to close
- Down payment
- $48,750
- Closing costs
- $5,850
- Reserves months
- —
- Total cash needed
- —
Loan-product check · same deal, 3 products live
Conventional
25% down · 7.5% · 30yr
- Down + closing
- —
- Monthly P&I
- —
- Monthly cashflow
- —
- DSCR
- —
- Eligible?
- —
Personal DTI + credit; lowest rate.
DSCR
20% down · 8.5% · 30yr
- Down + closing
- —
- Monthly P&I
- —
- Monthly cashflow
- —
- DSCR
- —
- Eligible?
- —
No personal income docs; deal must DSCR.
Hard money
10% down · 12.0% · 12mo
- Down + closing
- —
- Monthly P&I
- —
- Monthly cashflow
- —
- DSCR
- —
- Eligible?
- —
Short-term bridge; refi at stabilization.
Rent comps 14 comps
| Address | Beds | Baths | Sqft | Rent | $/sqft | DOM | Units | Dist |
|---|---|---|---|---|---|---|---|---|
| 736 W Celestial Way Mustang, OK | 1.0–2.0 | 1.0 | 838 | $1,695 | $2.02 | 3d | 8 | 0.55mi |
| 936 W Tesio Way Mustang, OK | 3.0 | 1.5 | 1255 | $1,425 | $1.14 | 25d | 1 | 0.74mi |
| 742 W Juniper Dr Mustang, OK | 3.0 | 1.5 | 1100 | $1,475 | $1.34 | 3d | 1 | 0.80mi |
| 360 N Pebble Creek Ter Mustang, OK | 3.0 | 2.0 | 1350 | $1,540 | $1.14 | 16d | 1 | 0.80mi |
| 360 N Pebble Creek Ter Mustang, OK | 2.0 | 2.0 | 1200 | $1,271 | $1.06 | 17d | 1 | 0.80mi |
| 360 N Pebble Creek Ter Mustang, OK | 3.0 | 2.0 | 1350 | $1,530 | $1.13 | 3d | 1 | 0.80mi |
| 360 N Pebble Creek Ter Mustang, OK | 2.0 | 2.0 | 1200 | $1,272 | $1.06 | 25d | 1 | 0.80mi |
| 360 N Pebble Creek Ter Mustang, OK | 2.0 | 2.0 | 1200 | $1,271 | $1.06 | 22d | 1 | 0.80mi |
| Greens at Mustang Creek Mustang, OK | 1.0–2.0 | 1.0–2.0 | 818 | $1,275 | $1.56 | 3d | 1 | 0.83mi |
| 1013 W Gladys Way Mustang, OK | 3.0 | 2.0 | 1116 | $1,450 | $1.30 | 23d | 1 | 0.84mi |
| 733 W Perry Dr Mustang, OK | 3.0 | 1.5 | 999 | $1,345 | $1.35 | 3d | 1 | 0.93mi |
| 1136 W Johnathan Way Mustang, OK | 3.0 | 2.0 | 1415 | $1,450 | $1.02 | 25d | 1 | 0.97mi |
| 1247 W Huntington Way Unit a Mustang, OK | 2.0 | 1.5 | 1024 | $1,200 | $1.17 | 4d | 1 | 1.07mi |
| 609 E Linden Ln Mustang, OK | 3.0 | 2.0 | 1242 | $1,700 | $1.37 | 25d | 1 | 1.23mi |
Listing history 3 events
-
2026-06-21status $195,000 Pending 1 DOM
-
2026-06-19remarks 699-char remark
-
2026-06-19$195,000 Active 1 DOM
ⓘ Source: listings_history table (triggers on properties + properties_extension) + one-shot
backfill from property_details.listing_events for pre-trigger history.
Tax reassessment forecast OK · Resets to sale price
- Current annual tax
- $1,405 · $117/mo
- Projected year-2 tax
- $1,755 · $146/mo
- Expected delta
- +$350/yr (+$29/mo · 24.9%)
ⓘ Screening estimate from a state-policy table — verify with the county assessor before closing.
Climate risk First Street
- Flood 1/10 Low FEMA zone X (unshaded) · 0% chance over 30 yrs
- Wildfire 4/10 Moderate
- Heat 6/10 Major 7 d/yr ≥107°F today · 19 d/yr by 30 yrs out
- Wind 2/10 Low 2% chance of damaging wind over 30 yrs
- Air quality 1/10 Low 0 unhealthy d/yr today · 0 by 30 yrs out
Nearby sold comps map
Loading sold comps map…
Walkable amenities ~0.75 mi
Loading nearby amenities…
Taxation est. · year 1
- Rental income
- $18,771
- − Mortgage interest
- −$10,923
- − Property taxes
- −$1,405
- − Insurance
- −$975
- − Repairs & maintenance
- −$1,502
- − Management
- −$1,502
- − Depreciation
- −$5,673
- Taxable loss
- −$3,208
- Est. tax savings @ 24.0%
- +$770
- After-tax cash flow
- $948/yr
For passive investors: Depreciation is non-cash, so a rental often shows a tax loss while cash-flowing — sheltering income. Rental losses are passive: they offset passive income freely, and up to $25,000/yr can offset ordinary (W-2) income if you actively participate and your MAGI is under $100k (phasing out to $0 by $150k); unused losses carry forward. On sale, claimed depreciation is recaptured at up to 25%, and gains may owe capital-gains tax (a 1031 exchange can defer both). Figures are a year-1 estimate at your 24.0% rate — not tax advice; consult a CPA.
Schools (NCES district)
- District
- Mustang
- NCES district ID
- 4021000
- Math proficiency
- 35% ▼ -10.00%
- Reading proficiency
- 33% ▼ -7.00%
- Median HH income
- $67,559
- Composite
- 31.21/100
- National rank
- #6038
- State rank
- #28 of 270 in OK
Livability — Mustang
- Score
- 69/100
- State rank
- #52
- US rank
- #8746
Category grades
Schools grade is shown separately in the Schools card above.
Census & demographics
- Census place
- Mustang, OK
- County
- Canadian County · 154,341 people
- City population
- 28,919
- Metro
- Oklahoma City, OK
- Population (ZIP)
- 28,919
- Household income
- $94,402
- Rent vs Own
- Severe rent burden
- 384.0
Population outlook (Canadian County) Hauer SSP2
- Today (2025)
- 174,062 people
- By 2030
- 195,170 · +12.1%
- By 2040
- 239,293 · +37.5%
- By 2050
- 285,457 · +64.0%
- By 2075
- 403,766 · +132.0%
- By 2100
- 498,766 · +186.5%
Race, ethnicity, and origin ACS 2023
- Neighborhood character
- Predominantly White (74%)
- Race & ethnicity
- White 74% Two or more races 11% Hispanic / Latino 10% Native American 3% Black 3% Asian 2%
- Hispanic origin (detail)
- Mexican 8%
- Common ancestry
- Italian 2% Scottish 2% Slovak 2%
- Foreign-born
- 4% · Canada, Vietnam
- Languages at home
- 93% English-only · Spanish 5% Other Indo-European 1% Tagalog/Filipino 1%
Political lean MEDSL · Canadian
- 2024 margin
- Solid R (+40.4) · D 28.8% · R 69.2% · Other 2.0%
- 2008→2024 swing
- +11.9pp toward D · 2008: -52.2pp · 2024: -40.4pp
- All cycles
- 2024: R+40.4 2020: R+43.3 2016: R+51.2 2012: R+54.4 2008: R+52.2
Not yet ingested
- Civics
- —
Market trends
- HPI YoY
- ▼ -56.66%
- Current HPI
- 260.2863
- Rent YoY
- ▼ -0.33%
- Metro
- Oklahoma City, OK
- State GDP YoY
- ▲ 1.55%
- F500 in state
- 6
Industry mix (Fortune 500 HQ in OK)
| Industry | F500 HQs | Revenue |
|---|---|---|
| Energy | 3 | $48B |
|
||
Price history
+650.0% since first listed5 events — show timeline
- 2026-06-18 Listed $195,000 MLSOK
- 2007-12-19 Listing Removed — MLSOK
- 2005-08-02 Sold (Public Records) $92,000 Public Records
- 2005-06-17 Listed $94,900 MLSOK
- 1998-05-27 Sold (Public Records) $26,000 Public Records
Property tax history
+1.5%/yrLatest (2025): $1,405 · +4.4% YoY. Source: county tax records.
Cash-flow waterfall
monthlySold comps — $/sqft
last 12 mo · ≤1 miLoading sold comps…