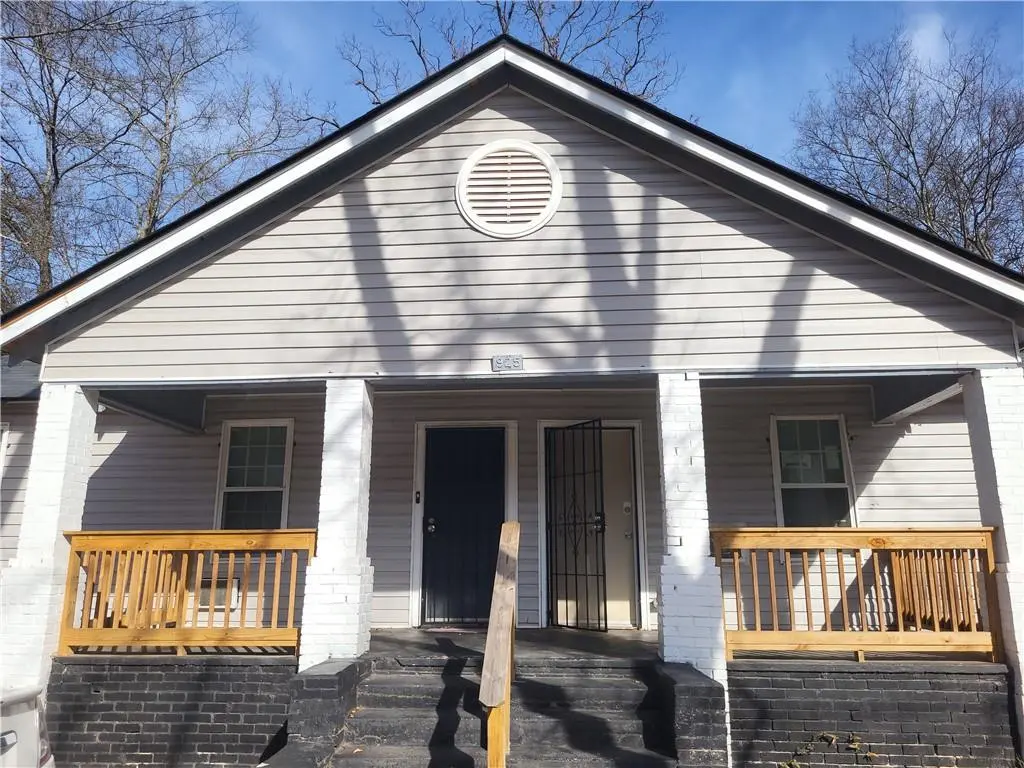
 Duplex
925 Troupe St · Macon-Bibb County, GA
Flood risk 1/10 · Minimal
- FEMA flood zone
- X (unshaded)
- Chance of flooding over 30 yrs
- 0.0%
- Est. flood insurance / yr
- $507 – $1,088
Fire risk 1/10 · Minimal
- Est. fire insurance / yr
- $963 – $1,789
Heat risk 7/10 · Major
- Hot days now (above 109°F)
- 7 days/yr
- Hot days in 30 yrs
- 18 days/yr
Wind risk 6/10 · Moderate
- Chance of severe wind over 30 yrs
- 68.0%
Air-quality risk 3/10 · Minor
- Unhealthy air days now
- 3 days/yr
- Unhealthy air days in 30 yrs
- 4 days/yr
Risk factors via First Street. Map © Google.
Why this score? — see what drove the D grade
The composite is a weighted blend of 9 inputs, each scored 0–100. Each bar is that input's sub-score; the figure is the points it added to the 100-point composite (weight × sub-score).
- Cash flow +22.4/30.0
- DSCR +7.2/10.0
- 1% rule +5.1/10.0
- Rent growth +3.8/5.0
- Livability +2.5/5.0
- Condition / age +2.5/5.0
- Schools +1.2/10.0
- ARV discount +0.0/15.0
- Appreciation +0.0/10.0
$195,000
🖨 Deal sheet 📄 Offer letter ✓ Due diligence
Multi-family units
County records classify this as Multi-Family (2-4 Unit). Listing-text estimate: 2 units. confirmed
Listing remarks MLS
INVESTMENT OPPORTUNITY! Renovated DUPLEX with paying tenants already in place. Tenants have a 12-month lease in place with Macon Housing Authority. Since tenants are in place - please text and we can arrange for showings ***24 HOUR NOTICE REQUIRED*** Close to 75, shopping and schools.
Key facts
- Renovated duplex
- Close to 75
- Shopping
Tags
Neighborhood map
What this means for you Summary
Snapshot
- This is a 2 × 2-bed/1.0-bath units multifamily listed at $195k.
Deal economics
- At list price, monthly cash flow is $325 ($4k/yr) — positive. Per door: $162/mo.
- The deal already cash-flows at list — no discount required.
- Meets the 1% rule at list price ($2k rent vs $195k).
- Recommended offer: $172k (12.0% below list) — sets the bar for market timing.
- Cap rate 8.3% vs local median 5.4% in Macon-Bibb County — top-decile yield for the area; either an underpriced asset or a hidden risk that comps aren't pricing in. Stress-test before assuming the spread holds.
Location & tenants
- Location reads: area grade D — affects rentability + tenant quality, not the cash-flow math above.
- Bibb County (urban): math 11% / reading 18% proficiency, ranked #161 of 174 in GA (top 92%) — low school quality limits family demand, transient renter base, plan for 1-2y turnover; 75% free/reduced lunch — lower-income household profile, screen leases tightly.
- Market conditions: Rents rising fast (+5.0%/yr); 207 active listings in the ZIP; 7 comparable units currently listed for rent nearby; rentals at typical pace (median 21d on market — plan ~3-4 weeks tenant-placement turnaround); lower-income renter base — watch delinquency; 154 units permitted in Bibb County in 2024 (0 in 5+ unit buildings).
- At $1,960/mo this rent would consume 78% of the median local household income ($30k/yr) (locally 1335% of renters already pay >50% of income on rent) — very limited rent-growth headroom before tenants either downsize or default.
Forward outlook
- Local home prices are declining (-3.0%/yr); year-one equity from $1k of loan paydown is wiped out by about $6k of value loss. Plan a longer hold.
- Bibb County population projected at -12% by 2050 — secular population decline; favor cash flow + early exit over multi-decade hold.
Negotiation context
- It's been on market 144 days — a 12% lower offer ($172k) is reasonable based on typical stale-listing flexibility.
- 6 sale attempts since 4y ago with the ask held roughly flat each time — persistent listings suggest the price (not the market) is what's stuck; bring a comps-based counter.
Risks & watch-outs
- Watch-outs: built in 1940 — expect roof / HVAC / electrical / plumbing capex.
- Climate carrying-cost: major wind risk, 68% chance of damaging wind over 30y; extreme-heat days projected 7→18/yr by 2055 (HVAC capex compounding) — expect insurance premiums to compound above CPI over the hold.
Questions for the listing agent
- It's been on market 144 days. Have you received any prior offers? Is the seller open to a 12% concession, seller financing, or rate buy-down credit?
- Can we see the unit-by-unit rent roll, current vacancy, and any below-market leases? What's the average tenancy length?
- What capital expenditures (roof, boiler, parking lot, exteriors) have been made in the last 5 years, and what's planned in the next 2?
- Built in 1940 — when were the roof, HVAC, electrical panel, plumbing, and water heater last replaced?
- Why hasn't it sold? Are there any deal-killer items the seller is aware of (foundation, flood, title, zoning, code violations)?
- Is there a deadline driving the sale (1031 exchange, divorce, estate, relocation)? That informs how much negotiation room exists.
- The area grade is low — what's the realistic commute time and amenity access for the typical tenant pool here? Any planned neighborhood developments (good or bad) we should know about?
- What's the average days-on-market for RENTAL listings here right now (not sales)? A rising rental-DOM trend means longer vacancies and softer asking-rent achievability than the comps imply.
- What's the recent tenant-quality profile in this submarket — average credit score on applications, eviction rate, late-payment / NSF rate, and stable-employment percentage? A property-management company in the area should have these aggregated.
- How much new apartment / multifamily construction is in the pipeline within 1–3 miles? Heavy new supply (>2% of stock underway) typically softens rents 12–24 months out; light construction supports rent growth.
Investment metrics
- 1% rule
- 1.01% ✓
- Cap rate
- 8.29%
- Cash-on-cash
- 7.14%
- DSCR
- 1.32
- GRM
- 8.3
CMA / ARV
- ARV (median comp)
- $130,301
- List price
- $195,000
- Delta
- 49.65%
- Verdict
- OVERPRICED
- Comps
- 6 within 2.0 mi
Projected returns pro-forma
-3.0% appreciation · 5.03% rent growth · sell at horizon
- IRR
- -3.3%
- Equity multiple
- 0.87×
- Total profit
- $-6,872
- Equity at exit
- $29,075
- IRR
- 8.4%
- Equity multiple
- 1.69×
- Total profit
- $37,936
- Equity at exit
- $16,860
Cash invested: $54,600 (down + closing). Projections, not guarantees.
Landlord ↔ Tenant lean methodology
- Overall (STATE)
- 90 Strongly Landlord-Friendly
- State Georgia
- 90 Strongly Landlord-Friendly · R+3
- County
- — inherits STATE
- City
- — inherits STATE
ZIP-level market 31206
- Rents YoY
- 5.0%
- Active inventory
- 207
- Price-to-rent
- 16.6×
Monthly cashflow live
- Estimated rent
- $1,960 high interval (Pro) →
- Mortgage (P&I)
- −$1,023
- Tax from tax record
- −$120 /mo · $1,437/yr
- Insurance
- −$81
- HOA
- −$0
- Vacancy / Maint / Mgmt
- −$412
- Net cashflow
- $325
Break-even live
2-unit breakdown (identical units grouped — click to expand)
| Units | Beds | Baths | Est. rent |
|---|---|---|---|
| 2× units | 2 | 1 | $1,960 |
| #1 | 2 | 1 | $980 |
| #2 | 2 | 1 | $980 |
| Total (2 units) | $1,960 | ||
UW: 25.0% down · 7.5% · 30yr · 1.5% tax · 5.0% vac · 8.0% maint · 8.0% mgmt
Financing live
Cash to close
- Down payment
- $48,750
- Closing costs
- $5,850
- Reserves months
- —
- Total cash needed
- —
Loan-product check · same deal, 3 products live
Conventional
25% down · 7.5% · 30yr
- Down + closing
- —
- Monthly P&I
- —
- Monthly cashflow
- —
- DSCR
- —
- Eligible?
- —
Personal DTI + credit; lowest rate.
DSCR
20% down · 8.5% · 30yr
- Down + closing
- —
- Monthly P&I
- —
- Monthly cashflow
- —
- DSCR
- —
- Eligible?
- —
No personal income docs; deal must DSCR.
Hard money
10% down · 12.0% · 12mo
- Down + closing
- —
- Monthly P&I
- —
- Monthly cashflow
- —
- DSCR
- —
- Eligible?
- —
Short-term bridge; refi at stabilization.
Rent comps 7 comps
| Address | Beds | Baths | Sqft | Rent | $/sqft | DOM | Units | Dist |
|---|---|---|---|---|---|---|---|---|
| 4052 Mikado Ave Macon, GA | 3.0 | 1.0 | 1624 | $1,300 | $0.80 | 13d | 1 | 0.14mi |
| 832 Richmond St Macon, GA | 3.0 | 1.0 | 1364 | $925 | $0.68 | 21d | 1 | 0.28mi |
| 1240 Rocky Creek Rd Unit A Macon, GA | 4.0 | 1.0 | 1342 | $1,090 | $0.81 | 21d | 1 | 0.33mi |
| 4322 Mikado Ave Macon, GA | 3.0 | 2.0 | 1344 | $1,230 | $0.92 | 21d | 1 | 0.35mi |
| 3709 Flamingo Dr Macon, GA | 3.0 | 1.0 | 1360 | $1,300 | $0.96 | 44d | 1 | 0.63mi |
| 1334 Dewey St Macon, GA | 3.0 | 2.0 | 1942 | $1,300 | $0.67 | 21d | 1 | 0.66mi |
| 645 Rutherford Ave Macon, GA | 4.0 | 2.0 | 1481 | $1,395 | $0.94 | 44d | 1 | 1.25mi |
Listing history 30 events
-
2026-06-19days on market $195,000 Active 144 DOM
-
2026-06-18days on market $195,000 Active 143 DOM
-
2026-06-17days on market $195,000 Active 142 DOM
-
2026-06-16days on market $195,000 Active 141 DOM
-
2026-06-15days on market $195,000 Active 140 DOM
-
2026-06-14days on market $195,000 Active 138 DOM
-
2026-06-13days on market $195,000 Active 137 DOM
-
2026-06-10days on market $195,000 Active 135 DOM
-
2026-06-09days on market $195,000 Active 134 DOM
-
2026-06-09days on market $195,000 Active 133 DOM
-
2026-06-07days on market $195,000 Active 132 DOM
-
2026-06-03days on market $195,000 Active 128 DOM
-
2026-06-02days on market $195,000 Active 127 DOM
-
2026-06-01days on market $195,000 Active 126 DOM
-
2026-05-31days on market $195,000 Active 125 DOM
-
2026-05-30days on market $195,000 Active 124 DOM
-
2026-01-26$195,000 New 286-char remark
Show marketing remark (286 chars)
INVESTMENT OPPORTUNITY! Renovated DUPLEX with paying tenants already in place. Tenants have a 12-month lease in place with Macon Housing Authority. Since tenants are in place - please text and we can arrange for showings ***24 HOUR NOTICE REQUIRED*** Close to 75, shopping and schools.
-
2026-01-26$195,000 Active 286-char remark
Show marketing remark (286 chars)
INVESTMENT OPPORTUNITY! Renovated DUPLEX with paying tenants already in place. Tenants have a 12-month lease in place with Macon Housing Authority. Since tenants are in place - please text and we can arrange for showings ***24 HOUR NOTICE REQUIRED*** Close to 75, shopping and schools.
-
2025-03-24soldstatus $185,000
-
2025-03-19soldstatus $185,000 Closed
-
2025-03-19soldstatus $185,000 Sold
-
2024-11-29$185,000 Active
-
2024-11-29$185,000 New
-
2022-07-05soldstatus $152,500
-
2022-06-24soldstatus $152,500
-
2022-06-24soldstatus $152,500 Sold
-
2022-06-07status Under Contract
-
2022-05-27$155,000
-
2022-05-27$155,000 New
-
1997-05-05soldstatus $24,000
ⓘ Source: listings_history table (triggers on properties + properties_extension) + one-shot
backfill from property_details.listing_events for pre-trigger history.
Tax reassessment forecast GA · Resets to sale price
- Current annual tax
- $1,437 · $120/mo
- Projected year-2 tax
- $1,794 · $150/mo
- Expected delta
- +$357/yr (+$30/mo · 24.9%)
ⓘ Screening estimate from a state-policy table — verify with the county assessor before closing.
Climate risk First Street
- Flood 1/10 Low FEMA zone X (unshaded) · 0% chance over 30 yrs
- Wildfire 1/10 Low
- Heat 7/10 Severe 7 d/yr ≥109°F today · 18 d/yr by 30 yrs out
- Wind 6/10 Major 68% chance of damaging wind over 30 yrs
- Air quality 3/10 Moderate 3 unhealthy d/yr today · 4 by 30 yrs out
Nearby sold comps map
Loading sold comps map…
Walkable amenities ~0.75 mi
Loading nearby amenities…
Taxation est. · year 1
- Rental income
- $23,520
- − Mortgage interest
- −$10,923
- − Property taxes
- −$1,437
- − Insurance
- −$975
- − Repairs & maintenance
- −$1,882
- − Management
- −$1,882
- − Depreciation
- −$5,673
- Taxable income
- $749
- Est. tax owed @ 24.0%
- −$180
- After-tax cash flow
- $3,718/yr
For passive investors: Depreciation is non-cash, so a rental often shows a tax loss while cash-flowing — sheltering income. Rental losses are passive: they offset passive income freely, and up to $25,000/yr can offset ordinary (W-2) income if you actively participate and your MAGI is under $100k (phasing out to $0 by $150k); unused losses carry forward. On sale, claimed depreciation is recaptured at up to 25%, and gains may owe capital-gains tax (a 1031 exchange can defer both). Figures are a year-1 estimate at your 24.0% rate — not tax advice; consult a CPA.
Schools (NCES district)
- District
- Bibb County
- NCES district ID
- 1300420
- Math proficiency
- 11% ▼ -14.00%
- Reading proficiency
- 18% ▼ -11.00%
- Median HH income
- $37,426
- Composite
- 12.13/100
- National rank
- #9654
- State rank
- #161 of 174 in GA
Livability — Macon-Bibb County
No livability data for this city. (Only ~50 U.S. cities are tracked.)
Census & demographics
- Census place
- Macon-Bibb County, GA
- County
- Bibb County · 164,332 people
- City population
- 143,186
- Metro
- Macon-Bibb County, GA
- Population (ZIP)
- 24,310
- Household income
- $30,042
- Rent vs Own
- Severe rent burden
- 1335.0
Population outlook (Bibb County) Hauer SSP2
- Today (2025)
- 148,772 people
- By 2030
- 145,904 · -1.9%
- By 2040
- 139,404 · -6.3%
- By 2050
- 131,603 · -11.5%
- By 2075
- 111,050 · -25.4%
- By 2100
- 83,346 · -44.0%
Race, ethnicity, and origin ACS 2023
- Neighborhood character
- Predominantly Black (76%)
- Race & ethnicity
- Black 76% White 12% Hispanic / Latino 8% Two or more races 4%
- Hispanic origin (detail)
- Mexican 5% Puerto Rican 1%
- Common ancestry
- Lithuanian 1% Italian 1%
- Foreign-born
- 4% · Canada
- Languages at home
- 91% English-only · Spanish 8%
Political lean MEDSL · Bibb
- 2024 margin
- Strong D (+22.4) · D 61.0% · R 38.5%
- 2008→2024 swing
- +4.4pp toward D · 2008: 18.0pp · 2024: 22.4pp
- All cycles
- 2024: D+22.4 2020: D+23.8 2016: D+20.2 2012: D+20.0 2008: D+18.0
Not yet ingested
- Civics
- —
Market trends
- HPI YoY
- ▼ -80.17%
- Current HPI
- 148.6765
- Rent YoY
- ▲ 5.03%
- Metro
- Macon-Bibb County, GA
- State GDP YoY
- ▲ 2.66%
- F500 in state
- 28
Industry mix (Fortune 500 HQ in GA)
| Industry | F500 HQs | Revenue |
|---|---|---|
| Paper / Packaging | 2 | $29B |
|
||
| Retail | 1 | $160B |
|
||
| Transportation / Logistics | 1 | $91B |
|
||
| Airlines | 1 | $62B |
|
||
| Consumer Goods | 1 | $47B |
|
||
| Utilities | 1 | $25B |
|
||
Price history
+712.5% since first listed14 events — show timeline
- 2026-01-26 Listed $195,000 FMLS
- 2026-01-26 Listed $195,000 GAMLS
- 2025-03-24 Sold (Public Records) $185,000 Public Records
- 2025-03-19 Sold (MLS) $185,000 GAMLS
- 2025-03-19 Sold (MLS) $185,000 FMLS
- 2024-11-29 Listed $185,000 GAMLS
- 2024-11-29 Listed $185,000 FMLS
- 2022-07-05 Sold (Public Records) $152,500 Public Records
- 2022-06-24 Sold (MLS) $152,500 GAMLS
- 2022-06-24 Sold (MLS) $152,500 MGMLS
- 2022-06-07 Pending — GAMLS
- 2022-05-27 Listed $155,000 GAMLS
- 2022-05-27 Listed $155,000 MGMLS
- 1997-05-05 Sold (Public Records) $24,000 Public Records
Property tax history
+21.9%/yrLatest (2025): $1,437 · +3.9% YoY. Source: county tax records.
Cash-flow waterfall
monthlySold comps — $/sqft
last 12 mo · ≤1 miLoading sold comps…