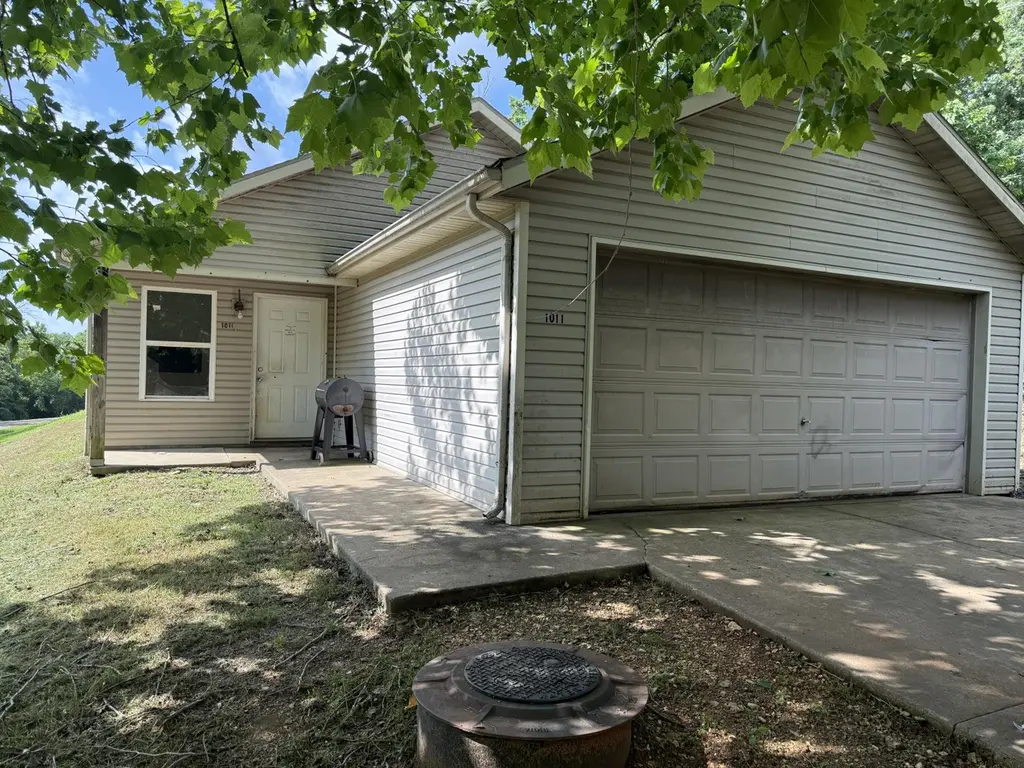
1011 Valley Rd · Merriam Woods, MO
Flood risk 1/10 · Minimal
- FEMA flood zone
- X (unshaded)
- Chance of flooding over 30 yrs
- 0.0%
- Est. flood insurance / yr
- $473 – $860
Fire risk 3/10 · Minor
- Est. fire insurance / yr
- $1,054 – $1,958
Heat risk 5/10 · Moderate
- Hot days now (above 106°F)
- 7 days/yr
- Hot days in 30 yrs
- 20 days/yr
Wind risk 2/10 · Minimal
- Chance of severe wind over 30 yrs
- 1.0%
Air-quality risk 2/10 · Minimal
- Unhealthy air days now
- 0 days/yr
- Unhealthy air days in 30 yrs
- 1 days/yr
Risk factors via First Street. Map © Google.
Why this score? — see what drove the B- grade
The composite is a weighted blend of 9 inputs, each scored 0–100. Each bar is that input's sub-score; the figure is the points it added to the 100-point composite (weight × sub-score).
- Cash flow +25.0/30.0
- Appreciation +10.0/10.0
- DSCR +8.1/10.0
- ARV discount +7.5/15.0
- 1% rule +5.7/10.0
- Schools +4.2/10.0
- Livability +3.1/5.0
- Rent growth +2.5/5.0
- Condition / age +2.5/5.0
$112,500
🖨 Deal sheet (PDF) 📄 Offer letter ✓ Due diligence
Listing remarks MLS
3 Bedroom 2 Bath with 2 car garage in Branson School district. Just 5 minutes to Lake Taneycomo and 15 minutes to Branson attractions and shopping. Home is currently tenant occupied, providing a great investment opportunity!
Key facts
- 6,534 sq ft lot
- 2 garage spots
- Built 2006
Property features AI
Exterior
- Parking: 2-car garage with garage door opener (garage faces front); Driveway and additional parking
- Utilities: Public water
- Home design: Single-family residence; One level; Vinyl siding exterior; Composition roof; Permanent slab foundation
- Construction: Built with vinyl siding
- Exterior features: Patio; Corner lot; Publicly maintained roads with gravel and concrete surfaces; City street frontage
Interior
- Flooring: Vinyl flooring
- Bathrooms: 2 full bathrooms
- Heating & cooling: Central heating (electric); Central air conditioning
- Interior features: Insulated, double-pane windows; Rain gutters
- Laundry & utility: Electric water heater
Neighborhood map
What this means for you Summary
Snapshot
- This is a 3-bed/2.0-bath other listed at $112k.
Deal economics
- At list price, monthly cash flow is $245 ($3k/yr) — positive.
- The deal already cash-flows at list — no discount required.
- Meets the 1% rule at list price ($1k rent vs $112k).
- Cap rate 8.9% vs local median 6.8% in Merriam Woods — top-decile yield for the area; either an underpriced asset or a hidden risk that comps aren't pricing in. Stress-test before assuming the spread holds.
Location & tenants
- Location reads 61/100 on livability (#444 in MO) — a middle-class / working-renter tenant base. Strengths: cost of living A+, housing A+, crime B; Watch: health & safety C-, amenities F, commute F.
- Branson R-IV (rural): math 48% / reading 52% proficiency, ranked #44 of 324 in MO (top 14%) — acceptable for families but not a draw, mixed tenant base, ~2y average lease.
- Zoned schools: Buchanan Elementary (math 62% / reading 67%, grade B, #70 of 1,115 statewide, top 8%, 594 students, 54% FRL); Branson Jr. High (math 48% / reading 49%, grade C-, #81 of 391 statewide, top 21%, 724 students, 51% FRL); Branson High (math 42% / reading 56%, grade D, #145 of 521 statewide, top 28%, 1,423 students, 46% FRL) — zoned schools at 50% FRL track the district average.
- Market conditions: 99 active listings in the ZIP; 1 comparable units currently listed for rent nearby; 331 units permitted in Taney County in 2024 (50 in 5+ unit buildings).
Forward outlook
- In year one you build about $12k of equity ($778 loan paydown + $11k appreciation (10.0% local appreciation)).
- Taney County population projected at +17% by 2050 — long-run rental-demand tailwind backs the buy-and-hold thesis.
- At projected returns (10.0% appreciation + 3.0% rent growth), your $32k cash investment doubles in ~3 years — after that, you're playing with house money.
- By year 3, paydown + projected appreciation supports a ~$30k cash-out refi (75% LTV) — recoverable capital for the next deal without selling this one.
Negotiation context
- Only 8 days on market — expect competitive offers; lowballing is unlikely to land.
- 2 sale attempts since 12y ago with the ask held roughly flat each time — persistent listings suggest the price (not the market) is what's stuck; bring a comps-based counter.
Risks & watch-outs
- Climate carrying-cost: extreme-heat days projected 7→20/yr by 2055 (HVAC capex compounding) — expect insurance premiums to compound above CPI over the hold.
Questions for the listing agent
- Is there a deadline driving the sale (1031 exchange, divorce, estate, relocation)? That informs how much negotiation room exists.
- Schools are F-rated, which usually means shorter tenancies and higher turnover. Who's the typical renter profile here, and what's been the actual vacancy rate?
- What's the average days-on-market for RENTAL listings here right now (not sales)? A rising rental-DOM trend means longer vacancies and softer asking-rent achievability than the comps imply.
- What's the recent tenant-quality profile in this submarket — average credit score on applications, eviction rate, late-payment / NSF rate, and stable-employment percentage? A property-management company in the area should have these aggregated.
- How much new for-sale + rental construction is in the pipeline within 1–3 miles? Heavy new supply typically softens prices + rents 12–24 months out; constrained supply supports both.
Investment metrics
- 1% rule
- 1.07% ✓
- Cap rate
- 8.90%
- Cash-on-cash
- 9.32%
- DSCR
- 1.41
- GRM
- 7.8
CMA / ARV
No comps found within radius.
Projected returns pro-forma
10.0% appreciation · 3.0% rent growth · sell at horizon
- IRR
- 31.1%
- Equity multiple
- 3.44×
- Total profit
- $76,818
- Equity at exit
- $101,349
- IRR
- 26.9%
- Equity multiple
- 7.79×
- Total profit
- $213,913
- Equity at exit
- $218,563
Cash invested: $31,500 (down + closing). Projections, not guarantees.
Landlord ↔ Tenant lean methodology
- Overall (STATE)
- 81 Strongly Landlord-Friendly
- State Missouri
- 81 Strongly Landlord-Friendly · R+10
- County
- — inherits STATE
- City
- — inherits STATE
ZIP-level market 65740
- Home prices YoY
- 11.6%
- Active inventory
- 99
- Price-to-rent
- 7.8×
Monthly cashflow live
- Estimated rent
- $1,200 medium interval (Pro) →
- Mortgage (P&I)
- −$590
- Tax from tax record
- −$67 /mo · $800/yr
- Insurance
- −$47
- HOA
- −$0
- Lot rent
- −$0
- Vacancy / Maint / Mgmt
- −$252
- Net cashflow
- $245
Break-even live
Sensitivity live
| Price | -10% $308 | -5% $276 | +0% $245 | +5% $213 | +10% $181 |
|---|---|---|---|---|---|
| Rent | -10% $150 | -5% $197 | +0% $245 | +5% $292 | +10% $339 |
| Rate | -1.0pp $301 | -0.5pp $273 | base $245 | +0.5pp $215 | +1.0pp $186 |
UW: 25.0% down · 7.5% · 30yr · 1.5% tax · 5.0% vac · 8.0% maint · 8.0% mgmt
Financing live
Cash to close
- Down payment
- $28,125
- Closing costs
- $3,375
- Reserves months
- —
- Total cash needed
- —
Loan-product check · same deal, 3 products live
Conventional
25% down · 7.5% · 30yr
- Down + closing
- —
- Monthly P&I
- —
- Monthly cashflow
- —
- DSCR
- —
- Eligible?
- —
Personal DTI + credit; lowest rate.
DSCR
20% down · 8.5% · 30yr
- Down + closing
- —
- Monthly P&I
- —
- Monthly cashflow
- —
- DSCR
- —
- Eligible?
- —
No personal income docs; deal must DSCR.
Hard money
10% down · 12.0% · 12mo
- Down + closing
- —
- Monthly P&I
- —
- Monthly cashflow
- —
- DSCR
- —
- Eligible?
- —
Short-term bridge; refi at stabilization.
Rent comps 1 comps
| Address | Beds | Baths | Sqft | Rent | $/sqft | DOM | Units | Dist |
|---|---|---|---|---|---|---|---|---|
| 2529 Missouri 176 Rockaway Beach, MO | 3.0 | 2.0 | 1230 | $1,200 | $0.98 | 46d | 1 | 1.08mi |
Listing history 8 events
-
2026-06-19status $112,500 Pending 8 DOM
-
2026-06-18days on market $112,500 Active 8 DOM
-
2026-06-17days on market $112,500 Active 7 DOM
-
2026-06-16days on market $112,500 Active 6 DOM
-
2026-06-15days on market $112,500 Active 5 DOM
-
2026-06-14days on market $112,500 Active 3 DOM
-
2026-06-12remarks 88-char remark
-
2026-06-12$112,500 Active 2 DOM
ⓘ Source: listings_history table (triggers on properties + properties_extension) + one-shot
backfill from property_details.listing_events for pre-trigger history.
Tax reassessment forecast MO · Resets to sale price
- Current annual tax
- $800 · $67/mo
- Projected year-2 tax
- $1,091 · $91/mo
- Expected delta
- +$292/yr (+$24/mo · 36.5%)
ⓘ Screening estimate from a state-policy table — verify with the county assessor before closing.
Climate risk First Street
- Flood 1/10 Low FEMA zone X (unshaded) · 0% chance over 30 yrs
- Wildfire 3/10 Moderate
- Heat 5/10 Major 7 d/yr ≥106°F today · 20 d/yr by 30 yrs out
- Wind 2/10 Low 100% chance of damaging wind over 30 yrs
- Air quality 2/10 Low 0 unhealthy d/yr today · 1 by 30 yrs out
Nearby sold comps map
Loading sold comps map…
Walkable amenities ~0.75 mi
Loading nearby amenities…
Taxation est. · year 1
- Rental income
- $14,400
- − Mortgage interest
- −$6,302
- − Property taxes
- −$800
- − Insurance
- −$562
- − Repairs & maintenance
- −$1,152
- − Management
- −$1,152
- − Depreciation
- −$3,273
- Taxable income
- $1,159
- Est. tax owed @ 24.0%
- −$278
- After-tax cash flow
- $2,656/yr
For passive investors: Depreciation is non-cash, so a rental often shows a tax loss while cash-flowing — sheltering income. Rental losses are passive: they offset passive income freely, and up to $25,000/yr can offset ordinary (W-2) income if you actively participate and your MAGI is under $100k (phasing out to $0 by $150k); unused losses carry forward. On sale, claimed depreciation is recaptured at up to 25%, and gains may owe capital-gains tax (a 1031 exchange can defer both). Figures are a year-1 estimate at your 24.0% rate — not tax advice; consult a CPA.
Schools (NCES district)
- District
- Branson R-IV
- NCES district ID
- 2905760
- Math proficiency
- 48% ▼ -6.00%
- Reading proficiency
- 52% ▼ -3.00%
- Median HH income
- $41,473
- Composite
- 41.96/100
- National rank
- #3347
- State rank
- #44 of 324 in MO
Livability — Merriam Woods
- Score
- 61/100
- State rank
- #444
- US rank
- #18151
Category grades
Schools grade is shown separately in the Schools card above.
Census & demographics
- Census place
- Merriam Woods, MO
- City population
- 3,495
- Population (ZIP)
- 3,495
Population outlook (Taney County) Hauer SSP2
- Today (2025)
- 59,017 people
- By 2030
- 61,235 · +3.8%
- By 2040
- 65,225 · +10.5%
- By 2050
- 68,842 · +16.6%
- By 2075
- 77,705 · +31.7%
- By 2100
- 82,002 · +38.9%
Race, ethnicity, and origin ACS 2023
- Neighborhood character
- Predominantly White (85%)
- Race & ethnicity
- White 85% Hispanic / Latino 9% Two or more races 8% Black 2%
- Hispanic origin (detail)
- Mexican 6%
- Common ancestry
- Slovak 3% Iranian 3% Lithuanian 1%
- Foreign-born
- 1% · Canada
- Languages at home
- 93% English-only · Spanish 6% German/W. Germanic 1%
Political lean MEDSL · Taney
- 2024 margin
- Solid R (+59.3) · D 19.9% · R 79.2%
- 2008→2024 swing
- -22.2pp toward R · 2008: -37.2pp · 2024: -59.3pp
- All cycles
- 2024: R+59.3 2020: R+57.7 2016: R+59.3 2012: R+47.4 2008: R+37.2
Not yet ingested
- Civics
- —
Market trends
- HPI YoY
- ▲ 30.18%
- Current HPI
- 291.5553
- Rent YoY
- —
- Metro
- —
- State GDP YoY
- ▲ 1.84%
- F500 in state
- 20
Industry mix (Fortune 500 HQ in MO)
| Industry | F500 HQs | Revenue |
|---|---|---|
| Healthcare | 1 | $163B |
|
||
| Insurance | 1 | $21B |
|
||
| Industrial Technology | 1 | $17B |
|
||
| Retail | 1 | $16B |
|
||
| Industrial Distribution | 1 | $10B |
|
||
| Utilities | 1 | $9B |
|
||
Price history
+164.7% since first listed5 events — show timeline
- 2026-06-10 Listed $112,500 SOMO
- 2014-10-16 Sold (MLS) — SOMO
- 2014-10-14 Sold (Public Records) — Public Records
- 2014-05-02 Listed $42,500 SOMO
- 2005-07-14 Sold (Public Records) — Public Records
Property tax history
+0.4%/yrLatest (2025): $800 · -17.1% YoY. Source: county tax records.
Cash-flow waterfall
monthlySold comps — $/sqft
last 12 mo · ≤1 miLoading sold comps…