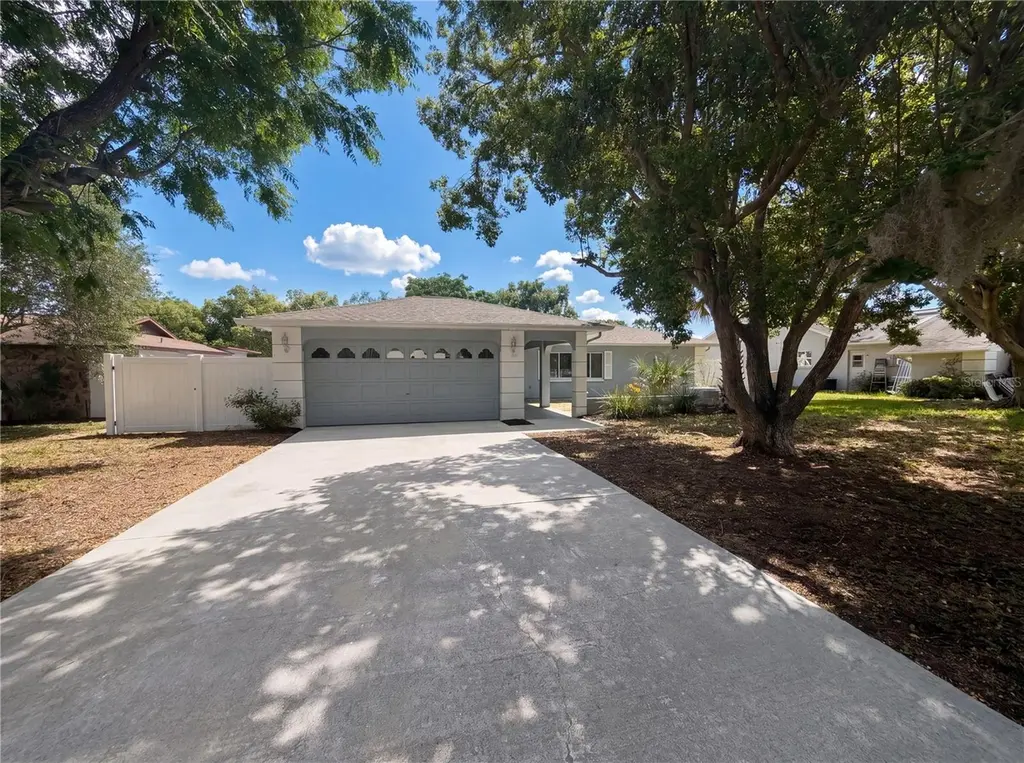
5134 Quintilis St · Spring Hill, FL
Flood risk 1/10 · Minimal
- FEMA flood zone
- X (unshaded)
- Chance of flooding over 30 yrs
- 0.0%
- Est. flood insurance / yr
- $507 – $1,088
Fire risk 4/10 · Minor
- Est. fire insurance / yr
- $947 – $1,759
Heat risk 10/10 · Severe
- Hot days now (above 109°F)
- 7 days/yr
- Hot days in 30 yrs
- 25 days/yr
Wind risk 10/10 · Severe
- Chance of severe wind over 30 yrs
- 99.0%
Air-quality risk 2/10 · Minimal
- Unhealthy air days now
- 2 days/yr
- Unhealthy air days in 30 yrs
- 2 days/yr
Risk factors via First Street. Map © Google.
Why this score? — see what drove the D grade
The composite is a weighted blend of 9 inputs, each scored 0–100. Each bar is that input's sub-score; the figure is the points it added to the 100-point composite (weight × sub-score).
- Cash flow +13.8/30.0
- ARV discount +10.6/15.0
- DSCR +4.2/10.0
- Schools +4.2/10.0
- Livability +3.2/5.0
- 1% rule +2.8/10.0
- Condition / age +2.5/5.0
- Rent growth +2.3/5.0
- Appreciation +0.0/10.0
$247,000
🖨 Deal sheet 📄 Offer letter ✓ Due diligence
Listing remarks
Check out 5134 Quintilis St, recently enhanced with fresh interior paint throughout the living areas. The kitchen contains an accent backsplash and is equipped with stainless steel appliances for convenient daily use. Exterior features include a functional fenced in backyard, suitable for various outdoor activities. This move-in ready home blends modern updates with practical living. Included 100-Day Home Warranty with buyer activation
Key facts
- Fenced in backyard
- Fresh interior paint
- Accent backsplash
Tags
Property features AI
Finance
- Other: Property type: Residential - Single Family Residence; Zoned RES; Total living area reported as 1,359 square feet
- Financial info: Lease restrictions apply
- HOA & community: No association fees; No community amenities listed
Exterior
- Parking: Driveway with tandem parking; Attached 2-car garage
- Security: Owned security system
- Utilities: Public water; Septic tank sewer; Electricity available; Water available
- Home design: Single-family residence; One story; Faces southeast
- Construction: Stucco construction; Shingle roof; Slab foundation; Built on 0.2-acre lot
- Exterior features: Other exterior features; Concrete road access
Interior
- Kitchen: Dishwasher; Microwave; Electric water heater
- Bedrooms: 2 bedrooms
- Flooring: Carpet; Laminate
- Bathrooms: 2 full bathrooms
- Heating & cooling: Central heating; No central cooling
- Interior features: Ceiling fans; Eat-in kitchen; Stone counters; Security system (owned)
- Laundry & utility: Laundry area in garage
Neighborhood map
What this means for you Summary
Snapshot
- This is a 2-bed/2.0-bath single-family listed at $247k.
Deal economics
- At list price, monthly cash flow is $23 ($272/yr) — positive.
- The deal already cash-flows at list — no discount required.
- To meet the 1% rule (rent ≥ 1% of price), the offer needs to be $192k (22.1% below list).
- Recommended offer: $192k (22.1% below list) — sets the bar for 1% rule.
- Cap rate 6.4% vs local median 4.4% in Spring Hill — top-decile yield for the area; either an underpriced asset or a hidden risk that comps aren't pricing in. Stress-test before assuming the spread holds.
Location & tenants
- Location reads 63/100 on livability (#738 in FL) — a middle-class / working-renter tenant base. Strengths: cost of living A+, housing A+; Watch: health & safety C-, employment D+, amenities F.
- Hernando (suburban): math 50% / reading 50% proficiency, ranked #38 of 73 in FL (top 52%) — acceptable for families but not a draw, mixed tenant base, ~2y average lease.
- Market conditions: Rents soft (-0.7%/yr); 381 active listings in the ZIP; 28 comparable units currently listed for rent nearby; rentals at typical pace (median 25d on market — plan ~3-4 weeks tenant-placement turnaround); 2,505 units permitted in Hernando County in 2024 (318 in 5+ unit buildings).
- This rent runs 36% of the median local income ($64k/yr) — at the standard rent-burdened threshold; future hikes will face affordability resistance.
Forward outlook
- Local home prices are declining (-3.0%/yr); year-one equity from $2k of loan paydown is wiped out by about $7k of value loss. Plan a longer hold.
- Hernando County population projected at +11% by 2050 — modest demand growth; plan on rents tracking national, not racing it.
Negotiation context
- Only 13 days on market — expect competitive offers; lowballing is unlikely to land.
Risks & watch-outs
- Climate carrying-cost: severe wind risk, 99% chance of damaging wind over 30y; extreme-heat days projected 7→25/yr by 2055 (HVAC capex compounding) — expect insurance premiums to compound above CPI over the hold.
Questions for the listing agent
- Is there a deadline driving the sale (1031 exchange, divorce, estate, relocation)? That informs how much negotiation room exists.
- The area grade is low — what's the realistic commute time and amenity access for the typical tenant pool here? Any planned neighborhood developments (good or bad) we should know about?
- What's the average days-on-market for RENTAL listings here right now (not sales)? A rising rental-DOM trend means longer vacancies and softer asking-rent achievability than the comps imply.
- What's the recent tenant-quality profile in this submarket — average credit score on applications, eviction rate, late-payment / NSF rate, and stable-employment percentage? A property-management company in the area should have these aggregated.
- How much new for-sale + rental construction is in the pipeline within 1–3 miles? Heavy new supply typically softens prices + rents 12–24 months out; constrained supply supports both.
Investment metrics
- 1% rule
- 0.78% ✗
- Cap rate
- 6.40%
- Cash-on-cash
- 0.39%
- DSCR
- 1.02
- GRM
- 10.7
CMA / ARV
- ARV (on-the-fly)
- $265,005
- Comps found
- 12
Show comp detail 12 sales within ~0.75 mi
| Address | Dist | Beds/Ba | Sqft | Sold | Price | $/sf | Match |
|---|---|---|---|---|---|---|---|
| 11523 Norvell Rd | 0.06mi | 3/2.0 (+1) | 1,349 (-1%) | 2mo | $275,000 | $204 | 89 |
| 11329 Sheffield Rd | 0.34mi | 2/2.0 | 1,298 (-4%) | 2mo | $300,000 | $231 | 75 |
| 5101 Elwood Rd | 0.37mi | 3/2.0 (+1) | 1,391 (+2%) | 1mo | $232,000 | $167 | 73 |
| 11224 Sheffield Rd | 0.50mi | 2/2.0 | 1,325 (-2%) | 0mo | $289,900 | $219 | 72 |
| 11349 Sand Hill Ave | 0.22mi | 3/2.0 (+1) | 1,473 (+8%) | 0mo | $340,000 | $231 | 71 |
| 5051 Teather St | 0.47mi | 3/2.0 (+1) | 1,330 (-2%) | 2mo | $240,000 | $180 | 68 |
| 5284 Hanford Ave | 0.47mi | 2/3.0 | 1,309 (-4%) | 2mo | $255,000 | $195 | 66 |
| 5078 Kenmore St | 0.39mi | 3/2.0 (+1) | 1,452 (+7%) | 3mo | $260,000 | $179 | 63 |
| 11117 Thornberry Dr | 0.65mi | 3/2.0 (+1) | 1,452 (+7%) | 0mo | $280,000 | $193 | 53 |
| 12076 Elgin Blvd | 0.45mi | 3/2.0 (+1) | 1,534 (+13%) | 2mo | $280,000 | $183 | 51 |
| 4299 Dristol Ave | 0.72mi | 3/2.0 (+1) | 1,529 (+12%) | 2mo | $295,000 | $193 | 39 |
| 5068 Harbinger Rd | 0.72mi | 3/2.0 (+1) | 1,542 (+14%) | 0mo | $340,000 | $220 | 38 |
Match score weights: distance 35% · size 25% · config 20% · recency 20%. Top-matched comps best support the ARV.
Projected returns pro-forma
-3.0% appreciation · 0.0% rent growth · sell at horizon
- IRR
- -18.7%
- Equity multiple
- 0.36×
- Total profit
- $-44,320
- Equity at exit
- $36,829
- IRR
- -17.7%
- Equity multiple
- 0.15×
- Total profit
- $-58,932
- Equity at exit
- $21,356
Cash invested: $69,160 (down + closing). Projections, not guarantees.
Landlord ↔ Tenant lean methodology
- Overall (STATE)
- 87 Strongly Landlord-Friendly
- State Florida
- 87 Strongly Landlord-Friendly · R+3
- County
- — inherits STATE
- City
- — inherits STATE
ZIP-level market 34608
- Home prices YoY
- -24.7%
- Rents YoY
- -0.7%
- Active inventory
- 381
- Price-to-rent
- 10.7×
Monthly cashflow live
- Estimated rent
- $1,924 high interval (Pro) →
- Mortgage (P&I)
- −$1,295
- Tax from tax record
- −$99 /mo · $1,191/yr
- Insurance
- −$103
- HOA
- −$0
- Vacancy / Maint / Mgmt
- −$404
- Net cashflow
- $23
Break-even live
UW: 25.0% down · 7.5% · 30yr · 1.5% tax · 5.0% vac · 8.0% maint · 8.0% mgmt
Financing live
Cash to close
- Down payment
- $61,750
- Closing costs
- $7,410
- Reserves months
- —
- Total cash needed
- —
Loan-product check · same deal, 3 products live
Conventional
25% down · 7.5% · 30yr
- Down + closing
- —
- Monthly P&I
- —
- Monthly cashflow
- —
- DSCR
- —
- Eligible?
- —
Personal DTI + credit; lowest rate.
DSCR
20% down · 8.5% · 30yr
- Down + closing
- —
- Monthly P&I
- —
- Monthly cashflow
- —
- DSCR
- —
- Eligible?
- —
No personal income docs; deal must DSCR.
Hard money
10% down · 12.0% · 12mo
- Down + closing
- —
- Monthly P&I
- —
- Monthly cashflow
- —
- DSCR
- —
- Eligible?
- —
Short-term bridge; refi at stabilization.
Rent comps 28 comps
| Address | Beds | Baths | Sqft | Rent | $/sqft | DOM | Units | Dist |
|---|---|---|---|---|---|---|---|---|
| 11349 Sand Hill Ave Spring Hill, FL | 3.0 | 2.0 | 1473 | $2,500 | $1.70 | 3d | 1 | 0.20mi |
| 5294 Fairhaven Ave Spring Hill, FL | 2.0 | 2.0 | 1105 | $1,600 | $1.45 | 24d | 1 | 0.38mi |
| 11201 Kangley Ln Spring Hill, FL | 2.0 | 2.0 | 1105 | $1,695 | $1.53 | 5d | 1 | 0.47mi |
| 12095 Elgin Blvd Spring Hill, FL | 3.0 | 2.0 | 1284 | $1,849 | $1.44 | 24d | 1 | 0.52mi |
| 5363 Pierpoint Ave Spring Hill, FL | 3.0 | 2.0 | 1722 | $2,200 | $1.28 | 24d | 1 | 0.57mi |
| 5327 Baldock Ave Spring Hill, FL | 3.0 | 2.0 | 1711 | $1,995 | $1.17 | 18d | 1 | 0.62mi |
| 4518 Yorkshire Ave Spring Hill, FL | 2.0 | 1.5 | 1119 | $1,600 | $1.43 | 24d | 1 | 0.80mi |
| 4503 Higate Rd Spring Hill, FL | 2.0 | 2.0 | 1025 | $1,495 | $1.46 | 24d | 1 | 0.83mi |
| 10449 Mayflower Rd Spring Hill, FL | 3.0 | 2.0 | 1502 | $1,849 | $1.23 | 20d | 1 | 0.94mi |
| 4449 Chamber Ct Spring Hill, FL | 3.0 | 2.0 | 1608 | $1,895 | $1.18 | 24d | 1 | 1.03mi |
| 4253 Central Park Dr Spring Hill, FL | 2.0–3.0 | 2.0 | 1107 | $1,445 | $1.31 | 2d | 8 | 1.07mi |
| 10436 Keystone St Spring Hill, FL | 2.0 | 2.0 | 1289 | $1,841 | $1.43 | 2d | 1 | 1.09mi |
| 11404 Pike Ave Spring Hill, FL | 3.0 | 2.0 | 1614 | $1,795 | $1.11 | 5d | 1 | 1.14mi |
| 12454 Seagate St Spring Hill, FL | 3.0 | 2.0 | 1114 | $1,735 | $1.56 | 24d | 1 | 1.16mi |
| 4036 Montano Ave Spring Hill, FL | 3.0 | 2.0 | 1600 | $2,380 | $1.49 | 24d | 1 | 1.17mi |
| 2459 Landover Blvd Spring Hill, FL | 3.0 | 2.0 | 1139 | $1,900 | $1.67 | 22d | 1 | 1.22mi |
| 4224 Portillo Rd Spring Hill, FL | 2.0 | 2.0 | 1100 | $1,462 | $1.33 | 24d | 3 | 1.27mi |
| 13097 Scottville St Unit 1234463P Spring Hill, FL | 3.0 | 2.0 | 1463 | $3,890 | $2.66 | 2d | 1 | 1.34mi |
| 4208 Jason Rd Spring Hill, FL | 2.0 | 2.0 | 1038 | $1,500 | $1.45 | 24d | 1 | 1.38mi |
| 2634 Landover Blvd Spring Hill, FL | 2.0 | 2.0 | 1021 | $1,250 | $1.22 | 18d | 1 | 1.44mi |
| 5038 Ayrshire Dr Spring Hill, FL | 3.0 | 2.0 | 1418 | $1,850 | $1.30 | 22d | 1 | 1.45mi |
| 10490 Chalmer St Apt 3 Spring Hill, FL | 2.0 | 2.0 | 1050 | $1,550 | $1.48 | 24d | 1 | 1.45mi |
| 4028 Portillo Rd Spring Hill, FL | 2.0 | 2.0 | 1032 | $1,475 | $1.43 | 3d | 1 | 1.46mi |
| 4154 Obsidian Dr Spring Hill, FL | 3.0 | 2.0 | 1662 | $2,149 | $1.29 | 15d | 1 | 1.47mi |
| 2787 Landover Blvd Spring Hill, FL | 2.0 | 1.5 | 1200 | $1,350 | $1.12 | 24d | 1 | 1.47mi |
| 2781 Landover Blvd Spring Hill, FL | 2.0 | 1.5 | 1200 | $1,350 | $1.12 | 24d | 1 | 1.47mi |
| 3646 Portillo Rd Spring Hill, FL | 3.0 | 2.0 | 1304 | $1,950 | $1.50 | 24d | 1 | 1.49mi |
| 4353 Azora Rd Spring Hill, FL | 2.0 | 2.0 | 979 | $1,650 | $1.69 | 24d | 1 | 1.49mi |
Listing history 10 events
-
2026-06-08status $247,000 Pending 13 DOM
-
2026-06-07days on market $247,000 Active 13 DOM
-
2026-06-04days on market $247,000 Active 10 DOM
-
2026-06-03days on market $247,000 Active 9 DOM
-
2026-06-02days on market $247,000 Active 8 DOM
-
2026-06-01days on market $247,000 Active 7 DOM
-
2026-05-31days on market $247,000 Active 6 DOM
-
2026-05-21status Pending
-
2026-05-19$247,000 Active
-
2026-04-23soldstatus $216,500
ⓘ Source: listings_history table (triggers on properties + properties_extension) + one-shot
backfill from property_details.listing_events for pre-trigger history.
Tax reassessment forecast FL · Resets to sale price
- Current annual tax
- $1,191 · $99/mo
- Projected year-2 tax
- $2,050 · $171/mo
- Expected delta
- +$859/yr (+$72/mo · 72.2%)
ⓘ Screening estimate from a state-policy table — verify with the county assessor before closing.
Climate risk First Street
- Flood 1/10 Low FEMA zone X (unshaded) · 0% chance over 30 yrs
- Wildfire 4/10 Moderate
- Heat 10/10 Extreme 7 d/yr ≥109°F today · 25 d/yr by 30 yrs out
- Wind 10/10 Extreme 99% chance of damaging wind over 30 yrs
- Air quality 2/10 Low 2 unhealthy d/yr today · 2 by 30 yrs out
Nearby sold comps map
Loading sold comps map…
Walkable amenities ~0.75 mi
Loading nearby amenities…
Taxation est. · year 1
- Rental income
- $23,090
- − Mortgage interest
- −$13,836
- − Property taxes
- −$1,191
- − Insurance
- −$1,235
- − Repairs & maintenance
- −$1,847
- − Management
- −$1,847
- − Depreciation
- −$7,185
- Taxable loss
- −$4,051
- Est. tax savings @ 24.0%
- +$972
- After-tax cash flow
- $1,244/yr
For passive investors: Depreciation is non-cash, so a rental often shows a tax loss while cash-flowing — sheltering income. Rental losses are passive: they offset passive income freely, and up to $25,000/yr can offset ordinary (W-2) income if you actively participate and your MAGI is under $100k (phasing out to $0 by $150k); unused losses carry forward. On sale, claimed depreciation is recaptured at up to 25%, and gains may owe capital-gains tax (a 1031 exchange can defer both). Figures are a year-1 estimate at your 24.0% rate — not tax advice; consult a CPA.
Schools (NCES district)
- District
- Hernando
- NCES district ID
- 1200810
- Math proficiency
- 50% ▼ -8.00%
- Reading proficiency
- 50% ▼ -4.00%
- Median HH income
- $41,985
- Composite
- 42.03/100
- National rank
- #3329
- State rank
- #38 of 73 in FL
Livability — Spring Hill
- Score
- 63/100
- State rank
- #738
- US rank
- #15937
Category grades
Schools grade is shown separately in the Schools card above.
Census & demographics
- Census place
- Spring Hill, FL
- County
- Hernando County · 169,677 people
- City population
- 83,915
- Metro
- Tampa-St. Petersburg-Clearwater, FL
- Population (ZIP)
- 36,658
- Household income
- $64,345
- Rent vs Own
- Severe rent burden
- 647.0
Population outlook (Hernando County) Hauer SSP2
- Today (2025)
- 189,218 people
- By 2030
- 194,367 · +2.7%
- By 2040
- 203,398 · +7.5%
- By 2050
- 209,589 · +10.8%
- By 2075
- 218,452 · +15.4%
- By 2100
- 205,923 · +8.8%
Race, ethnicity, and origin ACS 2023
- Neighborhood character
- Predominantly White (71%)
- Race & ethnicity
- White 71% Hispanic / Latino 18% Two or more races 11% Black 4% Asian 2%
- Hispanic origin (detail)
- Puerto Rican 9% Cuban 3%
- Common ancestry
- Slovak 4% Romanian 3% Lithuanian 3%
- Foreign-born
- 9% · Canada, Jamaica, China
- Languages at home
- 87% English-only · Spanish 9% Other Indo-European 2% French/Haitian/Cajun 1%
Political lean MEDSL · Hernando
- 2024 margin
- Solid R (+37.0) · D 31.1% · R 68.2%
- 2008→2024 swing
- -33.5pp toward R · 2008: -3.6pp · 2024: -37.0pp
- All cycles
- 2024: R+37.0 2020: R+30.2 2016: R+29.0 2012: R+8.5 2008: R+3.6
Not yet ingested
- Civics
- —
Market trends
- HPI YoY
- ▼ -99.94%
- Current HPI
- 305.1933
- Rent YoY
- ▼ -0.68%
- Metro
- Tampa-St. Petersburg-Clearwater, FL
- State GDP YoY
- ▲ 3.28%
- F500 in state
- 36
Industry mix (Fortune 500 HQ in FL)
| Industry | F500 HQs | Revenue |
|---|---|---|
| Industrial Technology | 2 | $29B |
|
||
| Insurance | 2 | $17B |
|
||
| Retail | 1 | $60B |
|
||
| Technology Distribution | 1 | $58B |
|
||
| Homebuilding | 1 | $35B |
|
||
| Technology Manufacturing | 1 | $35B |
|
||
Price history
+14.1% since first listed3 events — show timeline
- 2026-05-21 Pending — Stellar MLS as Distributed by MLS Grid
- 2026-05-19 Listed $247,000 Stellar MLS as Distributed by MLS Grid
- 2026-04-23 Sold (Public Records) $216,500 Public Records
Property tax history
+4.9%/yrLatest (2025): $1,191 · +0.8% YoY. Source: county tax records.
Cash-flow waterfall
monthlySold comps — $/sqft
last 12 mo · ≤1 miLoading sold comps…