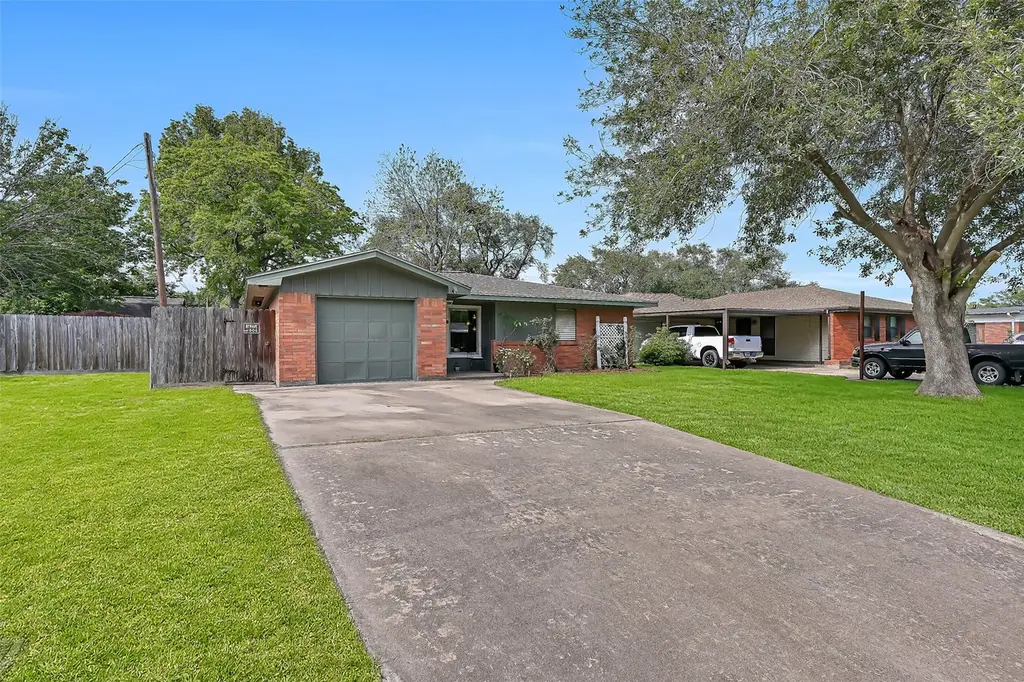
2826 5th Ave N · Texas City, TX
Flood risk 8/10 · Major
- FEMA flood zone
- X
- Chance of flooding over 30 yrs
- 0.6%
- Est. flood insurance / yr
- $507 – $1,088
Fire risk 1/10 · Minimal
- Est. fire insurance / yr
- $1,222 – $2,270
Heat risk 10/10 · Severe
- Hot days now (above 109°F)
- 7 days/yr
- Hot days in 30 yrs
- 28 days/yr
Wind risk 9/10 · Severe
- Chance of severe wind over 30 yrs
- 99.0%
Air-quality risk 2/10 · Minimal
- Unhealthy air days now
- 2 days/yr
- Unhealthy air days in 30 yrs
- 2 days/yr
Risk factors via First Street. Map © Google.
Why this score? — see what drove the D+ grade
The composite is a weighted blend of 9 inputs, each scored 0–100. Each bar is that input's sub-score; the figure is the points it added to the 100-point composite (weight × sub-score).
- Cash flow +15.7/30.0
- ARV discount +8.7/15.0
- DSCR +4.8/10.0
- 1% rule +4.6/10.0
- Rent growth +3.7/5.0
- Livability +3.1/5.0
- Condition / age +2.5/5.0
- Schools +2.4/10.0
- Appreciation +0.0/10.0
$159,900
🖨 Deal sheet (PDF) 📄 Offer letter ✓ Due diligence
Listing remarks
Whether you're buying your very first home or searching for a solid investment property to add to your portfolio, this one is definitely worth a look. Conveniently located near shopping, schools and restaurants, this 3-bedroom, 1 bath home, 1 car garage sits in a quiet neighborhood on a 9700sf lot with alley access. Whether you’re dreaming of hosting backyard gatherings, expanding the existing home, even adding extra garage space or a workshop, the possibilities here are wide open. Important updates have already been taken care of, including a new roof installed after Hurricane Ike and an HVAC system added in 2022, giving you peace of mind on some of the bigger-ticket items. Even more
Key facts
- 9,239 sq ft lot
- Garage
- Built 1961
Property features AI
Finance
- Other: Lot dimensions approximately 56 x 166 (about 0.21 acre); Located in a subdivision
- Financial info: Lease not considered
Exterior
- Parking: Attached garage (1 space); Alley access
- Utilities: Public water; Public sewer; Concrete road access
- Home design: Residential property; Faces south; Single-story (first-floor living); Full ownership
- Construction: Brick construction; Composition roof; Slab foundation; Built in 1961
- Exterior features: Fenced backyard; Private yard; Front porch
Interior
- Kitchen: Gas oven; Gas range
- Bedrooms: Primary bedroom on the first floor (14 x 10); Bedroom on the first floor (14 x 10); Bedroom on the first floor (10 x 9); Up to 3 bedrooms possible
- Flooring: Carpet; Tile
- Bathrooms: 1 full bathroom
- Heating & cooling: Central electric heating; Central electric air conditioning
- Interior features: Tub/shower; No fireplaces; 7 total rooms
- Laundry & utility: Washer hookup; Electric dryer hookup; Gas dryer hookup
Neighborhood map
What this means for you Summary
Snapshot
- This is a 3-bed/1.0-bath single-family listed at $160k.
Deal economics
- At list price, monthly cash flow is $4 ($53/yr) — positive.
- The deal already cash-flows at list — no discount required.
- To meet the 1% rule (rent ≥ 1% of price), the offer needs to be $154k (3.9% below list).
- Recommended offer: $154k (3.9% below list) — sets the bar for 1% rule.
- Cap rate 6.8% vs local median 4.3% in Texas City — top-decile yield for the area; either an underpriced asset or a hidden risk that comps aren't pricing in. Stress-test before assuming the spread holds.
Location & tenants
- Location reads 62/100 on livability (#907 in TX) — a middle-class / working-renter tenant base. Strengths: cost of living A+, housing A+; Watch: crime D+, amenities F, commute F.
- Texas City ISD (suburban): math 28% / reading 29% proficiency, ranked #655 of 826 in TX (top 79%) — low school quality limits family demand, transient renter base, plan for 1-2y turnover; 66% free/reduced lunch — lower-income household profile, screen leases tightly.
- Zoned schools: Blocker Middle (math 33% / reading 36%, grade F, #858 of 1,662 statewide, top 54%, 865 students, 80% FRL); Texas City H S (math 32% / reading 36%, grade F, #1,002 of 1,632 statewide, top 62%, 1,718 students, 72% FRL).
- Market conditions: Rents rising fast (+4.9%/yr); 296 active listings in the ZIP; 19 comparable units currently listed for rent nearby; rentals at typical pace (median 23d on market — plan ~3-4 weeks tenant-placement turnaround); 3,258 units permitted in Galveston County in 2024 (0 in 5+ unit buildings).
Forward outlook
- Local home prices are declining (-3.0%/yr); year-one equity from $1k of loan paydown is wiped out by about $5k of value loss. Plan a longer hold.
- Galveston County population projected at +43% by 2050 — long-run rental-demand tailwind backs the buy-and-hold thesis.
Negotiation context
- Only 12 days on market — expect competitive offers; lowballing is unlikely to land.
Risks & watch-outs
- Watch-outs: flood insurance adds $66/mo.
- Climate carrying-cost: severe flood risk; severe wind risk, 99% chance of damaging wind over 30y; extreme-heat days projected 7→28/yr by 2055 (HVAC capex compounding) — expect insurance premiums to compound above CPI over the hold.
Questions for the listing agent
- Built in 1961 — when were the roof, HVAC, electrical panel, plumbing, and water heater last replaced?
- What's the actual annual flood-insurance premium (NFIP or private), and is the property in a SFHA with mandatory coverage?
- Is there a deadline driving the sale (1031 exchange, divorce, estate, relocation)? That informs how much negotiation room exists.
- Schools are F-rated, which usually means shorter tenancies and higher turnover. Who's the typical renter profile here, and what's been the actual vacancy rate?
- Crime grade is D in this area — have there been break-ins, vandalism, or insurance claims at this property in the last 3 years? What carrier currently insures it and at what premium?
- The area grade is low — what's the realistic commute time and amenity access for the typical tenant pool here? Any planned neighborhood developments (good or bad) we should know about?
- What's the average days-on-market for RENTAL listings here right now (not sales)? A rising rental-DOM trend means longer vacancies and softer asking-rent achievability than the comps imply.
- What's the recent tenant-quality profile in this submarket — average credit score on applications, eviction rate, late-payment / NSF rate, and stable-employment percentage? A property-management company in the area should have these aggregated.
- How much new for-sale + rental construction is in the pipeline within 1–3 miles? Heavy new supply typically softens prices + rents 12–24 months out; constrained supply supports both.
Investment metrics
- 1% rule
- 0.96% ✗
- Cap rate
- 6.82%
- Cash-on-cash
- 1.90%
- DSCR
- 1.08
- GRM
- 8.7
CMA / ARV
- ARV (median comp)
- $164,265
- List price
- $159,900
- Delta
- -2.66%
- Verdict
- FAIR
- Comps
- 20 within 1.0 mi
Show comp detail 12 sales within ~0.75 mi
| Address | Dist | Beds/Ba | Sqft | Sold | Price | $/sf | Match |
|---|---|---|---|---|---|---|---|
| 2613 7th Ave N | 0.25mi | 3/1.5 | 1,100 (-3%) | 1mo | $155,000 | $141 | 80 |
| 2805 2nd Ave N | 0.27mi | 3/2.0 | 1,150 (+2%) | 4mo | $197,000 | $171 | 78 |
| 2902 Tarpey Ave | 0.11mi | 3/1.0 | 1,017 (-10%) | 5mo | $145,000 | $143 | 74 |
| 2921 Tarpey Ave | 0.16mi | 3/1.0 | 1,019 (-10%) | 6mo | $135,000 | $132 | 71 |
| 2312 6th Ave N | 0.52mi | 3/1.0 | 1,100 (-3%) | 1mo | $165,000 | $150 | 70 |
| 3026 Danforth Memorial Dr | 0.22mi | 3/1.0 | 1,004 (-11%) | 4mo | $187,000 | $186 | 68 |
| 205 N Logan St | 0.40mi | 3/1.0 | 1,230 (+9%) | 5mo | $130,000 | $106 | 63 |
| 2906 Somerset Ave | 0.16mi | 3/2.0 | 1,297 (+14%) | 3mo | $185,880 | $143 | 62 |
| 3025 15th Ave N | 0.59mi | 3/1.5 | 1,080 (-5%) | 5mo | $194,000 | $180 | 59 |
| 2131 6th Ave N | 0.63mi | 3/1.0 | 1,228 (+8%) | 7mo | $169,000 | $138 | 51 |
| 3134 7th Ave N | 0.38mi | 4/1.0 (+1) | 1,274 (+12%) | 6mo | $169,900 | $133 | 51 |
| 3221 Texas Ave | 0.62mi | 3/2.0 | 976 (-14%) | 5mo | $159,000 | $163 | 40 |
Match score weights: distance 35% · size 25% · config 20% · recency 20%. Top-matched comps best support the ARV.
Projected returns pro-forma
-3.0% appreciation · 4.91% rent growth · sell at horizon
- IRR
- -13.7%
- Equity multiple
- 0.50×
- Total profit
- $-22,533
- Equity at exit
- $23,842
- IRR
- -1.8%
- Equity multiple
- 0.86×
- Total profit
- $-6,067
- Equity at exit
- $13,825
Cash invested: $44,772 (down + closing). Projections, not guarantees.
Landlord ↔ Tenant lean methodology
- Overall (STATE)
- 87 Strongly Landlord-Friendly
- State Texas
- 87 Strongly Landlord-Friendly · R+5
- County
- — inherits STATE
- City
- — inherits STATE
ZIP-level market 77590
- Home prices YoY
- -19.3%
- Rents YoY
- 4.9%
- Active inventory
- 296
- Price-to-rent
- 8.7×
Monthly cashflow live
- Estimated rent
- $1,536 high interval (Pro) →
- Mortgage (P&I)
- −$839
- Tax from tax record
- −$238 /mo · $2,851/yr
- Insurance
- −$67
- Flood insurance flood zone
- −$66 /mo · $798/yr
- HOA
- −$0
- Vacancy / Maint / Mgmt
- −$323
- Net cashflow
- $4
Break-even live
Sensitivity live
| Price | -10% $95 | -5% $50 | +0% $4 | +5% $-41 | +10% $-86 |
|---|---|---|---|---|---|
| Rent | -10% $-117 | -5% $-56 | +0% $4 | +5% $65 | +10% $126 |
| Rate | -1.0pp $85 | -0.5pp $45 | base $4 | +0.5pp $-37 | +1.0pp $-79 |
UW: 25.0% down · 7.5% · 30yr · 1.5% tax · 5.0% vac · 8.0% maint · 8.0% mgmt
Financing live
Cash to close
- Down payment
- $39,975
- Closing costs
- $4,797
- Reserves months
- —
- Total cash needed
- —
Loan-product check · same deal, 3 products live
Conventional
25% down · 7.5% · 30yr
- Down + closing
- —
- Monthly P&I
- —
- Monthly cashflow
- —
- DSCR
- —
- Eligible?
- —
Personal DTI + credit; lowest rate.
DSCR
20% down · 8.5% · 30yr
- Down + closing
- —
- Monthly P&I
- —
- Monthly cashflow
- —
- DSCR
- —
- Eligible?
- —
No personal income docs; deal must DSCR.
Hard money
10% down · 12.0% · 12mo
- Down + closing
- —
- Monthly P&I
- —
- Monthly cashflow
- —
- DSCR
- —
- Eligible?
- —
Short-term bridge; refi at stabilization.
Rent comps 19 comps
| Address | Beds | Baths | Sqft | Rent | $/sqft | DOM | Units | Dist |
|---|---|---|---|---|---|---|---|---|
| 2714 5th Ave N Texas City, TX | 3.0 | 2.0 | 1382 | $1,800 | $1.30 | 45d | 1 | 0.14mi |
| 3106 Danforth Dr Texas City, TX | 3.0 | 1.0 | 1100 | $1,800 | $1.64 | 26d | 1 | 0.24mi |
| 2526 3rd 1/2 Ave N Texas City, TX | 3.0 | 2.0 | 1240 | $1,550 | $1.25 | 26d | 1 | 0.34mi |
| 2701 13th Ave N Unit B-B6 Texas City, TX | 2.0 | 1.0 | 811 | $1,239 | $1.53 | 4d | 1 | 0.47mi |
| 2701 13th Ave N Unit J-J3 Texas City, TX | 2.0 | 1.0 | 811 | $1,287 | $1.59 | 21d | 1 | 0.47mi |
| 2701 13th Ave N Unit C-C3 Texas City, TX | 2.0 | 1.0 | 811 | $1,189 | $1.47 | 22d | 1 | 0.47mi |
| 2701 13th Ave N Unit K-K3 Texas City, TX | 2.0 | 1.0 | 811 | $1,099 | $1.36 | 22d | 1 | 0.47mi |
| 2701 13th Ave N Unit E-E6 Texas City, TX | 2.0 | 1.0 | 811 | $1,137 | $1.40 | 22d | 1 | 0.47mi |
| 2701 13th Ave N Unit C-C12 Texas City, TX | 2.0 | 1.0 | 811 | $1,222 | $1.51 | 22d | 1 | 0.47mi |
| 2701 13th Ave N Unit H-H3 Texas City, TX | 2.0 | 1.0 | 811 | $1,250 | $1.54 | 22d | 1 | 0.47mi |
| 2707 13th Ave N Texas City, TX | 2.0 | 1.0 | 811 | $1,257 | $1.55 | 45d | 1 | 0.47mi |
| 3404 9th Ave N Texas City, TX | 1.0–2.0 | 1.0–2.0 | 721 | $1,525 | $2.11 | 0d | 30 | 0.70mi |
| 2418 14th Ave N Texas City, TX | 3.0 | 2.0 | 1488 | $1,775 | $1.19 | 5d | 1 | 0.72mi |
| 1231 23rd St N Texas City, TX | 4.0 | 2.0 | 1330 | $1,500 | $1.13 | 0d | 1 | 0.73mi |
| 1919 13th Ave N Texas City, TX | 1.0–3.0 | 1.0–2.0 | 950 | $1,499 | $1.58 | 0d | 4 | 0.91mi |
| 2202 16th Ave N Texas City, TX | 2.0 | 1.5 | 860 | $975 | $1.13 | 13d | 4 | 0.93mi |
| 1115 Highway 146 N Texas City, TX | 1.0–2.0 | 1.0–2.0 | 757 | $1,350 | $1.78 | 0d | 8 | 1.02mi |
| 3507 25th Ave N Texas City, TX | 2.0 | 2.0 | 855 | $1,045 | $1.22 | 45d | 1 | 1.44mi |
| 1228 6th Ave N Unit 1 Texas City, TX | 2.0 | 1.0 | 847 | $945 | $1.12 | 14d | 1 | 1.46mi |
Listing history 4 events
-
2026-05-14status Pending 838-char remark
-
2026-05-05status Pending 838-char remark
-
2026-05-01$159,900 Active 838-char remark
-
2026-05-01historical $159,900 838-char remark
ⓘ Source: listings_history table (triggers on properties + properties_extension) + one-shot
backfill from property_details.listing_events for pre-trigger history.
Tax reassessment forecast TX · Resets to sale price
- Current annual tax
- $2,851 · $238/mo
- Projected year-2 tax
- $2,926 · $244/mo
- Expected delta
- +$76/yr (+$6/mo · 2.7%)
ⓘ Screening estimate from a state-policy table — verify with the county assessor before closing.
Climate risk First Street
- Flood 8/10 Severe FEMA zone X · 60% chance over 30 yrs
- Wildfire 1/10 Low
- Heat 10/10 Extreme 7 d/yr ≥109°F today · 28 d/yr by 30 yrs out
- Wind 9/10 Extreme 99% chance of damaging wind over 30 yrs
- Air quality 2/10 Low 2 unhealthy d/yr today · 2 by 30 yrs out
Nearby sold comps map
Loading sold comps map…
Walkable amenities ~0.75 mi
Loading nearby amenities…
Taxation est. · year 1
- Rental income
- $18,434
- − Mortgage interest
- −$8,957
- − Property taxes
- −$2,851
- − Insurance
- −$1,597
- − Repairs & maintenance
- −$1,475
- − Management
- −$1,475
- − Depreciation
- −$4,652
- Taxable loss
- −$2,571
- Est. tax savings @ 24.0%
- +$617
- After-tax cash flow
- $670/yr
For passive investors: Depreciation is non-cash, so a rental often shows a tax loss while cash-flowing — sheltering income. Rental losses are passive: they offset passive income freely, and up to $25,000/yr can offset ordinary (W-2) income if you actively participate and your MAGI is under $100k (phasing out to $0 by $150k); unused losses carry forward. On sale, claimed depreciation is recaptured at up to 25%, and gains may owe capital-gains tax (a 1031 exchange can defer both). Figures are a year-1 estimate at your 24.0% rate — not tax advice; consult a CPA.
Schools (NCES district)
- District
- Texas City ISD
- NCES district ID
- 4842510
- Math proficiency
- 28% ▼ -10.00%
- Reading proficiency
- 29% ▼ -4.00%
- Median HH income
- $44,875
- Composite
- 24.47/100
- National rank
- #7664
- State rank
- #655 of 826 in TX
Livability — Texas City
- Score
- 62/100
- State rank
- #907
- US rank
- #16268
Category grades
Schools grade is shown separately in the Schools card above.
Census & demographics
- Census place
- Texas City, TX
- County
- Galveston County · 357,330 people
- City population
- 49,936
- Metro
- Houston-The Woodlands-Sugar Land, TX
- Population (ZIP)
- 31,642
- Household income
- $65,801
- Rent vs Own
- Severe rent burden
- 1821.0
Population outlook (Galveston County) Hauer SSP2
- Today (2025)
- 390,640 people
- By 2030
- 425,226 · +8.9%
- By 2040
- 493,765 · +26.4%
- By 2050
- 559,698 · +43.3%
- By 2075
- 719,260 · +84.1%
- By 2100
- 819,628 · +109.8%
Race, ethnicity, and origin ACS 2023
- Neighborhood character
- Diverse neighborhood (Simpson 0.66)
- Race & ethnicity
- White 41% Hispanic / Latino 38% Two or more races 20% Black 17% Asian 2%
- Hispanic origin (detail)
- Mexican 33% Puerto Rican 1%
- Common ancestry
- Lithuanian 2% Slovak 1% Italian 1%
- Foreign-born
- 9% · Canada, Vietnam
- Languages at home
- 72% English-only · Spanish 26% Other Indo-European 1%
Political lean MEDSL · Galveston
- 2024 margin
- Strong R (+27.4) · D 35.7% · R 63.1% · Other 1.2%
- 2008→2024 swing
- -7.9pp toward R · 2008: -19.5pp · 2024: -27.4pp
- All cycles
- 2024: R+27.4 2020: R+22.6 2016: R+22.6 2012: R+26.9 2008: R+19.5
Not yet ingested
- Civics
- —
Market trends
- HPI YoY
- ▼ -58.35%
- Current HPI
- 244.5809
- Rent YoY
- ▲ 4.91%
- Metro
- Houston-The Woodlands-Sugar Land, TX
- State GDP YoY
- ▲ 3.95%
- F500 in state
- 110
Industry mix (Fortune 500 HQ in TX)
| Industry | F500 HQs | Revenue |
|---|---|---|
| Energy | 16 | $1,198B |
|
||
| Technology | 5 | $198B |
|
||
| Engineering / Construction | 4 | $72B |
|
||
| Energy Services | 3 | $60B |
|
||
| Utilities | 3 | $41B |
|
||
| Healthcare | 2 | $330B |
|
||
Price history
+0.0% since first listed4 events — show timeline
- 2026-05-14 Pending — HARMLS
- 2026-05-05 Pending — HARMLS
- 2026-05-01 Listed $159,900 HARMLS
- 2026-05-01 Coming Soon $159,900 HARMLS
Property tax history
+5.0%/yrLatest (2025): $2,851 · +11.6% YoY. Source: county tax records.
Cash-flow waterfall
monthlySold comps — $/sqft
last 12 mo · ≤1 miLoading sold comps…