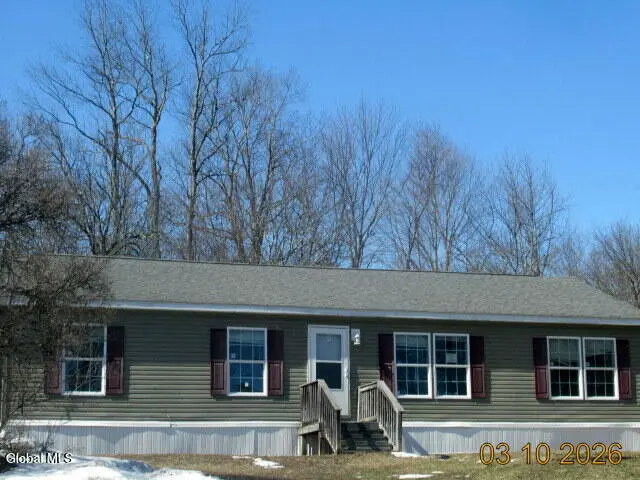
37 Bunker Hill Rd · Salem, NY
Flood risk 1/10 · Minimal
- FEMA flood zone
- X
- Chance of flooding over 30 yrs
- 0.0%
- Est. flood insurance / yr
- $507 – $1,088
Fire risk 3/10 · Minor
- Est. fire insurance / yr
- $691 – $1,283
Heat risk 3/10 · Minor
- Hot days now (above 94°F)
- 7 days/yr
- Hot days in 30 yrs
- 16 days/yr
Wind risk 2/10 · Minimal
- Chance of severe wind over 30 yrs
- 4.0%
Air-quality risk 2/10 · Minimal
- Unhealthy air days now
- 0 days/yr
- Unhealthy air days in 30 yrs
- 1 days/yr
Risk factors via First Street. Map © Google.
Why this score? — see what drove the F grade
The composite is a weighted blend of 9 inputs, each scored 0–100. Each bar is that input's sub-score; the figure is the points it added to the 100-point composite (weight × sub-score).
- ARV discount +7.5/15.0
- Cash flow +5.3/30.0
- Schools +5.3/10.0
- Appreciation +4.7/10.0
- Livability +3.7/5.0
- 1% rule +2.7/10.0
- Rent growth +2.5/5.0
- Condition / age +2.5/5.0
- DSCR +0.0/10.0
$135,000
🖨 Deal sheet (PDF) 📄 Offer letter ✓ Due diligence
Listing remarks MLS
**BOM, CONTINGENT ON RELEASES** Ranch style home built in 2015 and offers 1,404 sq ft, 3 bedrooms, 2 baths, private utilities, on a slab, situate on 2.48 acres, located in Greenwich CSD.
Key facts
- 2.48 acre lot
- 4 parking spots
- Built 2015
Neighborhood map
What this means for you Summary
Snapshot
- This is a 3-bed/2.0-bath manufactured listed at $135k.
Deal economics
- At list price, monthly cash flow is $-298 ($-4k/yr) — negative.
- To cash-flow at today's rent, offer at most $86k (36.1% below list).
- To meet the 1% rule (rent ≥ 1% of price), the offer needs to be $105k (22.6% below list).
- Recommended offer: $86k (36.1% below list) — sets the bar for cash-flow.
Location & tenants
- Location reads 74/100 on livability (#299 in NY, #4,826 nationally) — a middle-class / working-renter tenant base. Strengths: housing A+, health & safety A+, cost of living A; Watch: crime F, amenities F, commute F.
- Greenwich Central School District (town): math 59% / reading 60% proficiency, ranked #266 of 755 in NY (top 35%) — acceptable for families but not a draw, mixed tenant base, ~2y average lease.
- Zoned schools: Greenwich Elementary School (math 44% / reading 64%, grade C, #908 of 2,108 statewide, top 46%, 466 students, 37% FRL); Greenwich Junior-Senior High School (math 98% / reading 87%, grade A+, #158 of 1,100 statewide, top 15%, 429 students, 32% FRL).
- Zoned-school proficiency averages 73% at this address vs 60% district-wide (+14 pts) — the actual schools serving this property are materially stronger than the Greenwich Central School District average implies; a family-tenant draw the district grade alone would hide.
- Market conditions: 4 active listings in the ZIP; 106 units permitted in Washington County in 2024 (0 in 5+ unit buildings).
Forward outlook
- In year one you build about $208 of equity ($933 loan paydown + $-725 appreciation (-0.5% local appreciation)).
- Washington County population projected at -20% by 2050 — secular population decline; favor cash flow + early exit over multi-decade hold.
Negotiation context
- Only 13 days on market — expect competitive offers; lowballing is unlikely to land.
- 2 sale attempts with the ask held roughly flat each time — persistent listings suggest the price (not the market) is what's stuck; bring a comps-based counter.
- Current owner paid $25k; list at $135k implies a 440% gain — meaningful room to come down on a strong offer.
Risks & watch-outs
- Watch-outs: property tax is 3.2% of price.
Questions for the listing agent
- What do current leases actually rent for vs. the listed asking? Can we see a recent rent roll and the last 12 months of T-12 income?
- Property tax is high relative to price — has the assessment been appealed recently, and will the sale trigger a re-assessment?
- Is there a deadline driving the sale (1031 exchange, divorce, estate, relocation)? That informs how much negotiation room exists.
- Schools are B-rated — typically a magnet for longer-tenancy family renters. What's the average tenant stay here, and is there a school-zone premium baked into asking?
- Crime grade is F in this area — have there been break-ins, vandalism, or insurance claims at this property in the last 3 years? What carrier currently insures it and at what premium?
- The area grade is low — what's the realistic commute time and amenity access for the typical tenant pool here? Any planned neighborhood developments (good or bad) we should know about?
- What's the average days-on-market for RENTAL listings here right now (not sales)? A rising rental-DOM trend means longer vacancies and softer asking-rent achievability than the comps imply.
- What's the recent tenant-quality profile in this submarket — average credit score on applications, eviction rate, late-payment / NSF rate, and stable-employment percentage? A property-management company in the area should have these aggregated.
- How much new for-sale + rental construction is in the pipeline within 1–3 miles? Heavy new supply typically softens prices + rents 12–24 months out; constrained supply supports both.
Investment metrics
- 1% rule
- 0.77% ✗
- Cap rate
- 3.64%
- Cash-on-cash
- -9.47%
- DSCR
- 0.58
- GRM
- 10.8
CMA / ARV
- ARV (median comp)
- $327,329
- List price
- $135,000
- Delta
- -58.76%
- Verdict
- UNDERPRICED
- Comps
- 11 within 1.0 mi
Projected returns pro-forma
-0.54% appreciation · 3.0% rent growth · sell at horizon
- IRR
- -15.6%
- Equity multiple
- 0.31×
- Total profit
- $-26,177
- Equity at exit
- $35,614
- IRR
- -8.9%
- Equity multiple
- 0.13×
- Total profit
- $-32,713
- Equity at exit
- $40,043
Cash invested: $37,800 (down + closing). Projections, not guarantees.
Landlord ↔ Tenant lean methodology
- Overall (STATE)
- 15 Strongly Tenant-Friendly
- State New York
- 15 Strongly Tenant-Friendly · D+10
- County
- — inherits STATE
- City
- — inherits STATE
ZIP-level market 12823
- Home prices YoY
- -0.3%
- Active inventory
- 4
- Price-to-rent
- 10.8×
Monthly cashflow live
- Estimated rent
- $1,045 medium interval (Pro) →
- Mortgage (P&I)
- −$708
- Tax from tax record
- −$360 /mo · $4,315/yr
- Insurance
- −$56
- HOA
- −$0
- Lot rent leased land?
- −$0
- Vacancy / Maint / Mgmt
- −$219
- Net cashflow
- $-298
Break-even live
Sensitivity live
| Price | -10% $-222 | -5% $-260 | +0% $-298 | +5% $-336 | +10% $-375 |
|---|---|---|---|---|---|
| Rent | -10% $-381 | -5% $-339 | +0% $-298 | +5% $-257 | +10% $-216 |
| Rate | -1.0pp $-230 | -0.5pp $-264 | base $-298 | +0.5pp $-333 | +1.0pp $-369 |
UW: 25.0% down · 7.5% · 30yr · 1.5% tax · 5.0% vac · 8.0% maint · 8.0% mgmt
Financing live
Cash to close
- Down payment
- $33,750
- Closing costs
- $4,050
- Reserves months
- —
- Total cash needed
- —
Loan-product check · same deal, 3 products live
Conventional
25% down · 7.5% · 30yr
- Down + closing
- —
- Monthly P&I
- —
- Monthly cashflow
- —
- DSCR
- —
- Eligible?
- —
Personal DTI + credit; lowest rate.
DSCR
20% down · 8.5% · 30yr
- Down + closing
- —
- Monthly P&I
- —
- Monthly cashflow
- —
- DSCR
- —
- Eligible?
- —
No personal income docs; deal must DSCR.
Hard money
10% down · 12.0% · 12mo
- Down + closing
- —
- Monthly P&I
- —
- Monthly cashflow
- —
- DSCR
- —
- Eligible?
- —
Short-term bridge; refi at stabilization.
Listing history 5 events
-
2026-05-06status Pending 187-char remark
Show marketing remark (187 chars)
**BOM, CONTINGENT ON RELEASES** Ranch style home built in 2015 and offers 1,404 sq ft, 3 bedrooms, 2 baths, private utilities, on a slab, situate on 2.48 acres, located in Greenwich CSD.
-
2026-05-01status Active 187-char remark
Show marketing remark (187 chars)
**BOM, CONTINGENT ON RELEASES** Ranch style home built in 2015 and offers 1,404 sq ft, 3 bedrooms, 2 baths, private utilities, on a slab, situate on 2.48 acres, located in Greenwich CSD.
-
2026-03-21status Pending 187-char remark
Show marketing remark (187 chars)
**BOM, CONTINGENT ON RELEASES** Ranch style home built in 2015 and offers 1,404 sq ft, 3 bedrooms, 2 baths, private utilities, on a slab, situate on 2.48 acres, located in Greenwich CSD.
-
2026-03-13$135,000 Active 187-char remark
Show marketing remark (187 chars)
**BOM, CONTINGENT ON RELEASES** Ranch style home built in 2015 and offers 1,404 sq ft, 3 bedrooms, 2 baths, private utilities, on a slab, situate on 2.48 acres, located in Greenwich CSD.
-
2000-06-06soldstatus $25,000
ⓘ Source: listings_history table (triggers on properties + properties_extension) + one-shot
backfill from property_details.listing_events for pre-trigger history.
Tax reassessment forecast NY · Partial reset (capped growth)
- Current annual tax
- $4,315 · $360/mo
- Projected year-2 tax
- $4,315 · $360/mo
- Expected delta
- $0/yr ($0/mo · 0.0%)
ⓘ Screening estimate from a state-policy table — verify with the county assessor before closing.
Climate risk First Street
- Flood 1/10 Low FEMA zone X · 0% chance over 30 yrs
- Wildfire 3/10 Moderate
- Heat 3/10 Moderate 7 d/yr ≥94°F today · 16 d/yr by 30 yrs out
- Wind 2/10 Low 4% chance of damaging wind over 30 yrs
- Air quality 2/10 Low 0 unhealthy d/yr today · 1 by 30 yrs out
Nearby sold comps map
Loading sold comps map…
Walkable amenities ~0.75 mi
Loading nearby amenities…
Taxation est. · year 1
- Rental income
- $12,541
- − Mortgage interest
- −$7,562
- − Property taxes
- −$4,315
- − Insurance
- −$675
- − Repairs & maintenance
- −$1,003
- − Management
- −$1,003
- − Depreciation
- −$3,927
- Taxable loss
- −$5,945
- Est. tax savings @ 24.0%
- +$1,427
- After-tax cash flow
- $-2,151/yr
For passive investors: Depreciation is non-cash, so a rental often shows a tax loss while cash-flowing — sheltering income. Rental losses are passive: they offset passive income freely, and up to $25,000/yr can offset ordinary (W-2) income if you actively participate and your MAGI is under $100k (phasing out to $0 by $150k); unused losses carry forward. On sale, claimed depreciation is recaptured at up to 25%, and gains may owe capital-gains tax (a 1031 exchange can defer both). Figures are a year-1 estimate at your 24.0% rate — not tax advice; consult a CPA.
Schools (NCES district)
- District
- Greenwich Central School District
- NCES district ID
- 3612900
- Math proficiency
- 59% ▲ 2.00%
- Reading proficiency
- 60% ▼ -2.00%
- Median HH income
- $62,128
- Composite
- 53.45/100
- National rank
- #3147
- State rank
- #266 of 755 in NY
Livability — Salem
- Score
- 74/100
- State rank
- #299
- US rank
- #4826
Category grades
Schools grade is shown separately in the Schools card above.
Census & demographics
- Population (ZIP)
- 682
Population outlook (Washington County) Hauer SSP2
- Today (2025)
- 59,576 people
- By 2030
- 57,618 · -3.3%
- By 2040
- 52,751 · -11.5%
- By 2050
- 47,514 · -20.2%
- By 2075
- 35,690 · -40.1%
- By 2100
- 24,807 · -58.4%
Race, ethnicity, and origin ACS 2023
- Neighborhood character
- Predominantly White (98%)
- Race & ethnicity
- White 98% Asian 2%
- Common ancestry
- Iranian 45% Italian 8% Lithuanian 5%
- Foreign-born
- 2%
- Languages at home
- 98% English-only · Other Asian/Pacific 2%
Political lean MEDSL · Washington
- 2024 margin
- Strong R (+21.2) · D 39.4% · R 60.6%
- 2008→2024 swing
- -22.0pp toward R · 2008: 0.8pp · 2024: -21.2pp
- All cycles
- 2024: R+21.2 2020: R+15.6 2016: R+20.2 2012: D+1.6 2008: D+0.8
Not yet ingested
- Civics
- —
Market trends
- HPI YoY
- ▼ -0.54%
- Current HPI
- 180.2174
- Rent YoY
- —
- Metro
- —
- State GDP YoY
- ▲ 2.60%
- F500 in state
- 92
Industry mix (Fortune 500 HQ in NY)
| Industry | F500 HQs | Revenue |
|---|---|---|
| Financial Services | 10 | $950B |
|
||
| Consumer Goods | 9 | $162B |
|
||
| Insurance | 4 | $225B |
|
||
| Telecommunications | 2 | $144B |
|
||
| Pharmaceuticals | 2 | $112B |
|
||
| Media / Entertainment | 2 | $69B |
|
||
Price history
+440.0% since first listed5 events — show timeline
- 2026-05-06 Pending — Global MLS
- 2026-05-01 Relisted — Global MLS
- 2026-03-21 Pending — Global MLS
- 2026-03-13 Listed $135,000 Global MLS
- 2000-06-06 Sold (Public Records) $25,000 Public Records
Property tax history
+19.5%/yrLatest (2025): $4,315 · +8.7% YoY. Source: county tax records.
Cash-flow waterfall
monthlySold comps — $/sqft
last 12 mo · ≤1 miLoading sold comps…