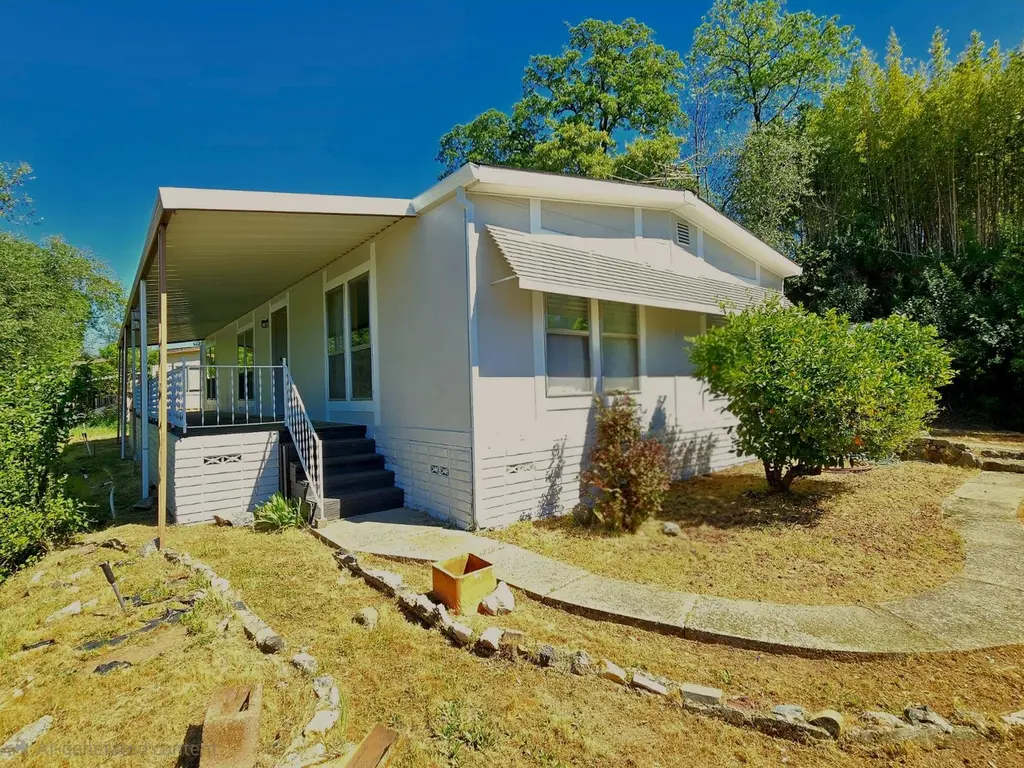
1878 Wendy Way · Newcastle, CA
Flood risk No data
- FEMA flood zone
- —
- Chance of flooding over 30 yrs
- —
- Est. flood insurance / yr
- —
Fire risk No data
- Est. fire insurance / yr
- —
Heat risk No data
- Hot days now (above threshold)
- —
- Hot days in 30 yrs
- —
Wind risk No data
- Chance of severe wind over 30 yrs
- —
Air-quality risk No data
- Unhealthy air days now
- —
- Unhealthy air days in 30 yrs
- —
Risk factors via First Street. Map © Google.
Why this score? — see what drove the B+ grade
The composite is a weighted blend of 9 inputs, each scored 0–100. Each bar is that input's sub-score; the figure is the points it added to the 100-point composite (weight × sub-score).
- Cash flow +30.0/30.0
- ARV discount +15.0/15.0
- 1% rule +10.0/10.0
- DSCR +10.0/10.0
- Schools +4.9/10.0
- Condition / age +3.8/5.0
- Livability +2.8/5.0
- Rent growth +2.5/5.0
- Appreciation +0.0/10.0
$129,900
🖨 Deal sheet 📄 Offer letter ✓ Due diligence
Listing remarks
$20K price reduction! SELLERS ARE MOTIVATED MAKE OFFER! Looking for a place where life feels a little quieter and a lot more relaxed? This 1979 2 bed/2 bath Parklane model mobile home is 1 of only 3 homes on Wendy Way, just off the beaten path in this popular 55+ community. A rare spot where mornings are calm, afternoons drift by easily and sunsets reflecting off the community ponds become part of your evening routine. Recent updates add peace of mind, including fresh exterior paint, a new GAF Reflector Series composition shingle roof and a freshly re-stained spacious deck overlooking the community. Add your own personal touches and updates to make the most of this unique hillside retreat
Key facts
- Recent updates
- Clubhouse
- Pool
Tags
Property features AI
Finance
- Financial info: Monthly land lease: $760 (land lease status: No)
- HOA & community: No homeowners association; Senior community
Exterior
- Parking: Attached covered parking; Guest parking available
- Utilities: Individual electric meter; Individual gas meter; Natural gas connected; Internet available; Private sewer; Water from water district
- Home design: Manufactured in park (double wide); Original condition; Built in 1979
- Construction: Composition roof; Vinyl skirting; Fuqua manufactured home
- Exterior features: Private setting; Patio awning and carport awning; Covered deck and porch; Storage area and shed(s)
Interior
- Kitchen: Free standing gas range; Hood over range; Dishwasher; Disposal; Breakfast area; Pantry closet; Laminate counters
- Bedrooms: 2 bedrooms (includes master bedroom)
- Flooring: Carpet; Linoleum
- Bathrooms: 2 full bathrooms; Double sinks; Tub with shower over
- Heating & cooling: Central heating; Central cooling; Evaporative cooler; Ceiling fans
- Interior features: Covered deck and porch; Patio awning and carport awning; Storage area and shed(s); Dual-pane full windows; Unfurnished
- Laundry & utility: Washer and dryer included; Laundry inside the home
Neighborhood map
What this means for you Summary
Snapshot
- This is a 2-bed/2.0-bath manufactured listed at $130k. Condition is rated good.
Deal economics
- At list price, monthly cash flow is $1k ($14k/yr) — positive.
- The deal already cash-flows at list — no discount required.
- Meets the 1% rule at list price ($3k rent vs $130k).
- Recommended offer: $122k (6.0% below list) — sets the bar for market timing.
- Cap rate 17.2% vs local median 1.6% in Newcastle — top-decile yield for the area; either an underpriced asset or a hidden risk that comps aren't pricing in. Stress-test before assuming the spread holds.
Location & tenants
- Location reads 56/100 on livability (#792 in CA) — a working-class tenant base; expect higher turnover. Strengths: crime A+, employment A+, housing A+; Watch: amenities F, commute F, cost of living F.
- Placer Union High (suburban): math 39% / reading 72% proficiency, ranked #98 of 517 in CA (top 19%) — acceptable for families but not a draw, mixed tenant base, ~2y average lease.
- Market conditions: 54 active listings in the ZIP; 3,535 units permitted in Placer County in 2024 (689 in 5+ unit buildings).
Forward outlook
- Local home prices are declining (-3.0%/yr); year-one equity from $898 of loan paydown is wiped out by about $4k of value loss. Plan a longer hold.
- Placer County population projected at +20% by 2050 — long-run rental-demand tailwind backs the buy-and-hold thesis.
- At projected returns (-3.0% appreciation + 3.0% rent growth), your $36k cash investment doubles in ~4 years — after that, you're playing with house money.
Negotiation context
- It's been on market 88 days — a 6% lower offer ($122k) is reasonable based on typical stale-listing flexibility.
Questions for the listing agent
- It's been on market 88 days. Have you received any prior offers? Is the seller open to a 6% concession, seller financing, or rate buy-down credit?
- Built in 1979 — when were the roof, HVAC, electrical panel, plumbing, and water heater last replaced?
- Why hasn't it sold? Are there any deal-killer items the seller is aware of (foundation, flood, title, zoning, code violations)?
- Is there a deadline driving the sale (1031 exchange, divorce, estate, relocation)? That informs how much negotiation room exists.
- Schools are A-rated — typically a magnet for longer-tenancy family renters. What's the average tenant stay here, and is there a school-zone premium baked into asking?
- What's the average days-on-market for RENTAL listings here right now (not sales)? A rising rental-DOM trend means longer vacancies and softer asking-rent achievability than the comps imply.
- What's the recent tenant-quality profile in this submarket — average credit score on applications, eviction rate, late-payment / NSF rate, and stable-employment percentage? A property-management company in the area should have these aggregated.
- How much new for-sale + rental construction is in the pipeline within 1–3 miles? Heavy new supply typically softens prices + rents 12–24 months out; constrained supply supports both.
Investment metrics
- 1% rule
- 2.02% ✓
- Cap rate
- 17.19%
- Cash-on-cash
- 38.91%
- DSCR
- 2.73
- GRM
- 4.1
CMA / ARV
- ARV (on-the-fly)
- $159,936
- Comps found
- 1
Show comp detail 1 sale within ~0.75 mi
| Address | Dist | Beds/Ba | Sqft | Sold | Price | $/sf | Match |
|---|---|---|---|---|---|---|---|
| 6060 Nob Hl | 0.75mi | 2/2.0 | 1,344 (0%) | 24mo | $160,000 | $119 | 45 |
Match score weights: distance 35% · size 25% · config 20% · recency 20%. Top-matched comps best support the ARV.
Projected returns pro-forma
-3.0% appreciation · 3.0% rent growth · sell at horizon
- IRR
- 35.1%
- Equity multiple
- 2.49×
- Total profit
- $54,101
- Equity at exit
- $19,369
- IRR
- 41.9%
- Equity multiple
- 4.96×
- Total profit
- $143,989
- Equity at exit
- $11,231
Cash invested: $36,372 (down + closing). Projections, not guarantees.
Landlord ↔ Tenant lean methodology
- Overall (STATE)
- 18 Strongly Tenant-Friendly
- State California
- 18 Strongly Tenant-Friendly · D+13
- County
- — inherits STATE
- City
- — inherits STATE
ZIP-level market 95658
- Active inventory
- 54
- Price-to-rent
- 4.1×
Monthly cashflow live
- Estimated rent
- $2,629 medium interval (Pro) →
- Mortgage (P&I)
- −$681
- Tax est. 1.5%
- −$162 /mo · $1,948/yr
- Insurance
- −$54
- HOA
- −$0
- Vacancy / Maint / Mgmt
- −$552
- Net cashflow
- $1,179
Break-even live
UW: 25.0% down · 7.5% · 30yr · 1.5% tax · 5.0% vac · 8.0% maint · 8.0% mgmt
Financing live
Cash to close
- Down payment
- $32,475
- Closing costs
- $3,897
- Reserves months
- —
- Total cash needed
- —
Loan-product check · same deal, 3 products live
Conventional
25% down · 7.5% · 30yr
- Down + closing
- —
- Monthly P&I
- —
- Monthly cashflow
- —
- DSCR
- —
- Eligible?
- —
Personal DTI + credit; lowest rate.
DSCR
20% down · 8.5% · 30yr
- Down + closing
- —
- Monthly P&I
- —
- Monthly cashflow
- —
- DSCR
- —
- Eligible?
- —
No personal income docs; deal must DSCR.
Hard money
10% down · 12.0% · 12mo
- Down + closing
- —
- Monthly P&I
- —
- Monthly cashflow
- —
- DSCR
- —
- Eligible?
- —
Short-term bridge; refi at stabilization.
Listing history 14 events
-
2026-06-18days on market $129,900 Active 88 DOM
-
2026-06-18price $129,900 Active 87 DOM
-
2026-06-17days on market $139,900 Active 87 DOM
-
2026-06-16days on market $139,900 Active 86 DOM
-
2026-06-15days on market $139,900 Active 85 DOM
-
2026-06-13days on market $139,900 Active 83 DOM
-
2026-06-13days on market $139,900 Active 82 DOM
-
2026-06-09days on market $139,900 Active 79 DOM
-
2026-06-08days on market $139,900 Active 78 DOM
-
2026-06-07days on market $139,900 Active 77 DOM
-
2026-06-03days on market $139,900 Active 73 DOM
-
2026-06-02days on market $139,900 Active 72 DOM
-
2026-06-01days on market $139,900 Active 71 DOM
-
2026-05-31days on market $139,900 Active 70 DOM
ⓘ Source: listings_history table (triggers on properties + properties_extension) + one-shot
backfill from property_details.listing_events for pre-trigger history.
Nearby sold comps map
Loading sold comps map…
Walkable amenities ~0.75 mi
Loading nearby amenities…
Taxation est. · year 1
- Rental income
- $31,550
- − Mortgage interest
- −$7,276
- − Property taxes
- −$1,948
- − Insurance
- −$650
- − Repairs & maintenance
- −$2,524
- − Management
- −$2,524
- − Depreciation
- −$3,779
- Taxable income
- $12,848
- Est. tax owed @ 24.0%
- −$3,084
- After-tax cash flow
- $11,068/yr
For passive investors: Depreciation is non-cash, so a rental often shows a tax loss while cash-flowing — sheltering income. Rental losses are passive: they offset passive income freely, and up to $25,000/yr can offset ordinary (W-2) income if you actively participate and your MAGI is under $100k (phasing out to $0 by $150k); unused losses carry forward. On sale, claimed depreciation is recaptured at up to 25%, and gains may owe capital-gains tax (a 1031 exchange can defer both). Figures are a year-1 estimate at your 24.0% rate — not tax advice; consult a CPA.
Condition & rehab AI · 14 photos
This 1979 Parklane model mobile home is in good condition with fresh exterior paint and a new roof. It has a good foundation and structure, and the interior walls and carpet may benefit from a fresh coat of paint. The property has a simple landscaping and could benefit from some landscaping improvements to enhance curb appeal and add value.
Repairs flagged
- Minor Paint — The exterior paint is fresh, but the interior walls and carpet may benefit from a fresh coat.
Value-add opportunities
- Resale Paint the interior walls and carpet — Fresh paint will make the interior look more modern and appealing to potential buyers.
- Both Landscaping — A more landscaped yard can improve curb appeal and add value to the property.
Renovation cost estimate screening
| Repair item | Severity | Est. cost |
|---|---|---|
| Paint · The exterior paint is fresh, but the interior walls and carpet may benefit from a fresh coat. | Minor | $500–3,000 |
| Total estimated repair cost · 1 items | $500–3,000 |
Value-add ROI direction
- Resale Paint the interior walls and carpet — Fresh paint will make the interior look more modern and appealing to potential buyers. ↑
- Both Landscaping — A more landscaped yard can improve curb appeal and add value to the property. ↑
ⓘ Cost ranges are severity-bucket heuristics (US national rule-of-thumb). Get contractor quotes + a written scope before underwriting a rehab budget.
Schools (NCES district)
- District
- Placer Union High
- NCES district ID
- 0630750
- Math proficiency
- 39% ▲ 1.00%
- Reading proficiency
- 72% ▲ 3.00%
- Median HH income
- $69,119
- Composite
- 49.04/100
- National rank
- #2060
- State rank
- #98 of 517 in CA
Livability — Newcastle
- Score
- 56/100
- State rank
- #792
- US rank
- #22660
Category grades
Schools grade is shown separately in the Schools card above.
Census & demographics
- Census place
- Newcastle, CA
- Population (ZIP)
- 6,197
Population outlook (Placer County) Hauer SSP2
- Today (2025)
- 422,709 people
- By 2030
- 444,249 · +5.1%
- By 2040
- 480,192 · +13.6%
- By 2050
- 506,390 · +19.8%
- By 2075
- 550,219 · +30.2%
- By 2100
- 547,760 · +29.6%
Race, ethnicity, and origin ACS 2023
- Neighborhood character
- Predominantly White (80%)
- Race & ethnicity
- White 80% Hispanic / Latino 9% Two or more races 7% Black 3% Native American 2% Asian 1%
- Hispanic origin (detail)
- Mexican 8%
- Common ancestry
- Italian 5% Slovak 4% Russian 3%
- Foreign-born
- 4% · Canada
- Languages at home
- 93% English-only · German/W. Germanic 2% Spanish 1% Other Asian/Pacific 1%
Political lean MEDSL · Placer
- 2024 margin
- Lean R (+8.5) · D 44.3% · R 52.8% · Other 2.9%
- 2008→2024 swing
- +2.8pp toward D · 2008: -11.3pp · 2024: -8.5pp
- All cycles
- 2024: R+8.5 2020: R+6.7 2016: R+11.3 2012: R+20.1 2008: R+11.3
Not yet ingested
- Civics
- —
Market trends
- HPI YoY
- ▼ -292.40%
- Current HPI
- 288.3247
- Rent YoY
- —
- Metro
- —
- State GDP YoY
- ▲ 3.21%
- F500 in state
- 116
Industry mix (Fortune 500 HQ in CA)
| Industry | F500 HQs | Revenue |
|---|---|---|
| Technology | 27 | $1,492B |
|
||
| Financial Services | 3 | $174B |
|
||
| Retail | 3 | $44B |
|
||
| Insurance | 3 | $26B |
|
||
| Media / Entertainment | 2 | $115B |
|
||
| Pharmaceuticals / Biotech | 2 | $62B |
|
||
Cash-flow waterfall
monthlySold comps — $/sqft
last 12 mo · ≤1 miLoading sold comps…