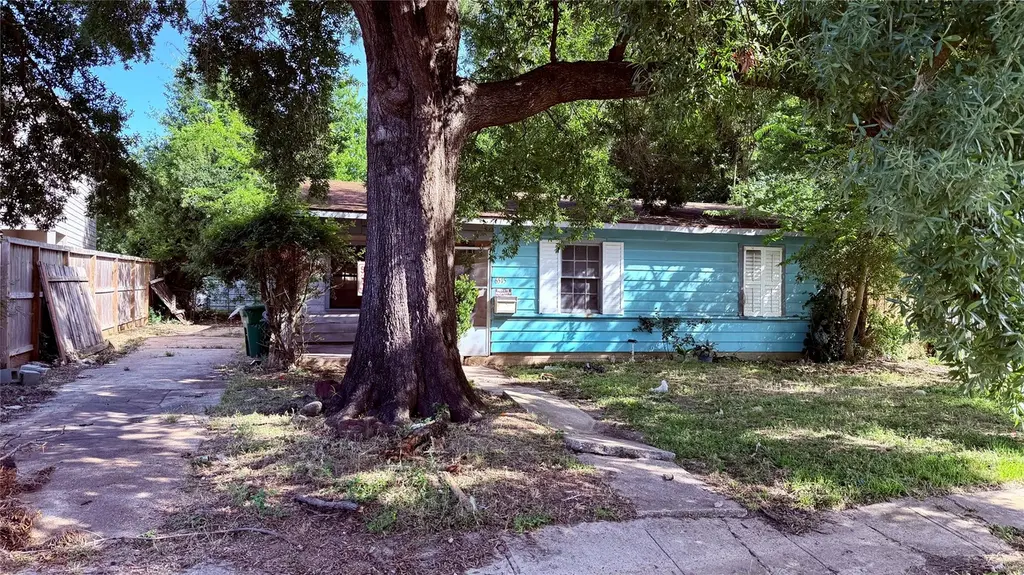
6515 Narcissus St · Houston, TX
Flood risk 1/10 · Minimal
- FEMA flood zone
- X (unshaded)
- Chance of flooding over 30 yrs
- 0.0%
- Est. flood insurance / yr
- $507 – $1,088
Fire risk 1/10 · Minimal
- Est. fire insurance / yr
- $1,222 – $2,270
Heat risk 9/10 · Severe
- Hot days now (above 109°F)
- 7 days/yr
- Hot days in 30 yrs
- 24 days/yr
Wind risk 9/10 · Severe
- Chance of severe wind over 30 yrs
- 99.0%
Air-quality risk 2/10 · Minimal
- Unhealthy air days now
- 2 days/yr
- Unhealthy air days in 30 yrs
- 2 days/yr
Risk factors via First Street. Map © Google.
Why this score? — see what drove the C- grade
The composite is a weighted blend of 9 inputs, each scored 0–100. Each bar is that input's sub-score; the figure is the points it added to the 100-point composite (weight × sub-score).
- ARV discount +15.0/15.0
- Cash flow +14.8/30.0
- 1% rule +5.3/10.0
- DSCR +4.5/10.0
- Livability +3.7/5.0
- Schools +2.7/10.0
- Rent growth +2.6/5.0
- Condition / age +2.5/5.0
- Appreciation +0.0/10.0
$127,500
🖨 Deal sheet (PDF) 📄 Offer letter ✓ Due diligence
Listing remarks
Opportunity awaits at 6515 Narcissus Street! This 3-bedroom, 1-bath home is ready for a complete renovation from the slab up or could be the perfect site for new construction. Located in an area experiencing significant redevelopment, with numerous new homes being built nearby, this property offers excellent potential for investors, builders, or buyers looking to create their dream home. Conveniently situated with easy access to major roadways, shopping, dining, and employment centers. Whether you choose to renovate or build new, this property presents a chance to be part of a rapidly transforming neighborhood. Property is being sold as-is. Bring your vision and unlock the possibilities!
Key facts
- 6,307 sq ft lot
- Built 1948
- Listed 3 days
Property features AI
Finance
- Other: Living area approximately 1,223
- Financial info: Lease not considered
Exterior
- Utilities: Public water; Public sewer
- Home design: Residential property; Single-story entry (all main rooms listed on first floor)
- Construction: Built in 1948; Aluminum siding and wood siding exterior; Composition roof; Slab foundation
- Exterior features: Subdivision lot; Asphalt road access
Interior
- Kitchen: Kitchen on the first floor (8x15)
- Bedrooms: Three first-floor bedrooms (10x12, 10x12, 12x12)
- Bathrooms: 1 full bathroom
- Heating & cooling: Central heating (electric and gas); Central air conditioning (electric)
- Interior features: Utility room on the first floor (8x8); Living room on the first floor (12x20); Dining room on the first floor (10x12)
- Laundry & utility: Utility room (8x8)
Neighborhood map
What this means for you Summary
Snapshot
- This is a 3-bed/1.0-bath single-family listed at $128k.
Deal economics
- At list price, monthly cash flow is $35 ($421/yr) — positive.
- The deal already cash-flows at list — no discount required.
- Meets the 1% rule at list price ($1k rent vs $128k).
- Cap rate 6.6% vs local median 3.2% in Houston — top-decile yield for the area; either an underpriced asset or a hidden risk that comps aren't pricing in. Stress-test before assuming the spread holds.
Location & tenants
- Location reads 74/100 on livability (#184 in TX, #4,771 nationally) — a middle-class / working-renter tenant base. Strengths: amenities A+, cost of living A+, housing A+; Watch: crime F.
- Houston ISD (urban): math 27% / reading 35% proficiency, ranked #593 of 826 in TX (top 72%) — families likely to look elsewhere, expect single-tenant / working-renter base with shorter leases; 71% free/reduced lunch — lower-income household profile, screen leases tightly.
- Zoned schools: Southmayd El (math 17% / reading 22%, grade F, #3,583 of 4,322 statewide, top 86%, 366 students, 96% FRL); Deady Middle (math 8% / reading 21%, grade F, #1,583 of 1,662 statewide, top 96%, 588 students, 96% FRL); Milby H S (math 28% / reading 38%, grade F, #1,023 of 1,632 statewide, top 63%, 2,107 students, 93% FRL) — zoned schools average 95% FRL vs 71% district-wide (24 pts higher); higher-poverty schools than district average — tighter screening recommended.
- Market conditions: Rents flat; 84 active listings in the ZIP; 31 comparable units currently listed for rent nearby; rentals at typical pace (median 22d on market — plan ~3-4 weeks tenant-placement turnaround); 29,883 units permitted in Harris County in 2024 (8,621 in 5+ unit buildings).
Forward outlook
- Local home prices are declining (-3.0%/yr); year-one equity from $882 of loan paydown is wiped out by about $4k of value loss. Plan a longer hold.
- Harris County population projected at +47% by 2050 — long-run rental-demand tailwind backs the buy-and-hold thesis.
Negotiation context
- Only 3 days on market — expect competitive offers; lowballing is unlikely to land.
Risks & watch-outs
- Watch-outs: property tax is 2.7% of price; built in 1948 — expect roof / HVAC / electrical / plumbing capex.
- Climate carrying-cost: severe wind risk, 99% chance of damaging wind over 30y; extreme-heat days projected 7→24/yr by 2055 (HVAC capex compounding) — expect insurance premiums to compound above CPI over the hold.
Questions for the listing agent
- Built in 1948 — when were the roof, HVAC, electrical panel, plumbing, and water heater last replaced?
- Property tax is high relative to price — has the assessment been appealed recently, and will the sale trigger a re-assessment?
- Is there a deadline driving the sale (1031 exchange, divorce, estate, relocation)? That informs how much negotiation room exists.
- Schools are D-rated, which usually means shorter tenancies and higher turnover. Who's the typical renter profile here, and what's been the actual vacancy rate?
- Crime grade is F in this area — have there been break-ins, vandalism, or insurance claims at this property in the last 3 years? What carrier currently insures it and at what premium?
- What's the average days-on-market for RENTAL listings here right now (not sales)? A rising rental-DOM trend means longer vacancies and softer asking-rent achievability than the comps imply.
- What's the recent tenant-quality profile in this submarket — average credit score on applications, eviction rate, late-payment / NSF rate, and stable-employment percentage? A property-management company in the area should have these aggregated.
- How much new for-sale + rental construction is in the pipeline within 1–3 miles? Heavy new supply typically softens prices + rents 12–24 months out; constrained supply supports both.
Investment metrics
- 1% rule
- 1.03% ✓
- Cap rate
- 6.62%
- Cash-on-cash
- 1.18%
- DSCR
- 1.05
- GRM
- 8.1
CMA / ARV
- ARV (on-the-fly)
- $195,680
- Comps found
- 12
Show comp detail 12 sales within ~0.75 mi
| Address | Dist | Beds/Ba | Sqft | Sold | Price | $/sf | Match |
|---|---|---|---|---|---|---|---|
| 6523 Moss Rose St | 0.05mi | 3/1.0 | 1,125 (-8%) | 4mo | $210,000 | $187 | 81 |
| 6522 Linden St | 0.08mi | 3/3.0 | 1,125 (-8%) | 7mo | $315,000 | $280 | 69 |
| 6903 Palmetto St | 0.29mi | 3/2.0 | 1,317 (+8%) | 4mo | $175,000 | $133 | 66 |
| 6935 Palmetto St | 0.37mi | 2/1.0 (-1) | 1,256 (+3%) | 14mo | $170,000 | $135 | 62 |
| 2234 Rainbow Dr | 0.49mi | 3/1.5 | 1,257 (+3%) | 15mo | $250,000 | $199 | 58 |
| 3215 Pecan St | 0.65mi | 2/1.0 (-1) | 1,260 (+3%) | 3mo | $185,000 | $147 | 57 |
| 7014 Narcissus St | 0.44mi | 2/1.0 (-1) | 1,153 (-6%) | 11mo | $185,000 | $160 | 56 |
| 7147 Hemlock St | 0.73mi | 3/2.0 | 1,228 (+0%) | 8mo | $150,000 | $122 | 55 |
| 6938 Narcissus St | 0.38mi | 3/1.0 | 1,088 (-11%) | 13mo | $109,000 | $100 | 54 |
| 3017 Golfcrest Blvd | 0.54mi | 3/1.0 | 1,361 (+11%) | 9mo | $144,900 | $106 | 48 |
| 3852 Telephone Rd Unit 1007 | 0.62mi | 3/1.0 | 1,340 (+10%) | 16mo | $249,900 | $186 | 41 |
| 2238 Rainbow Dr Dr | 0.48mi | 4/2.0 (+1) | 1,406 (+15%) | 15mo | $274,000 | $195 | 31 |
Match score weights: distance 35% · size 25% · config 20% · recency 20%. Top-matched comps best support the ARV.
Projected returns pro-forma
-3.0% appreciation · 0.55% rent growth · sell at horizon
- IRR
- -17.5%
- Equity multiple
- 0.40×
- Total profit
- $-21,500
- Equity at exit
- $19,011
- IRR
- -15.8%
- Equity multiple
- 0.22×
- Total profit
- $-27,843
- Equity at exit
- $11,024
Cash invested: $35,700 (down + closing). Projections, not guarantees.
Landlord ↔ Tenant lean methodology
- Overall (STATE)
- 87 Strongly Landlord-Friendly
- State Texas
- 87 Strongly Landlord-Friendly · R+5
- County
- — inherits STATE
- City
- — inherits STATE
ZIP-level market 77087
- Home prices YoY
- -29.7%
- Rents YoY
- 0.6%
- Active inventory
- 84
- Price-to-rent
- 8.1×
Monthly cashflow live
- Estimated rent
- $1,318 high interval (Pro) →
- Mortgage (P&I)
- −$669
- Tax from tax record
- −$285 /mo · $3,416/yr
- Insurance
- −$53
- HOA
- −$0
- Vacancy / Maint / Mgmt
- −$277
- Net cashflow
- $35
Break-even live
Sensitivity live
| Price | -10% $107 | -5% $71 | +0% $35 | +5% $-1 | +10% $-37 |
|---|---|---|---|---|---|
| Rent | -10% $-69 | -5% $-17 | +0% $35 | +5% $87 | +10% $139 |
| Rate | -1.0pp $99 | -0.5pp $68 | base $35 | +0.5pp $2 | +1.0pp $-32 |
UW: 25.0% down · 7.5% · 30yr · 1.5% tax · 5.0% vac · 8.0% maint · 8.0% mgmt
Financing live
Cash to close
- Down payment
- $31,875
- Closing costs
- $3,825
- Reserves months
- —
- Total cash needed
- —
Loan-product check · same deal, 3 products live
Conventional
25% down · 7.5% · 30yr
- Down + closing
- —
- Monthly P&I
- —
- Monthly cashflow
- —
- DSCR
- —
- Eligible?
- —
Personal DTI + credit; lowest rate.
DSCR
20% down · 8.5% · 30yr
- Down + closing
- —
- Monthly P&I
- —
- Monthly cashflow
- —
- DSCR
- —
- Eligible?
- —
No personal income docs; deal must DSCR.
Hard money
10% down · 12.0% · 12mo
- Down + closing
- —
- Monthly P&I
- —
- Monthly cashflow
- —
- DSCR
- —
- Eligible?
- —
Short-term bridge; refi at stabilization.
Rent comps 31 comps
| Address | Beds | Baths | Sqft | Rent | $/sqft | DOM | Units | Dist |
|---|---|---|---|---|---|---|---|---|
| 123 Winkler Dr Unit 2047 Houston, TX | 2.0 | 2.0 | 932 | $1,139 | $1.22 | 13d | 1 | 0.25mi |
| 123 Winkler Dr Unit 2047 Houston, TX | 2.0 | 2.0 | 932 | $1,128 | $1.21 | 4d | 1 | 0.25mi |
| 123 Winkler Dr Unit 180 Houston, TX | 2.0 | 2.0 | 932 | $1,128 | $1.21 | 12d | 1 | 0.26mi |
| 123 Winkler Dr Unit 2165 Houston, TX | 2.0 | 2.0 | 932 | $1,088 | $1.17 | 0d | 1 | 0.26mi |
| 123 Winkler Dr Unit 422 Houston, TX | 2.0 | 2.0 | 932 | $1,104 | $1.18 | 9d | 1 | 0.26mi |
| 123 Winkler Dr Houston, TX | 3.0 | 2.5 | 1320 | $1,600 | $1.21 | 14d | 1 | 0.27mi |
| 129 Winkler Dr Houston, TX | 2.0 | 1.0 | 932 | $1,130 | $1.21 | 45d | 1 | 0.31mi |
| 2248 Marlo St Houston, TX | 2.0 | 1.0 | 1048 | $1,499 | $1.43 | 1d | 1 | 0.47mi |
| 7120 Village Way Unit 332 Houston, TX | 2.0 | 2.0 | 1322 | $1,185 | $0.90 | 26d | 1 | 0.47mi |
| 2930 Plum Creek Ln Houston, TX | 1.0–2.0 | 1.0–2.0 | 820 | $1,500 | $1.83 | 1d | 7 | 0.48mi |
| 2936 Plum Creek Ln Houston, TX | 2.0 | 2.0 | 924 | $1,345 | $1.46 | 45d | 1 | 0.55mi |
| 916 Redwood St Houston, TX | 2.0 | 1.0 | 975 | $985 | $1.01 | 24d | 1 | 0.59mi |
| 916 Redwood St Houston, TX | 2.0 | 1.0 | 975 | $985 | $1.01 | 45d | 1 | 0.59mi |
| 916 Redwood St Houston, TX | 3.0 | 1.0 | 1209 | $1,140 | $0.94 | 26d | 1 | 0.59mi |
| 3852 Telephone Rd Houston, TX | 1.0–3.0 | 1.0–2.0 | 911 | $1,640 | $1.80 | 0d | 16 | 0.66mi |
| 2606 Beatty St Houston, TX | 2.0 | 1.0 | 700 | $950 | $1.36 | 26d | 1 | 0.68mi |
| 2606 Beatty St Unit 224 Houston, TX | 2.0 | 1.5 | 700 | $950 | $1.36 | 26d | 1 | 0.69mi |
| 2522 Patricia Manor Pl Unit 510 Houston, TX | 3.0 | 2.0 | 924 | $1,031 | $1.12 | 0d | 1 | 0.72mi |
| 2522 Patricia Manor Pl Unit 2162 Houston, TX | 2.0 | 2.0 | 714 | $911 | $1.28 | 9d | 1 | 0.72mi |
| 2325 Coral St Houston, TX | 2.0 | 1.0 | 714 | $850 | $1.19 | 24d | 1 | 0.77mi |
| 2325 Coral St Houston, TX | 2.0 | 1.0 | 714 | $850 | $1.19 | 45d | 1 | 0.77mi |
| 7132 Lawndale St Houston, TX | 1.0–2.0 | 1.0 | 725 | $1,297 | $1.79 | 0d | 7 | 0.83mi |
| 3505 Evergreen Dr Houston, TX | 2.0 | 2.0 | 974 | $1,150 | $1.18 | 20d | 1 | 0.99mi |
| 3505 Evergreen Dr Houston, TX | 2.0 | 2.0 | 974 | $1,150 | $1.18 | 21d | 1 | 0.99mi |
| 3810 Weslow St Houston, TX | 2.0 | 1.0 | 924 | $1,449 | $1.57 | 45d | 1 | 1.09mi |
| 3810 Weslow St Unit B Houston, TX | 2.0 | 1.0 | 924 | $1,149 | $1.24 | 9d | 1 | 1.09mi |
| 7437 Southway Dr Houston, TX | 2.0 | 1.0 | 714 | $920 | $1.29 | 45d | 1 | 1.11mi |
| 2801 Carrolton St Houston, TX | 1.0–2.0 | 1.0 | 650 | $849 | $1.31 | 45d | 2 | 1.25mi |
| 2801 Carrolton St Houston, TX | 1.0–2.0 | 1.0 | 650 | $899 | $1.38 | 3d | 4 | 1.25mi |
| 6620 Lawndale St Houston, TX | 2.0 | 1.0 | 901 | $1,700 | $1.89 | 45d | 1 | 1.32mi |
| 1016 S Wayside Dr Houston, TX | 3.0 | 2.0 | 1021 | $1,425 | $1.40 | 45d | 1 | 1.49mi |
Listing history 4 events
-
2026-06-16statusdays on market $127,500 Pending 3 DOM
-
2026-06-15days on market $127,500 Active 2 DOM
-
2026-06-13remarks 696-char remark
-
2026-06-13$127,500 Active 1 DOM
ⓘ Source: listings_history table (triggers on properties + properties_extension) + one-shot
backfill from property_details.listing_events for pre-trigger history.
Tax reassessment forecast TX · Resets to sale price
- Current annual tax
- $3,416 · $285/mo
- Projected year-2 tax
- $3,416 · $285/mo
- Expected delta
- $0/yr ($0/mo · 0.0%)
ⓘ Screening estimate from a state-policy table — verify with the county assessor before closing.
Climate risk First Street
- Flood 1/10 Low FEMA zone X (unshaded) · 0% chance over 30 yrs
- Wildfire 1/10 Low
- Heat 9/10 Extreme 7 d/yr ≥109°F today · 24 d/yr by 30 yrs out
- Wind 9/10 Extreme 99% chance of damaging wind over 30 yrs
- Air quality 2/10 Low 2 unhealthy d/yr today · 2 by 30 yrs out
Nearby sold comps map
Loading sold comps map…
Walkable amenities ~0.75 mi
Loading nearby amenities…
Taxation est. · year 1
- Rental income
- $15,820
- − Mortgage interest
- −$7,142
- − Property taxes
- −$3,416
- − Insurance
- −$638
- − Repairs & maintenance
- −$1,266
- − Management
- −$1,266
- − Depreciation
- −$3,709
- Taxable loss
- −$1,615
- Est. tax savings @ 24.0%
- +$388
- After-tax cash flow
- $809/yr
For passive investors: Depreciation is non-cash, so a rental often shows a tax loss while cash-flowing — sheltering income. Rental losses are passive: they offset passive income freely, and up to $25,000/yr can offset ordinary (W-2) income if you actively participate and your MAGI is under $100k (phasing out to $0 by $150k); unused losses carry forward. On sale, claimed depreciation is recaptured at up to 25%, and gains may owe capital-gains tax (a 1031 exchange can defer both). Figures are a year-1 estimate at your 24.0% rate — not tax advice; consult a CPA.
Schools (NCES district)
- District
- Houston ISD
- NCES district ID
- 4823640
- Math proficiency
- 27% ▼ -18.00%
- Reading proficiency
- 35% ▼ -6.00%
- Median HH income
- $46,054
- Composite
- 26.63/100
- National rank
- #7173
- State rank
- #593 of 826 in TX
Livability — Houston
- Score
- 74/100
- State rank
- #184
- US rank
- #4771
Category grades
Schools grade is shown separately in the Schools card above.
Census & demographics
- Census place
- Houston, TX
- County
- Harris County · 4,702,590 people
- City population
- 3,226,434
- Metro
- Houston-The Woodlands-Sugar Land, TX
- Population (ZIP)
- 34,347
- Household income
- $52,847
- Rent vs Own
- Severe rent burden
- 1219.0
Population outlook (Harris County) Hauer SSP2
- Today (2025)
- 5,571,493 people
- By 2030
- 6,089,821 · +9.3%
- By 2040
- 7,142,806 · +28.2%
- By 2050
- 8,185,864 · +46.9%
- By 2075
- 10,574,329 · +89.8%
- By 2100
- 12,109,958 · +117.4%
Race, ethnicity, and origin ACS 2023
- Neighborhood character
- Predominantly Hispanic (78%)
- Race & ethnicity
- Hispanic / Latino 78% Two or more races 22% Black 16% White 5% Native American 2%
- Hispanic origin (detail)
- Mexican 64%
- Foreign-born
- 33% · Canada
- Languages at home
- 31% English-only · Spanish 69%
Political lean MEDSL · Harris
- 2024 margin
- Lean D (+5.5) · D 52.0% · R 46.4% · Other 1.6%
- 2008→2024 swing
- +3.9pp toward D · 2008: 1.6pp · 2024: 5.5pp
- All cycles
- 2024: D+5.5 2020: D+13.3 2016: D+12.4 2012: D+0.1 2008: D+1.6
Not yet ingested
- Civics
- —
Market trends
- HPI YoY
- ▼ -112.90%
- Current HPI
- 266.8467
- Rent YoY
- ▲ 0.55%
- Metro
- Houston-The Woodlands-Sugar Land, TX
- State GDP YoY
- ▲ 3.95%
- F500 in state
- 110
Industry mix (Fortune 500 HQ in TX)
| Industry | F500 HQs | Revenue |
|---|---|---|
| Energy | 16 | $1,198B |
|
||
| Technology | 5 | $198B |
|
||
| Engineering / Construction | 4 | $72B |
|
||
| Energy Services | 3 | $60B |
|
||
| Utilities | 3 | $41B |
|
||
| Healthcare | 2 | $330B |
|
||
Price history
2 events — show timeline
- 2026-06-13 Listed $127,500 HARMLS
- 1988-01-02 Sold (Public Records) — Public Records
Property tax history
+6.4%/yrLatest (2025): $3,416 · +8.1% YoY. Source: county tax records.
Cash-flow waterfall
monthlySold comps — $/sqft
last 12 mo · ≤1 miLoading sold comps…