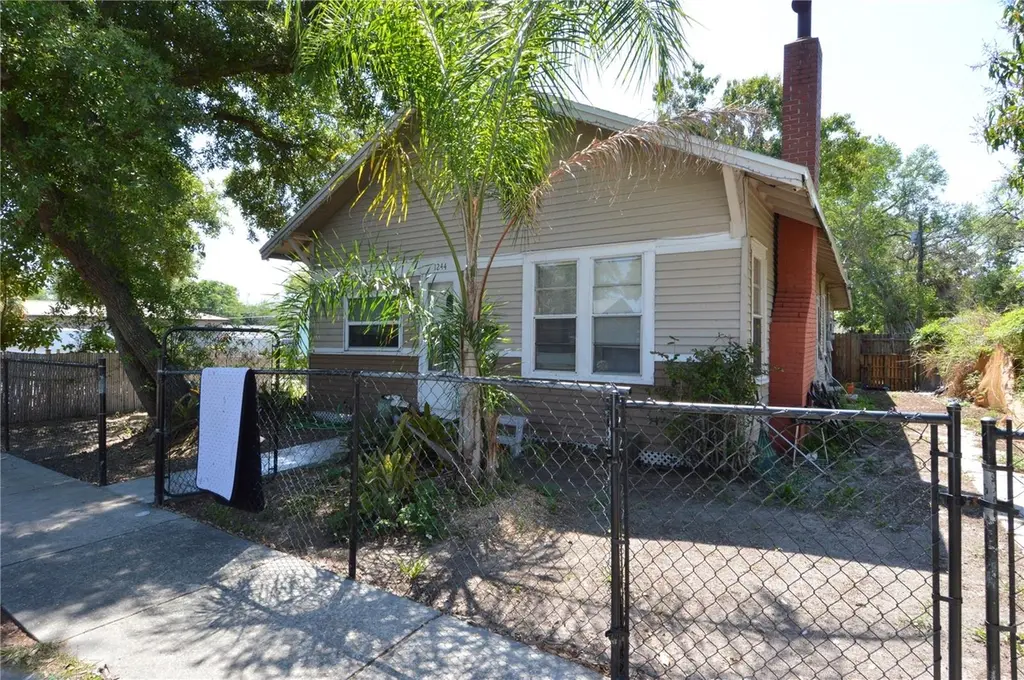
1244 20th Ave S · St. Petersburg, FL
Flood risk 1/10 · Minimal
- FEMA flood zone
- X (unshaded)
- Chance of flooding over 30 yrs
- 0.0%
- Est. flood insurance / yr
- $507 – $1,088
Fire risk 1/10 · Minimal
- Est. fire insurance / yr
- $947 – $1,759
Heat risk 10/10 · Severe
- Hot days now (above 106°F)
- 7 days/yr
- Hot days in 30 yrs
- 25 days/yr
Wind risk 10/10 · Severe
- Chance of severe wind over 30 yrs
- 99.0%
Air-quality risk 4/10 · Minor
- Unhealthy air days now
- 4 days/yr
- Unhealthy air days in 30 yrs
- 4 days/yr
Risk factors via First Street. Map © Google.
Why this score? — see what drove the C- grade
The composite is a weighted blend of 9 inputs, each scored 0–100. Each bar is that input's sub-score; the figure is the points it added to the 100-point composite (weight × sub-score).
- Cash flow +15.9/30.0
- ARV discount +15.0/15.0
- DSCR +4.9/10.0
- Schools +4.3/10.0
- 1% rule +3.7/10.0
- Rent growth +2.5/5.0
- Livability +2.5/5.0
- Condition / age +2.5/5.0
- Appreciation +0.0/10.0
$265,000
🖨 Deal sheet (PDF) 📄 Offer letter ✓ Due diligence
Listing remarks MLS
BANK OWNED!! NOT A SHORT SALE!! 3 BEDROOM 1.5 BATHROOMS, GREAT OPPORTUNITY TO BUY A HOUSE THAT NEEDS TLC AND MAKE IT YOUR OWN!!! LOCATED CLOSE TO SCHOOLS SHOPPING, AND INTERSTATE
Key facts
- Quiet street
- Spacious backyard
- 6,578 sq ft lot
Tags
Property features AI
Finance
- Other: Property type: Residential — Single Family Residence; Total living area reported as 1,425 square feet; Lot zoning indicated compatible; Property listed by ELITE TAMPA BAY REALTY LLC
- HOA & community: No HOA association indicated
Exterior
- Utilities: Public water; Public sewer; Electricity available and connected; Natural gas available; Cable available and connected; Water connected; Sewer connected
- Home design: Single family residence; One story; Faces north; Residential property
- Construction: Vinyl siding; Shingle roof; Slab foundation; Built in 1 story
- Exterior features: Asphalt road access; Lot approximately 0.15 acres (49 x 130)
Interior
- Kitchen: Range; Refrigerator
- Bedrooms: 3 bedrooms
- Flooring: Carpet; Ceramic tile
- Bathrooms: 1 full bathroom; 1 half bathroom
- Heating & cooling: Central heating (electric); Central air conditioning
- Interior features: Built-in features; Ceiling fans; Thermostat
- Laundry & utility: Laundry inside
Neighborhood map
What this means for you Summary
Snapshot
- This is a 3-bed/1.5-bath single-family listed at $265k.
Deal economics
- At list price, monthly cash flow is $126 ($2k/yr) — positive.
- The deal already cash-flows at list — no discount required.
- To meet the 1% rule (rent ≥ 1% of price), the offer needs to be $231k (12.7% below list).
- Recommended offer: $231k (12.7% below list) — sets the bar for 1% rule.
- Cap rate 6.9% vs local median 2.6% in St. Petersburg — top-decile yield for the area; either an underpriced asset or a hidden risk that comps aren't pricing in. Stress-test before assuming the spread holds.
Location & tenants
- Location reads: area grade C — affects rentability + tenant quality, not the cash-flow math above.
- Pinellas (suburban): math 51% / reading 51% proficiency, ranked #31 of 73 in FL (top 42%) — acceptable for families but not a draw, mixed tenant base, ~2y average lease.
- Zoned schools: Campbell Park Elementary School (math 19% / reading 19%, grade F, #2,111 of 2,144 statewide, top 99%, 462 students, 87% FRL); John Hopkins Middle School (math 25% / reading 27%, grade F, #506 of 571 statewide, top 89%, 723 students, 66% FRL); Gibbs High School (math 26% / reading 41%, grade F, #400 of 667 statewide, top 61%, 1,160 students, 64% FRL) — zoned schools average 73% FRL vs 48% district-wide (25 pts higher); higher-poverty schools than district average — tighter screening recommended.
- Zoned-school proficiency averages 26% at this address vs 51% district-wide (-25 pts) — the specific schools serving this property underperform the Pinellas average; the district grade overstates school quality for this exact location.
- Market conditions: Rents soft (-0.1%/yr); 308 active listings in the ZIP; 40 comparable units currently listed for rent nearby; rentals leasing fast (median 6d on market — plan ~1-2 weeks tenant-placement turnaround); 2,676 units permitted in Pinellas County in 2024 (1,422 in 5+ unit buildings).
Forward outlook
- Local home prices are declining (-3.0%/yr); year-one equity from $2k of loan paydown is wiped out by about $8k of value loss. Plan a longer hold.
- Pinellas County population projected at +14% by 2050 — modest demand growth; plan on rents tracking national, not racing it.
Negotiation context
- It's been on market 79 days — a 6% lower offer ($249k) is reasonable based on typical stale-listing flexibility.
- 8 sale attempts since 21y ago with the ask held roughly flat each time — persistent listings suggest the price (not the market) is what's stuck; bring a comps-based counter.
- Current owner paid $18k; list at $265k implies a 1372% gain — meaningful room to come down on a strong offer.
Risks & watch-outs
- Watch-outs: built in 1924 — expect roof / HVAC / electrical / plumbing capex.
- Climate carrying-cost: severe wind risk, 99% chance of damaging wind over 30y; extreme-heat days projected 7→25/yr by 2055 (HVAC capex compounding) — expect insurance premiums to compound above CPI over the hold.
Questions for the listing agent
- It's been on market 79 days. Have you received any prior offers? Is the seller open to a 13% concession, seller financing, or rate buy-down credit?
- Built in 1924 — when were the roof, HVAC, electrical panel, plumbing, and water heater last replaced?
- Why hasn't it sold? Are there any deal-killer items the seller is aware of (foundation, flood, title, zoning, code violations)?
- Is there a deadline driving the sale (1031 exchange, divorce, estate, relocation)? That informs how much negotiation room exists.
- What's the average days-on-market for RENTAL listings here right now (not sales)? A rising rental-DOM trend means longer vacancies and softer asking-rent achievability than the comps imply.
- What's the recent tenant-quality profile in this submarket — average credit score on applications, eviction rate, late-payment / NSF rate, and stable-employment percentage? A property-management company in the area should have these aggregated.
- How much new for-sale + rental construction is in the pipeline within 1–3 miles? Heavy new supply typically softens prices + rents 12–24 months out; constrained supply supports both.
Investment metrics
- 1% rule
- 0.87% ✗
- Cap rate
- 6.86%
- Cash-on-cash
- 2.04%
- DSCR
- 1.09
- GRM
- 9.5
CMA / ARV
- ARV (on-the-fly)
- $346,275
- Comps found
- 12
Show comp detail 12 sales within ~0.75 mi
| Address | Dist | Beds/Ba | Sqft | Sold | Price | $/sf | Match |
|---|---|---|---|---|---|---|---|
| 2324 13th St S | 0.21mi | 3/2.0 | 1,415 (-1%) | 8mo | $429,000 | $303 | 81 |
| 1618 20th Ave S | 0.23mi | 3/1.0 | 1,378 (-3%) | 3mo | $120,000 | $87 | 79 |
| 1717 Preston St S | 0.37mi | 3/2.0 | 1,421 (-0%) | 11mo | $345,000 | $243 | 71 |
| 1600 27th Ave S | 0.48mi | 3/2.0 | 1,524 (+7%) | 2mo | $212,000 | $139 | 62 |
| 834 18th Ave S | 0.41mi | 3/1.0 | 1,294 (-9%) | 3mo | $330,000 | $255 | 61 |
| 1126 Melrose Ave S | 0.48mi | 3/2.0 | 1,293 (-9%) | 1mo | $375,000 | $290 | 60 |
| 1333 Melrose Ave S | 0.51mi | 3/2.0 | 1,320 (-7%) | 5mo | $300,000 | $227 | 57 |
| 977 27th Ave S | 0.45mi | 3/1.0 | 1,308 (-8%) | 8mo | $158,000 | $121 | 57 |
| 1307 12th Ave S | 0.60mi | 4/2.0 (+1) | 1,349 (-5%) | 4mo | $240,000 | $178 | 53 |
| 1962 15th Ave S | 0.62mi | 3/1.0 | 1,245 (-13%) | 3mo | $122,000 | $98 | 46 |
| 2703 18th St S | 0.61mi | 3/2.0 | 1,221 (-14%) | 1mo | $329,900 | $270 | 45 |
| 650 27th Ave S | 0.73mi | 4/2.0 (+1) | 1,350 (-5%) | 13mo | $375,000 | $278 | 39 |
Match score weights: distance 35% · size 25% · config 20% · recency 20%. Top-matched comps best support the ARV.
Projected returns pro-forma
-3.0% appreciation · 0.0% rent growth · sell at horizon
- IRR
- -16.3%
- Equity multiple
- 0.44×
- Total profit
- $-41,732
- Equity at exit
- $39,512
- IRR
- -14.0%
- Equity multiple
- 0.29×
- Total profit
- $-52,384
- Equity at exit
- $22,912
Cash invested: $74,200 (down + closing). Projections, not guarantees.
Landlord ↔ Tenant lean methodology
- Overall (STATE)
- 87 Strongly Landlord-Friendly
- State Florida
- 87 Strongly Landlord-Friendly · R+3
- County
- — inherits STATE
- City
- — inherits STATE
ZIP-level market 33705
- Rents YoY
- -0.1%
- Active inventory
- 308
- Price-to-rent
- 9.5×
Monthly cashflow live
- Estimated rent
- $2,314 high interval (Pro) →
- Mortgage (P&I)
- −$1,390
- Tax from tax record
- −$202 /mo · $2,424/yr
- Insurance
- −$110
- HOA
- −$0
- Vacancy / Maint / Mgmt
- −$486
- Net cashflow
- $126
Break-even live
Sensitivity live
| Price | -10% $276 | -5% $201 | +0% $126 | +5% $51 | +10% $-24 |
|---|---|---|---|---|---|
| Rent | -10% $-57 | -5% $35 | +0% $126 | +5% $218 | +10% $309 |
| Rate | -1.0pp $260 | -0.5pp $194 | base $126 | +0.5pp $57 | +1.0pp $-12 |
UW: 25.0% down · 7.5% · 30yr · 1.5% tax · 5.0% vac · 8.0% maint · 8.0% mgmt
Financing live
Cash to close
- Down payment
- $66,250
- Closing costs
- $7,950
- Reserves months
- —
- Total cash needed
- —
Loan-product check · same deal, 3 products live
Conventional
25% down · 7.5% · 30yr
- Down + closing
- —
- Monthly P&I
- —
- Monthly cashflow
- —
- DSCR
- —
- Eligible?
- —
Personal DTI + credit; lowest rate.
DSCR
20% down · 8.5% · 30yr
- Down + closing
- —
- Monthly P&I
- —
- Monthly cashflow
- —
- DSCR
- —
- Eligible?
- —
No personal income docs; deal must DSCR.
Hard money
10% down · 12.0% · 12mo
- Down + closing
- —
- Monthly P&I
- —
- Monthly cashflow
- —
- DSCR
- —
- Eligible?
- —
Short-term bridge; refi at stabilization.
Rent comps 40 comps
| Address | Beds | Baths | Sqft | Rent | $/sqft | DOM | Units | Dist |
|---|---|---|---|---|---|---|---|---|
| 2003 10th St S Saint Petersburg, FL | 4.0 | 2.0 | 1620 | $2,349 | $1.45 | 9d | 1 | 0.16mi |
| 1715 14th St S St. Petersburg, FL | 2.0 | 1.0 | 1000 | $1,850 | $1.85 | 26d | 1 | 0.19mi |
| 1701 14th St S Unit A St. Petersburg, FL | 2.0 | 1.0 | 1100 | $1,950 | $1.77 | 26d | 1 | 0.20mi |
| 1013 20th Ave S Saint Petersburg, FL | 4.0 | 2.0 | 1124 | $1,775 | $1.58 | 0d | 1 | 0.22mi |
| 966 22nd Ave S Unit 109 St. Petersburg, FL | 2.0 | 2.0 | 900 | $1,795 | $1.99 | 9d | 1 | 0.27mi |
| 930 20th Ave S St. Petersburg, FL | 3.0 | 1.0 | 1190 | $1,950 | $1.64 | 0d | 1 | 0.28mi |
| 1900 17th St S Saint Petersburg, FL | 2.0 | 2.0 | 1027 | $3,260 | $3.17 | 0d | 1 | 0.29mi |
| 944 18th Ave S Unit A St. Petersburg, FL | 3.0 | 1.0 | 1013 | $2,100 | $2.07 | 19d | 1 | 0.30mi |
| 1535 13th St S Saint Petersburg, FL | 4.0 | 2.0 | 1716 | $2,850 | $1.66 | 26d | 1 | 0.32mi |
| 1763 Preston St S Saint Petersburg, FL | 3.0 | 1.0 | 1158 | $2,350 | $2.03 | 26d | 1 | 0.32mi |
| 1919 Doctor Martin Luther King Junior St S Unit 1/2 St. Petersburg, FL | 3.0 | 1.0 | 892 | $2,200 | $2.47 | 4d | 1 | 0.32mi |
| 1919 Doctor Martin Luther King Junior St S Unit 1/2 St. Petersburg, FL | 3.0 | 1.0 | 892 | $2,580 | $2.89 | 22d | 1 | 0.32mi |
| 1650 Prescott St S Saint Petersburg, FL | 3.0 | 1.0 | 960 | $2,100 | $2.19 | 6d | 1 | 0.35mi |
| 1760 Queen St S Saint Petersburg, FL | 3.0 | 1.0 | 1004 | $2,000 | $1.99 | 6d | 1 | 0.38mi |
| 1465 15th St S Saint Petersburg, FL | 3.0 | 1.5 | 1405 | $2,400 | $1.71 | 6d | 1 | 0.40mi |
| 1828 20th Ave S Saint Petersburg, FL | 3.0 | 1.0 | 1015 | $1,650 | $1.63 | 26d | 1 | 0.40mi |
| 1900 19th St S Saint Petersburg, FL | 4.0 | 1.0 | 1572 | $2,500 | $1.59 | 6d | 1 | 0.42mi |
| 1035 15th Ave S Saint Petersburg, FL | 2.0 | 1.0 | 1412 | $1,900 | $1.35 | 6d | 1 | 0.43mi |
| 1427 15th St S Saint Petersburg, FL | 3.0 | 1.0 | 1030 | $2,095 | $2.03 | 6d | 1 | 0.45mi |
| 1847 19th St S Saint Petersburg, FL | 3.0 | 2.0 | 1203 | $2,295 | $1.91 | 6d | 1 | 0.45mi |
| 1911 22nd Ave S St Petersburg, FL | 4.0 | 2.0 | 1424 | $3,000 | $2.11 | 4d | 1 | 0.46mi |
| 2505 18th St S Saint Petersburg, FL | 3.0 | 2.0 | 1198 | $2,350 | $1.96 | 6d | 1 | 0.49mi |
| 1349 15th St S Saint Petersburg, FL | 3.0 | 2.0 | 1702 | $2,700 | $1.59 | 26d | 1 | 0.49mi |
| 2033 20th St S Saint Petersburg, FL | 3.0 | 1.0 | 1752 | $1,775 | $1.01 | 6d | 1 | 0.51mi |
| 1317 14th St S St Petersburg, FL | 4.0 | 2.0 | 1236 | $2,150 | $1.74 | 26d | 1 | 0.52mi |
| 2524 19th St S Saint Petersburg, FL | 4.0 | 2.0 | 1230 | $2,495 | $2.03 | 26d | 1 | 0.53mi |
| 1218 13th Ave S Saint Petersburg, FL | 3.0 | 2.0 | 1356 | $2,594 | $1.91 | 6d | 1 | 0.54mi |
| 2230 Grove St S Saint Petersburg, FL | 2.0 | 1.0 | 1108 | $1,750 | $1.58 | 6d | 1 | 0.56mi |
| 2621 18th St S Saint Petersburg, FL | 3.0 | 1.0 | 1114 | $2,200 | $1.97 | 26d | 1 | 0.56mi |
| 773 W Harbor Dr S Saint Petersburg, FL | 4.0 | 2.0 | 1495 | $2,800 | $1.87 | 26d | 1 | 0.58mi |
| 711 18th Ave S Unit 2 St. Petersburg, FL | 2.0 | 1.0 | 896 | $1,295 | $1.45 | 5d | 1 | 0.58mi |
| 2435 20th St S Unit 1 St. Petersburg, FL | 4.0 | 2.0 | 1230 | $2,650 | $2.15 | 26d | 1 | 0.58mi |
| 1311 Prescott St S Saint Petersburg, FL | 4.0 | 2.0 | 1048 | $2,000 | $1.91 | 0d | 1 | 0.58mi |
| 888 14th Ave S St Petersburg, FL | 2.0 | 1.0 | 1084 | $1,825 | $1.68 | 6d | 1 | 0.60mi |
| 1920 14th Ave S Saint Petersburg, FL | 3.0 | 2.0 | 1073 | $1,865 | $1.74 | 26d | 1 | 0.62mi |
| 2935 Dr Martin Luther King Jr St S Saint Petersburg, FL | 4.0 | 1.0 | 1042 | $1,895 | $1.82 | 6d | 1 | 0.66mi |
| 2028 14th Ave S Unit A St. Petersburg, FL | 2.0 | 2.0 | 1000 | $1,920 | $1.92 | 26d | 1 | 0.66mi |
| 2020 14th Ave S Unit A St. Petersburg, FL | 2.0 | 2.0 | 1000 | $1,920 | $1.92 | 9d | 1 | 0.66mi |
| 2010 22nd St S Saint Petersburg, FL | 3.0 | 1.0 | 1036 | $1,695 | $1.64 | 6d | 1 | 0.66mi |
| 675 17th Ave S Unit 1 St. Petersburg, FL | 2.0 | 1.0 | 1000 | $1,950 | $1.95 | 26d | 1 | 0.67mi |
Listing history 36 events
-
2026-06-22days on market $265,000 Active 79 DOM
-
2026-06-18days on market $265,000 Active 76 DOM
-
2026-06-17days on market $265,000 Active 75 DOM
-
2026-06-16days on market $265,000 Active 74 DOM
-
2026-06-15days on market $265,000 Active 73 DOM
-
2026-06-13days on market $265,000 Active 71 DOM
-
2026-06-09days on market $265,000 Active 67 DOM
-
2026-06-08days on market $265,000 Active 66 DOM
-
2026-06-07days on market $265,000 Active 65 DOM
-
2026-06-04days on market $265,000 Active 62 DOM
-
2026-06-03days on market $265,000 Active 61 DOM
-
2026-06-01days on market $265,000 Active 59 DOM
-
2026-05-31days on market $265,000 Active 58 DOM
-
2026-05-09price $265,000
-
2026-04-03$275,000 Active
-
2025-04-02historical $2,450
-
2025-03-05price $2,450
-
2025-02-12$2,575
-
2025-01-20historical
-
2024-05-21price $289,000
-
2024-04-01price $299,000
-
2024-03-15price $319,900
-
2024-01-24price $329,000
-
2023-12-18price $339,000
-
2023-09-11$329,000 Active
-
2009-08-26soldstatus $18,000 178-char remark
Show marketing remark (178 chars)
BANK OWNED!! NOT A SHORT SALE!! 3 BEDROOM 1.5 BATHROOMS, GREAT OPPORTUNITY TO BUY A HOUSE THAT NEEDS TLC AND MAKE IT YOUR OWN!!! LOCATED CLOSE TO SCHOOLS SHOPPING, AND INTERSTATE
-
2009-07-28$24,800 178-char remark
Show marketing remark (178 chars)
BANK OWNED!! NOT A SHORT SALE!! 3 BEDROOM 1.5 BATHROOMS, GREAT OPPORTUNITY TO BUY A HOUSE THAT NEEDS TLC AND MAKE IT YOUR OWN!!! LOCATED CLOSE TO SCHOOLS SHOPPING, AND INTERSTATE
-
2006-05-15soldstatus $120,000
-
2006-04-13soldstatus $64,000
-
2006-02-28$124,900
-
2005-10-19historical
-
2005-10-03$78,900
-
2005-04-28$71,000
-
2005-04-20soldstatus $43,000
-
2005-04-13soldstatus $43,000
-
2005-01-09$50,000
ⓘ Source: listings_history table (triggers on properties + properties_extension) + one-shot
backfill from property_details.listing_events for pre-trigger history.
Tax reassessment forecast FL · Resets to sale price
- Current annual tax
- $2,424 · $202/mo
- Projected year-2 tax
- $2,424 · $202/mo
- Expected delta
- $0/yr ($0/mo · 0.0%)
ⓘ Screening estimate from a state-policy table — verify with the county assessor before closing.
Climate risk First Street
- Flood 1/10 Low FEMA zone X (unshaded) · 0% chance over 30 yrs
- Wildfire 1/10 Low
- Heat 10/10 Extreme 7 d/yr ≥106°F today · 25 d/yr by 30 yrs out
- Wind 10/10 Extreme 99% chance of damaging wind over 30 yrs
- Air quality 4/10 Moderate 4 unhealthy d/yr today · 4 by 30 yrs out
Nearby sold comps map
Loading sold comps map…
Walkable amenities ~0.75 mi
Loading nearby amenities…
Taxation est. · year 1
- Rental income
- $27,771
- − Mortgage interest
- −$14,844
- − Property taxes
- −$2,424
- − Insurance
- −$1,325
- − Repairs & maintenance
- −$2,222
- − Management
- −$2,222
- − Depreciation
- −$7,709
- Taxable loss
- −$2,974
- Est. tax savings @ 24.0%
- +$714
- After-tax cash flow
- $2,228/yr
For passive investors: Depreciation is non-cash, so a rental often shows a tax loss while cash-flowing — sheltering income. Rental losses are passive: they offset passive income freely, and up to $25,000/yr can offset ordinary (W-2) income if you actively participate and your MAGI is under $100k (phasing out to $0 by $150k); unused losses carry forward. On sale, claimed depreciation is recaptured at up to 25%, and gains may owe capital-gains tax (a 1031 exchange can defer both). Figures are a year-1 estimate at your 24.0% rate — not tax advice; consult a CPA.
Schools (NCES district)
- District
- Pinellas
- NCES district ID
- 1201560
- Math proficiency
- 51% ▼ -5.00%
- Reading proficiency
- 51% ▼ -3.00%
- Median HH income
- $46,270
- Composite
- 43.27/100
- National rank
- #3046
- State rank
- #31 of 73 in FL
Livability — St. Petersburg
No livability data for this city. (Only ~50 U.S. cities are tracked.)
Census & demographics
- Census place
- St. Petersburg, FL
- County
- Pinellas County · 939,478 people
- City population
- 249,151
- Metro
- Tampa-St. Petersburg-Clearwater, FL
- Population (ZIP)
- 27,939
- Household income
- $73,027
- Rent vs Own
- Severe rent burden
- 1386.0
Population outlook (Pinellas County) Hauer SSP2
- Today (2025)
- 1,027,532 people
- By 2030
- 1,063,586 · +3.5%
- By 2040
- 1,125,020 · +9.5%
- By 2050
- 1,168,637 · +13.7%
- By 2075
- 1,265,188 · +23.1%
- By 2100
- 1,260,357 · +22.7%
Race, ethnicity, and origin ACS 2023
- Neighborhood character
- Diverse neighborhood (Simpson 0.64)
- Race & ethnicity
- Black 44% White 41% Two or more races 10% Hispanic / Latino 5%
- Hispanic origin (detail)
- Puerto Rican 1%
- Common ancestry
- Lithuanian 2% Italian 1% Slovak 1%
- Foreign-born
- 9% · Canada, Dominican Republic
- Languages at home
- 92% English-only · Spanish 4% Other Indo-European 1% Russian/Polish/Slavic 1%
Political lean MEDSL · Pinellas
- 2024 margin
- Lean R (+5.2) · D 46.9% · R 52.1%
- 2008→2024 swing
- -13.5pp toward R · 2008: 8.3pp · 2024: -5.2pp
- All cycles
- 2024: R+5.2 2020: D+0.2 2016: R+1.1 2012: D+5.6 2008: D+8.3
Not yet ingested
- Civics
- —
Market trends
- HPI YoY
- ▼ -540.28%
- Current HPI
- 388.3086
- Rent YoY
- ▼ -0.13%
- Metro
- Tampa-St. Petersburg-Clearwater, FL
- State GDP YoY
- ▲ 3.28%
- F500 in state
- 36
Industry mix (Fortune 500 HQ in FL)
| Industry | F500 HQs | Revenue |
|---|---|---|
| Industrial Technology | 2 | $29B |
|
||
| Insurance | 2 | $17B |
|
||
| Retail | 1 | $60B |
|
||
| Technology Distribution | 1 | $58B |
|
||
| Homebuilding | 1 | $35B |
|
||
| Technology Manufacturing | 1 | $35B |
|
||
Price history
+430.0% since first listed23 events — show timeline
- 2026-05-09 Price Changed $265,000 Stellar MLS as Distributed by MLS Grid
- 2026-04-03 Listed $275,000 Stellar MLS as Distributed by MLS Grid
- 2025-04-02 Rental Removed $2,450 STELLARMLS
- 2025-03-05 Price Changed $2,450 STELLARMLS
- 2025-02-12 Listed for Rent $2,575 STELLARMLS
- 2025-01-20 Listing Removed — Stellar MLS as Distributed by MLS Grid
- 2024-05-21 Price Changed $289,000 Stellar MLS as Distributed by MLS Grid
- 2024-04-01 Price Changed $299,000 Stellar MLS as Distributed by MLS Grid
- 2024-03-15 Price Changed $319,900 Stellar MLS as Distributed by MLS Grid
- 2024-01-24 Price Changed $329,000 Stellar MLS as Distributed by MLS Grid
- 2023-12-18 Price Changed $339,000 Stellar MLS as Distributed by MLS Grid
- 2023-09-11 Listed $329,000 Stellar MLS as Distributed by MLS Grid
- 2009-08-26 Sold (MLS) $18,000 Stellar MLS as Distributed by MLS Grid
- 2009-07-28 Listed $24,800 Stellar MLS as Distributed by MLS Grid
- 2006-05-15 Sold (Public Records) $120,000 Public Records
- 2006-04-13 Sold (Public Records) $64,000 Public Records
- 2006-02-28 Listed $124,900 Stellar MLS as Distributed by MLS Grid
- 2005-10-19 Listing Removed — Stellar MLS as Distributed by MLS Grid
- 2005-10-03 Listed $78,900 Stellar MLS as Distributed by MLS Grid
- 2005-04-28 Listed $71,000 Stellar MLS as Distributed by MLS Grid
- 2005-04-20 Sold (Public Records) $43,000 Public Records
- 2005-04-13 Sold (MLS) $43,000 Stellar MLS as Distributed by MLS Grid
- 2005-01-09 Listed $50,000 Stellar MLS as Distributed by MLS Grid
Property tax history
+16.2%/yrLatest (2025): $2,424 · +19.7% YoY. Source: county tax records.
Cash-flow waterfall
monthlySold comps — $/sqft
last 12 mo · ≤1 miLoading sold comps…