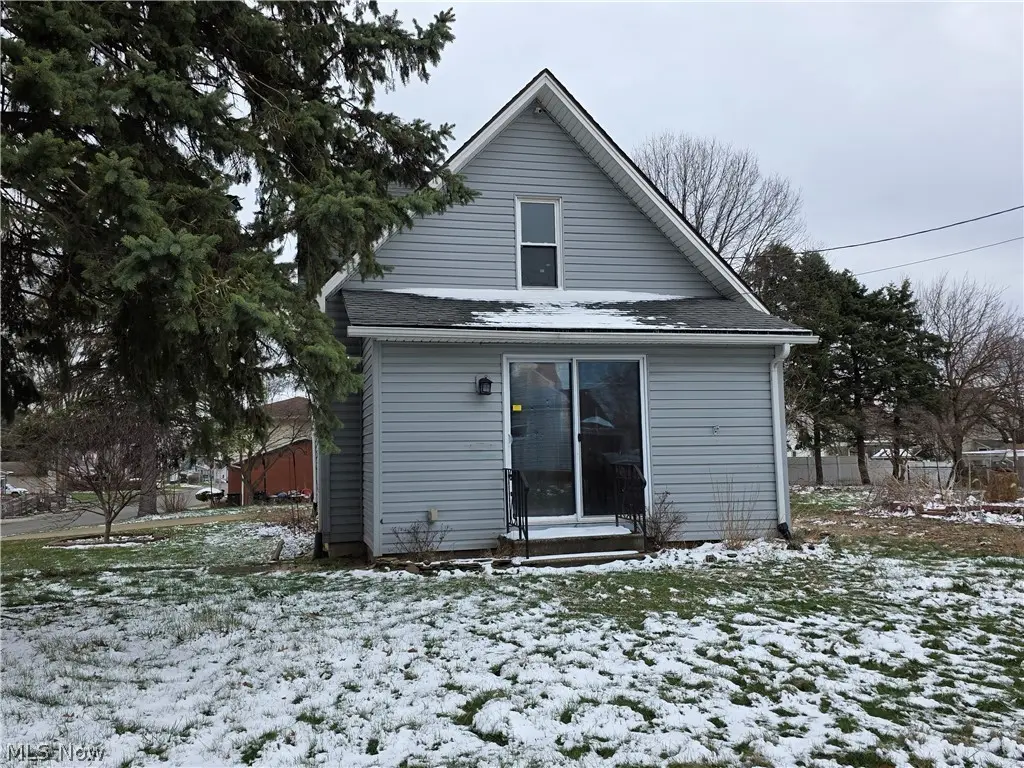
1600 Sandwith Ave SW · Canton, OH
Flood risk 1/10 · Minimal
- FEMA flood zone
- X (unshaded)
- Chance of flooding over 30 yrs
- 0.0%
- Est. flood insurance / yr
- $473 – $860
Fire risk 1/10 · Minimal
- Est. fire insurance / yr
- $713 – $1,323
Heat risk 3/10 · Minor
- Hot days now (above 96°F)
- 7 days/yr
- Hot days in 30 yrs
- 17 days/yr
Wind risk 1/10 · Minimal
- Chance of severe wind over 30 yrs
- —
Air-quality risk 2/10 · Minimal
- Unhealthy air days now
- 0 days/yr
- Unhealthy air days in 30 yrs
- 1 days/yr
Risk factors via First Street. Map © Google.
Why this score? — see what drove the B grade
The composite is a weighted blend of 9 inputs, each scored 0–100. Each bar is that input's sub-score; the figure is the points it added to the 100-point composite (weight × sub-score).
- Cash flow +30.0/30.0
- ARV discount +15.0/15.0
- DSCR +10.0/10.0
- 1% rule +8.8/10.0
- Livability +3.6/5.0
- Rent growth +2.5/5.0
- Condition / age +2.5/5.0
- Schools +1.7/10.0
- Appreciation +0.0/10.0
$59,900
🖨 Deal sheet (PDF) 📄 Offer letter ✓ Due diligence
Listing remarks MLS
Cozy one bedroom bungalow. Large bedroom with built ins on 2nd floor, full basement with a partial bathroom in the corner. It has a first floor bathroom and large living room with a bonus room. The large corner lot is made up of three parcels. With some TLC this house has many possibilities: investment, starter home, or downsize.
Key facts
- Built ins
- Bonus room
- Full basement
Tags
Neighborhood map
What this means for you Summary
Snapshot
- This is a 1-bed/1.0-bath single-family listed at $60k.
Deal economics
- At list price, monthly cash flow is $283 ($3k/yr) — positive.
- The deal already cash-flows at list — no discount required.
- Meets the 1% rule at list price ($826 rent vs $60k).
- Recommended offer: $56k (6.0% below list) — sets the bar for market timing.
- Cap rate 12.0% vs local median 5.1% in Canton — top-decile yield for the area; either an underpriced asset or a hidden risk that comps aren't pricing in. Stress-test before assuming the spread holds.
Location & tenants
- Location reads 71/100 on livability (#441 in OH) — a middle-class / working-renter tenant base. Strengths: commute A+, cost of living A+, housing A; Watch: crime F, employment F.
- Canton City (urban): math 17% / reading 26% proficiency, ranked #627 of 656 in OH (top 96%) — low school quality limits family demand, transient renter base, plan for 1-2y turnover; 76% free/reduced lunch — lower-income household profile, screen leases tightly.
- Market conditions: 87 active listings in the ZIP; 6 comparable units currently listed for rent nearby; rentals lingering (median 44d on market — plan ~5-8 weeks vacancy on turnover, expect pricing pressure); 67% of comp listings sitting > 30 days — soft ceiling on asking rent; 528 units permitted in Stark County in 2024 (84 in 5+ unit buildings).
- This rent is only 17% of the median local income ($58k/yr) — well below the 30% rent-burden line; pricing power to push rent on renewal without tenant pushback.
Forward outlook
- Local home prices are declining (-3.0%/yr); year-one equity from $414 of loan paydown is wiped out by about $2k of value loss. Plan a longer hold.
- Stark County population projected to shrink 8% by 2050 — rents likely to lag national; underwrite the cash flow, not the appreciation.
- At projected returns (-3.0% appreciation + 3.0% rent growth), your $17k cash investment doubles in ~7 years — after that, you're playing with house money.
Negotiation context
- It's been on market 90 days — a 6% lower offer ($56k) is reasonable based on typical stale-listing flexibility.
- 2 sale attempts since 7y ago; this cycle's ask has dropped $12k (17%) from the opening price — seller is motivated, your offer sets the floor, not the list.
Risks & watch-outs
- Watch-outs: built in 1903 — expect roof / HVAC / electrical / plumbing capex.
Questions for the listing agent
- It's been on market 90 days. Have you received any prior offers? Is the seller open to a 6% concession, seller financing, or rate buy-down credit?
- Built in 1903 — when were the roof, HVAC, electrical panel, plumbing, and water heater last replaced?
- Why hasn't it sold? Are there any deal-killer items the seller is aware of (foundation, flood, title, zoning, code violations)?
- Is there a deadline driving the sale (1031 exchange, divorce, estate, relocation)? That informs how much negotiation room exists.
- Crime grade is F in this area — have there been break-ins, vandalism, or insurance claims at this property in the last 3 years? What carrier currently insures it and at what premium?
- What's the average days-on-market for RENTAL listings here right now (not sales)? A rising rental-DOM trend means longer vacancies and softer asking-rent achievability than the comps imply.
- What's the recent tenant-quality profile in this submarket — average credit score on applications, eviction rate, late-payment / NSF rate, and stable-employment percentage? A property-management company in the area should have these aggregated.
- How much new for-sale + rental construction is in the pipeline within 1–3 miles? Heavy new supply typically softens prices + rents 12–24 months out; constrained supply supports both.
Investment metrics
- 1% rule
- 1.38% ✓
- Cap rate
- 11.95%
- Cash-on-cash
- 20.22%
- DSCR
- 1.90
- GRM
- 6.0
CMA / ARV
- ARV (median comp)
- $80,320
- List price
- $59,900
- Delta
- -25.42%
- Verdict
- UNDERPRICED
- Comps
- 20 within 1.0 mi
Show comp detail 11 sales within ~0.75 mi
| Address | Dist | Beds/Ba | Sqft | Sold | Price | $/sf | Match |
|---|---|---|---|---|---|---|---|
| 1540 Tanner Ave SW | 0.07mi | 2/1.0 (+1) | 768 (-2%) | 10mo | $82,500 | $107 | 81 |
| 1640 Bedford Ave SW | 0.23mi | 2/1.5 (+1) | 780 (0%) | 2mo | $125,000 | $160 | 80 |
| 1549 Quimby Ave SW | 0.17mi | 2/1.0 (+1) | 832 (+7%) | 9mo | $70,000 | $84 | 68 |
| 1638 Frederick Ave SW | 0.13mi | 2/1.0 (+1) | 825 (+6%) | 20mo | $40,000 | $48 | 63 |
| 1412 Bellflower Ave SW | 0.43mi | 2/1.5 (+1) | 816 (+5%) | 4mo | $93,900 | $115 | 62 |
| 1636 Holland Ct SW | 0.12mi | 2/1.0 (+1) | 864 (+11%) | 16mo | $105,560 | $122 | 58 |
| 1729 Gambrinus Ave SW | 0.59mi | 1/1.5 | 709 (-9%) | 2mo | $112,000 | $158 | 54 |
| 1207 Linwood Ave SW | 0.70mi | 2/1.0 (+1) | 744 (-5%) | 2mo | $130,000 | $175 | 53 |
| 1262 Ardmore Ave SW | 0.42mi | 2/1.0 (+1) | 872 (+12%) | 11mo | $83,000 | $95 | 47 |
| 3000 Windsor Pl | 0.32mi | 2/1.0 (+1) | 682 (-13%) | 20mo | $75,000 | $110 | 42 |
| 1144 Homewood Ave SW | 0.57mi | 2/1.0 (+1) | 676 (-13%) | 13mo | $79,500 | $118 | 36 |
Match score weights: distance 35% · size 25% · config 20% · recency 20%. Top-matched comps best support the ARV.
Projected returns pro-forma
-3.0% appreciation · 3.0% rent growth · sell at horizon
- IRR
- 12.4%
- Equity multiple
- 1.49×
- Total profit
- $8,279
- Equity at exit
- $8,931
- IRR
- 21.3%
- Equity multiple
- 2.81×
- Total profit
- $30,327
- Equity at exit
- $5,179
Cash invested: $16,772 (down + closing). Projections, not guarantees.
Landlord ↔ Tenant lean methodology
- Overall (STATE)
- 73 Landlord-Friendly
- State Ohio
- 73 Landlord-Friendly · R+6
- County
- — inherits STATE
- City
- — inherits STATE
ZIP-level market 44706
- Active inventory
- 87
- Price-to-rent
- 6.0×
Monthly cashflow live
- Estimated rent
- $826 high interval (Pro) →
- Mortgage (P&I)
- −$314
- Tax from tax record
- −$31 /mo · $369/yr
- Insurance
- −$25
- HOA
- −$0
- Vacancy / Maint / Mgmt
- −$173
- Net cashflow
- $283
Break-even live
Sensitivity live
| Price | -10% $317 | -5% $300 | +0% $283 | +5% $266 | +10% $249 |
|---|---|---|---|---|---|
| Rent | -10% $217 | -5% $250 | +0% $283 | +5% $315 | +10% $348 |
| Rate | -1.0pp $313 | -0.5pp $298 | base $283 | +0.5pp $267 | +1.0pp $251 |
UW: 25.0% down · 7.5% · 30yr · 1.5% tax · 5.0% vac · 8.0% maint · 8.0% mgmt
Financing live
Cash to close
- Down payment
- $14,975
- Closing costs
- $1,797
- Reserves months
- —
- Total cash needed
- —
Loan-product check · same deal, 3 products live
Conventional
25% down · 7.5% · 30yr
- Down + closing
- —
- Monthly P&I
- —
- Monthly cashflow
- —
- DSCR
- —
- Eligible?
- —
Personal DTI + credit; lowest rate.
DSCR
20% down · 8.5% · 30yr
- Down + closing
- —
- Monthly P&I
- —
- Monthly cashflow
- —
- DSCR
- —
- Eligible?
- —
No personal income docs; deal must DSCR.
Hard money
10% down · 12.0% · 12mo
- Down + closing
- —
- Monthly P&I
- —
- Monthly cashflow
- —
- DSCR
- —
- Eligible?
- —
Short-term bridge; refi at stabilization.
Rent comps 6 comps
| Address | Beds | Baths | Sqft | Rent | $/sqft | DOM | Units | Dist |
|---|---|---|---|---|---|---|---|---|
| 1229 Lawn Ave SW Canton, OH | 2.0 | 1.0 | 936 | $950 | $1.01 | 44d | 1 | 0.78mi |
| 1511 Stark Ave SW Canton, OH | 1.0 | 1.0 | 992 | $900 | $0.91 | 14d | 1 | 0.87mi |
| 1511 Stark Ave SW Canton, OH | 2.0 | 1.0 | 992 | $900 | $0.91 | 44d | 1 | 0.87mi |
| 605 Smith Ave SW #2 Canton, OH | 1.0 | 1.0 | 668 | $795 | $1.19 | 44d | 1 | 1.07mi |
| 2237 Tuscarawas St W Canton, OH | 2.0 | 1.0 | 1035 | $700 | $0.68 | 21d | 1 | 1.30mi |
| 2237 Tuscarawas St W Unit 7 Canton, OH | 2.0 | 1.0 | 1035 | $725 | $0.70 | 44d | 1 | 1.30mi |
Listing history 21 events
-
2026-06-17days on market $59,900 Active 90 DOM
-
2026-06-16days on market $59,900 Active 89 DOM
-
2026-06-15days on market $59,900 Active 88 DOM
-
2026-06-14days on market $59,900 Active 86 DOM
-
2026-06-13days on market $59,900 Active 85 DOM
-
2026-06-10days on market $59,900 Active 83 DOM
-
2026-06-09days on market $59,900 Active 82 DOM
-
2026-06-08days on market $59,900 Active 81 DOM
-
2026-06-07days on market $59,900 Active 80 DOM
-
2026-06-05days on market $59,900 Active 77 DOM
-
2026-06-03days on market $59,900 Active 76 DOM
-
2026-06-02days on market $59,900 Active 75 DOM
-
2026-06-01days on market $59,900 Active 74 DOM
-
2026-05-31days on market $59,900 Active 73 DOM
-
2026-05-30days on market $59,900 Active 72 DOM
-
2026-03-17$71,900 Active 332-char remark
Show marketing remark (332 chars)
Cozy one bedroom bungalow. Large bedroom with built ins on 2nd floor, full basement with a partial bathroom in the corner. It has a first floor bathroom and large living room with a bonus room. The large corner lot is made up of three parcels. With some TLC this house has many possibilities: investment, starter home, or downsize.
-
2025-09-03soldstatus $54,000
-
2019-09-04historical
-
2019-06-10$42,000 Active
-
1996-11-21soldstatus $17,400
-
1992-08-20soldstatus $280
ⓘ Source: listings_history table (triggers on properties + properties_extension) + one-shot
backfill from property_details.listing_events for pre-trigger history.
Tax reassessment forecast OH · Partial reset (capped growth)
- Current annual tax
- $369 · $31/mo
- Projected year-2 tax
- $652 · $54/mo
- Expected delta
- +$283/yr (+$24/mo · 76.5%)
ⓘ Screening estimate from a state-policy table — verify with the county assessor before closing.
Climate risk First Street
- Flood 1/10 Low FEMA zone X (unshaded) · 0% chance over 30 yrs
- Wildfire 1/10 Low
- Heat 3/10 Moderate 7 d/yr ≥96°F today · 17 d/yr by 30 yrs out
- Wind 1/10 Low
- Air quality 2/10 Low 0 unhealthy d/yr today · 1 by 30 yrs out
Nearby sold comps map
Loading sold comps map…
Walkable amenities ~0.75 mi
Loading nearby amenities…
Taxation est. · year 1
- Rental income
- $9,911
- − Mortgage interest
- −$3,355
- − Property taxes
- −$369
- − Insurance
- −$300
- − Repairs & maintenance
- −$793
- − Management
- −$793
- − Depreciation
- −$1,743
- Taxable income
- $2,558
- Est. tax owed @ 24.0%
- −$614
- After-tax cash flow
- $2,777/yr
For passive investors: Depreciation is non-cash, so a rental often shows a tax loss while cash-flowing — sheltering income. Rental losses are passive: they offset passive income freely, and up to $25,000/yr can offset ordinary (W-2) income if you actively participate and your MAGI is under $100k (phasing out to $0 by $150k); unused losses carry forward. On sale, claimed depreciation is recaptured at up to 25%, and gains may owe capital-gains tax (a 1031 exchange can defer both). Figures are a year-1 estimate at your 24.0% rate — not tax advice; consult a CPA.
Schools (NCES district)
- District
- Canton City
- NCES district ID
- 3904371
- Math proficiency
- 17% ▼ -17.00%
- Reading proficiency
- 26% ▼ -12.00%
- Median HH income
- $28,825
- Composite
- 17.1/100
- National rank
- #9116
- State rank
- #627 of 656 in OH
Livability — Canton
- Score
- 71/100
- State rank
- #441
- US rank
- #7259
Category grades
Schools grade is shown separately in the Schools card above.
Census & demographics
- Census place
- Canton, OH
- County
- Stark County · 272,865 people
- City population
- 103,614
- Metro
- Canton-Massillon, OH
- Population (ZIP)
- 16,496
- Household income
- $58,228
- Rent vs Own
- Severe rent burden
- 502.0
Population outlook (Stark County) Hauer SSP2
- Today (2025)
- 373,708 people
- By 2030
- 371,245 · -0.7%
- By 2040
- 361,331 · -3.3%
- By 2050
- 345,290 · -7.6%
- By 2075
- 302,669 · -19.0%
- By 2100
- 238,870 · -36.1%
Race, ethnicity, and origin ACS 2023
- Neighborhood character
- Predominantly White (84%)
- Race & ethnicity
- White 84% Black 8% Two or more races 6% Hispanic / Latino 3%
- Common ancestry
- Romanian 4% Italian 3% Lithuanian 2%
- Foreign-born
- 1% · Canada
- Languages at home
- 98% English-only · Spanish 2%
Political lean MEDSL · Stark
- 2024 margin
- Strong R (+21.9) · D 38.6% · R 60.5%
- 2008→2024 swing
- -27.4pp toward R · 2008: 5.5pp · 2024: -21.9pp
- All cycles
- 2024: R+21.9 2020: R+18.5 2016: R+17.4 2012: R+0.4 2008: D+5.5
Not yet ingested
- Civics
- —
Market trends
- HPI YoY
- ▼ -156.35%
- Current HPI
- 239.851
- Rent YoY
- —
- Metro
- Canton-Massillon, OH
- State GDP YoY
- ▲ 1.98%
- F500 in state
- 48
Industry mix (Fortune 500 HQ in OH)
| Industry | F500 HQs | Revenue |
|---|---|---|
| Insurance | 3 | $145B |
|
||
| Industrial Machinery | 3 | $49B |
|
||
| Financial Services | 3 | $24B |
|
||
| Consumer Goods | 2 | $93B |
|
||
| Aerospace / Defense | 2 | $47B |
|
||
| Utilities | 2 | $33B |
|
||
Price history
+313.2% since first listed6 events — show timeline
- 2026-03-17 Listed $71,900 MLSNOW
- 2025-09-03 Sold (Public Records) $54,000 Public Records
- 2019-09-04 Listing Removed — MLSNOW
- 2019-06-10 Listed $42,000 MLSNOW
- 1996-11-21 Sold (Public Records) $17,400 Public Records
- 1992-08-20 Sold (Public Records) $280 Public Records
Property tax history
+23.8%/yrLatest (2024): $369 · +281.8% YoY. Source: county tax records.
Cash-flow waterfall
monthlySold comps — $/sqft
last 12 mo · ≤1 miLoading sold comps…