 🔨 Auction
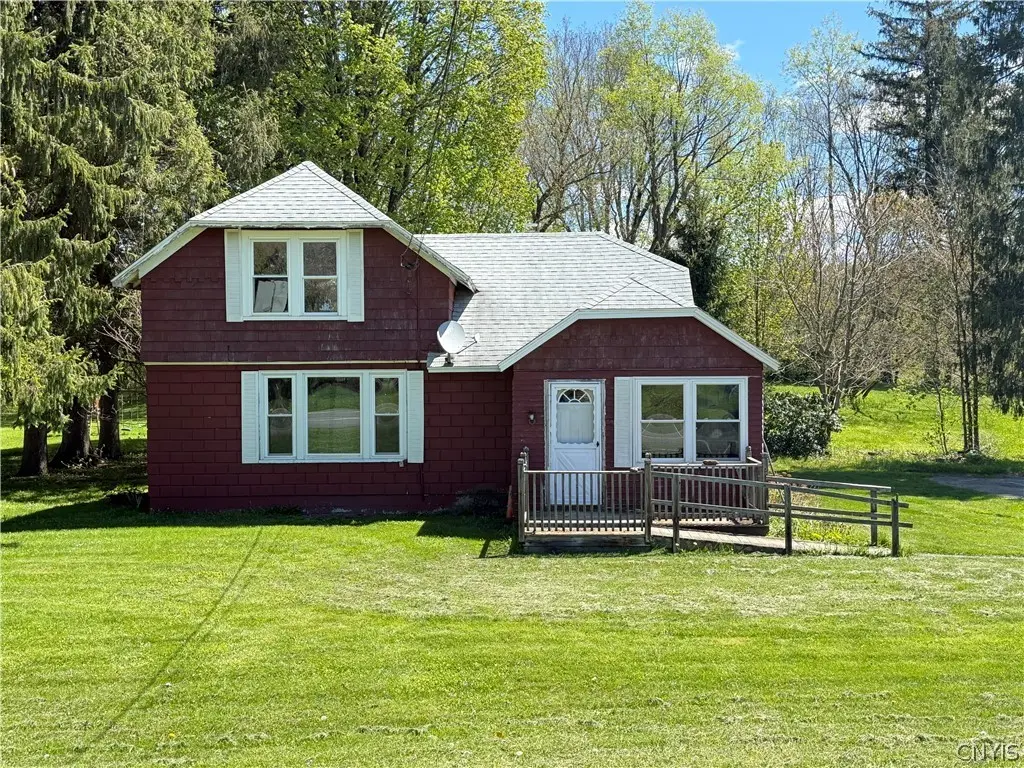
2862 State Route 26 · Cincinnatus, NY
Flood risk 1/10 · Minimal
- FEMA flood zone
- X (unshaded)
- Chance of flooding over 30 yrs
- 0.0%
- Est. flood insurance / yr
- $473 – $860
Fire risk 2/10 · Minimal
- Est. fire insurance / yr
- $691 – $1,283
Heat risk 2/10 · Minimal
- Hot days now (above 93°F)
- 7 days/yr
- Hot days in 30 yrs
- 17 days/yr
Wind risk 2/10 · Minimal
- Chance of severe wind over 30 yrs
- 1.0%
Air-quality risk 2/10 · Minimal
- Unhealthy air days now
- 0 days/yr
- Unhealthy air days in 30 yrs
- 1 days/yr
Risk factors via First Street. Map © Google.
Why this score? — see what drove the D- grade
The composite is a weighted blend of 9 inputs, each scored 0–100. Each bar is that input's sub-score; the figure is the points it added to the 100-point composite (weight × sub-score).
- Appreciation +10.0/10.0
- ARV discount +7.5/15.0
- Cash flow +6.6/30.0
- Schools +4.8/10.0
- Rent growth +2.5/5.0
- Livability +2.5/5.0
- Condition / age +2.5/5.0
- 1% rule +1.7/10.0
- DSCR +0.9/10.0
$44,900
🖨 Deal sheet 📄 Offer letter ✓ Due diligence
Listing remarks MLS
Auction! Sun. , Nov. 6, 1 PM. Open House: Sun. , 10/30, 1-3 PM. List price reflects assessment. Bidding starts @ $1!
Key facts
- Riverfront treasure
- Large yard
- 2.85 acre lot
Tags
Property features AI
Finance
- Other: Lot approximately 2.85 acres (dimensions 457 x 463)
Exterior
- Parking: No garage
- Utilities: Water connected to public supply; Septic tank for sewer
- Home design: Single-story home; Resale property
- Construction: Block foundation; Block and concrete construction with wood siding
- Exterior features: Blacktop driveway; Road frontage on a main thoroughfare; Irregular lot
Interior
- Kitchen: Appliances listed in remarks
- Bedrooms: One main-level bedroom
- Bathrooms: Two full bathrooms; One main-level bathroom
- Heating & cooling: Heating details available in remarks
- Interior features: Has full basement; See remarks for additional interior details
Neighborhood map
What this means for you Summary
Snapshot
- This is a 2-bed/2.0-bath single-family listed at $45k.
Deal economics
- At list price, monthly cash flow is $-286 ($-3k/yr) — negative.
- The deal already cash-flows at list — no discount required.
- Meets the 1% rule at list price ($1k rent vs $45k).
Location & tenants
- Location reads: area grade D — affects rentability + tenant quality, not the cash-flow math above.
- Cincinnatus Central School District (rural): math 52% / reading 62% proficiency, ranked #287 of 590 in NY (top 49%) — acceptable for families but not a draw, mixed tenant base, ~2y average lease.
- Market conditions: 21 active listings in the ZIP; 45 units permitted in Cortland County in 2024 (12 in 5+ unit buildings).
Forward outlook
- In year one you build about $19k of equity ($1k loan paydown + $18k appreciation (10.0% local appreciation)).
- Cortland County population projected at -15% by 2050 — secular population decline; favor cash flow + early exit over multi-decade hold.
- By year 2, paydown + projected appreciation supports a ~$30k cash-out refi (75% LTV) — recoverable capital for the next deal without selling this one.
Negotiation context
- Only 3 days on market — expect competitive offers; lowballing is unlikely to land.
- 2 sale attempts since 15y ago with the ask held roughly flat each time — persistent listings suggest the price (not the market) is what's stuck; bring a comps-based counter.
- Current owner paid $38k; 17% above their basis — modest negotiation headroom, anchor on the comps not their cost.
Risks & watch-outs
- Watch-outs: property tax is 5.8% of price; built in 1920 — expect roof / HVAC / electrical / plumbing capex.
Questions for the listing agent
- What do current leases actually rent for vs. the listed asking? Can we see a recent rent roll and the last 12 months of T-12 income?
- Built in 1920 — when were the roof, HVAC, electrical panel, plumbing, and water heater last replaced?
- Property tax is high relative to price — has the assessment been appealed recently, and will the sale trigger a re-assessment?
- Is there a deadline driving the sale (1031 exchange, divorce, estate, relocation)? That informs how much negotiation room exists.
- The area grade is low — what's the realistic commute time and amenity access for the typical tenant pool here? Any planned neighborhood developments (good or bad) we should know about?
- What's the average days-on-market for RENTAL listings here right now (not sales)? A rising rental-DOM trend means longer vacancies and softer asking-rent achievability than the comps imply.
- What's the recent tenant-quality profile in this submarket — average credit score on applications, eviction rate, late-payment / NSF rate, and stable-employment percentage? A property-management company in the area should have these aggregated.
- How much new for-sale + rental construction is in the pipeline within 1–3 miles? Heavy new supply typically softens prices + rents 12–24 months out; constrained supply supports both.
Investment metrics
- 1% rule
- 0.67% ✗
- Cap rate
- 4.33%
- Cash-on-cash
- -7.00%
- DSCR
- 0.69
- GRM
- 12.5
CMA / ARV
- ARV (median comp)
- $175,000
- List price
- $44,900
- Delta
- -74.34%
- Verdict
- UNDERPRICED
- Comps
- 5 within 1.0 mi
Show comp detail 1 sale within ~0.75 mi
| Address | Dist | Beds/Ba | Sqft | Sold | Price | $/sf | Match |
|---|---|---|---|---|---|---|---|
| 5615 Deer Path Ln | 0.22mi | 3/1.0 (+1) | 1,288 (-8%) | 15mo | $194,670 | $151 | 55 |
Match score weights: distance 35% · size 25% · config 20% · recency 20%. Top-matched comps best support the ARV.
Projected returns pro-forma
10.0% appreciation · 3.0% rent growth · sell at horizon
- IRR
- 19.3%
- Equity multiple
- 2.57×
- Total profit
- $77,123
- Equity at exit
- $157,654
- IRR
- 17.8%
- Equity multiple
- 5.93×
- Total profit
- $241,466
- Equity at exit
- $339,987
Cash invested: $49,000 (down + closing). Projections, not guarantees.
Landlord ↔ Tenant lean methodology
- Overall (STATE)
- 15 Strongly Tenant-Friendly
- State New York
- 15 Strongly Tenant-Friendly · D+10
- County
- — inherits STATE
- City
- — inherits STATE
ZIP-level market 13040
- Home prices YoY
- 3.8%
- Active inventory
- 21
- Price-to-rent
- 3.2×
Monthly cashflow live
- Estimated rent
- $1,169 medium interval (Pro) →
- Mortgage (P&I)
- −$918
- Tax est. 1.5%
- −$219 /mo · $2,625/yr
- Insurance
- −$73
- HOA
- −$0
- Vacancy / Maint / Mgmt
- −$246
- Net cashflow
- $-286
Break-even live
UW: 25.0% down · 7.5% · 30yr · 1.5% tax · 5.0% vac · 8.0% maint · 8.0% mgmt
Financing live
Cash to close
- Down payment
- $43,750
- Closing costs
- $5,250
- Reserves months
- —
- Total cash needed
- —
Loan-product check · same deal, 3 products live
Conventional
25% down · 7.5% · 30yr
- Down + closing
- —
- Monthly P&I
- —
- Monthly cashflow
- —
- DSCR
- —
- Eligible?
- —
Personal DTI + credit; lowest rate.
DSCR
20% down · 8.5% · 30yr
- Down + closing
- —
- Monthly P&I
- —
- Monthly cashflow
- —
- DSCR
- —
- Eligible?
- —
No personal income docs; deal must DSCR.
Hard money
10% down · 12.0% · 12mo
- Down + closing
- —
- Monthly P&I
- —
- Monthly cashflow
- —
- DSCR
- —
- Eligible?
- —
Short-term bridge; refi at stabilization.
Listing history 5 events
-
2026-05-16status Pending 558-char remark
-
2026-05-13$44,900 Active 558-char remark
-
2011-12-06soldstatus $38,500 117-char remark
Show marketing remark (117 chars)
Auction! Sun. , Nov. 6, 1 PM. Open House: Sun. , 10/30, 1-3 PM. List price reflects assessment. Bidding starts @ $1!
-
2011-11-23soldstatus $38,500
-
2011-10-06$58,950 117-char remark
Show marketing remark (117 chars)
Auction! Sun. , Nov. 6, 1 PM. Open House: Sun. , 10/30, 1-3 PM. List price reflects assessment. Bidding starts @ $1!
ⓘ Source: listings_history table (triggers on properties + properties_extension) + one-shot
backfill from property_details.listing_events for pre-trigger history.
Climate risk First Street
- Flood 1/10 Low FEMA zone X (unshaded) · 0% chance over 30 yrs
- Wildfire 2/10 Low
- Heat 2/10 Low 7 d/yr ≥93°F today · 17 d/yr by 30 yrs out
- Wind 2/10 Low 100% chance of damaging wind over 30 yrs
- Air quality 2/10 Low 0 unhealthy d/yr today · 1 by 30 yrs out
Nearby sold comps map
Loading sold comps map…
Walkable amenities ~0.75 mi
Loading nearby amenities…
Taxation est. · year 1
- Rental income
- $14,029
- − Mortgage interest
- −$9,803
- − Property taxes
- −$2,625
- − Insurance
- −$875
- − Repairs & maintenance
- −$1,122
- − Management
- −$1,122
- − Depreciation
- −$5,091
- Taxable loss
- −$6,609
- Est. tax savings @ 24.0%
- +$1,586
- After-tax cash flow
- $-1,844/yr
For passive investors: Depreciation is non-cash, so a rental often shows a tax loss while cash-flowing — sheltering income. Rental losses are passive: they offset passive income freely, and up to $25,000/yr can offset ordinary (W-2) income if you actively participate and your MAGI is under $100k (phasing out to $0 by $150k); unused losses carry forward. On sale, claimed depreciation is recaptured at up to 25%, and gains may owe capital-gains tax (a 1031 exchange can defer both). Figures are a year-1 estimate at your 24.0% rate — not tax advice; consult a CPA.
Schools (NCES district)
- District
- Cincinnatus Central School District
- NCES district ID
- 3607560
- Math proficiency
- 52% ▲ 9.00%
- Reading proficiency
- 62% ▲ 21.00%
- Median HH income
- $45,988
- Composite
- 48.17/100
- National rank
- #2173
- State rank
- #287 of 590 in NY
Livability — Cincinnatus
No livability data for this city. (Only ~50 U.S. cities are tracked.)
Census & demographics
- Population (ZIP)
- 2,683
Population outlook (Cortland County) Hauer SSP2
- Today (2025)
- 47,543 people
- By 2030
- 46,107 · -3.0%
- By 2040
- 43,122 · -9.3%
- By 2050
- 40,216 · -15.4%
- By 2075
- 34,717 · -27.0%
- By 2100
- 28,953 · -39.1%
Race, ethnicity, and origin ACS 2023
- Neighborhood character
- Predominantly White (95%)
- Race & ethnicity
- White 95% Two or more races 3% Hispanic / Latino 2%
- Common ancestry
- Iranian 4% Romanian 2% Polish 2%
- Foreign-born
- 1%
- Languages at home
- 97% English-only · German/W. Germanic 1% Spanish 1% Other Indo-European 1%
Political lean MEDSL · Cortland
- 2024 margin
- Lean R (+6.4) · D 46.8% · R 53.2%
- 2008→2024 swing
- -16.4pp toward R · 2008: 10.0pp · 2024: -6.4pp
- All cycles
- 2024: R+6.4 2020: R+1.9 2016: R+6.7 2012: D+8.8 2008: D+10.0
Not yet ingested
- Civics
- —
Market trends
- HPI YoY
- ▲ 11.68%
- Current HPI
- 316.2434
- Rent YoY
- —
- Metro
- —
- State GDP YoY
- ▲ 2.60%
- F500 in state
- 92
Industry mix (Fortune 500 HQ in NY)
| Industry | F500 HQs | Revenue |
|---|---|---|
| Financial Services | 10 | $950B |
|
||
| Consumer Goods | 9 | $162B |
|
||
| Insurance | 4 | $225B |
|
||
| Telecommunications | 2 | $144B |
|
||
| Pharmaceuticals | 2 | $112B |
|
||
| Media / Entertainment | 2 | $69B |
|
||
Price history
-23.8% since first listed5 events — show timeline
- 2026-05-16 Pending — CNYIS
- 2026-05-13 Listed $44,900 CNYIS
- 2011-12-06 Sold (MLS) $38,500 CNYIS
- 2011-11-23 Sold (Public Records) $38,500 Public Records
- 2011-10-06 Listed $58,950 CNYIS
Property tax history
-3.3%/yrLatest (2025): $2,297 · +8.4% YoY. Source: county tax records.
Cash-flow waterfall
monthlySold comps — $/sqft
last 12 mo · ≤1 miLoading sold comps…