 160-Plex
7350 N Hanley Rd · Hazelwood, MO
Flood risk No data
- FEMA flood zone
- —
- Chance of flooding over 30 yrs
- —
- Est. flood insurance / yr
- —
Fire risk No data
- Est. fire insurance / yr
- —
Heat risk No data
- Hot days now (above threshold)
- —
- Hot days in 30 yrs
- —
Wind risk No data
- Chance of severe wind over 30 yrs
- —
Air-quality risk No data
- Unhealthy air days now
- —
- Unhealthy air days in 30 yrs
- —
Risk factors via First Street. Map © Google.
Why this score? — see what drove the A- grade
The composite is a weighted blend of 9 inputs, each scored 0–100. Each bar is that input's sub-score; the figure is the points it added to the 100-point composite (weight × sub-score).
- Cash flow +30.0/30.0
- 1% rule +10.0/10.0
- DSCR +10.0/10.0
- Appreciation +10.0/10.0
- ARV discount +7.5/15.0
- Rent growth +4.4/5.0
- Condition / age +4.0/5.0
- Livability +3.1/5.0
- Schools +1.7/10.0
$5,000,000
🖨 Deal sheet 📄 Offer letter ✓ Due diligence
Multi-family units
County records classify this as Multi-Family (5+ Unit). Listing-text estimate: 160 units. confirmed
5+ unit building — per-unit beds/baths from public records are typically unavailable; the breakdown below (if shown) is an estimate from the listing text.
Listing remarks MLS
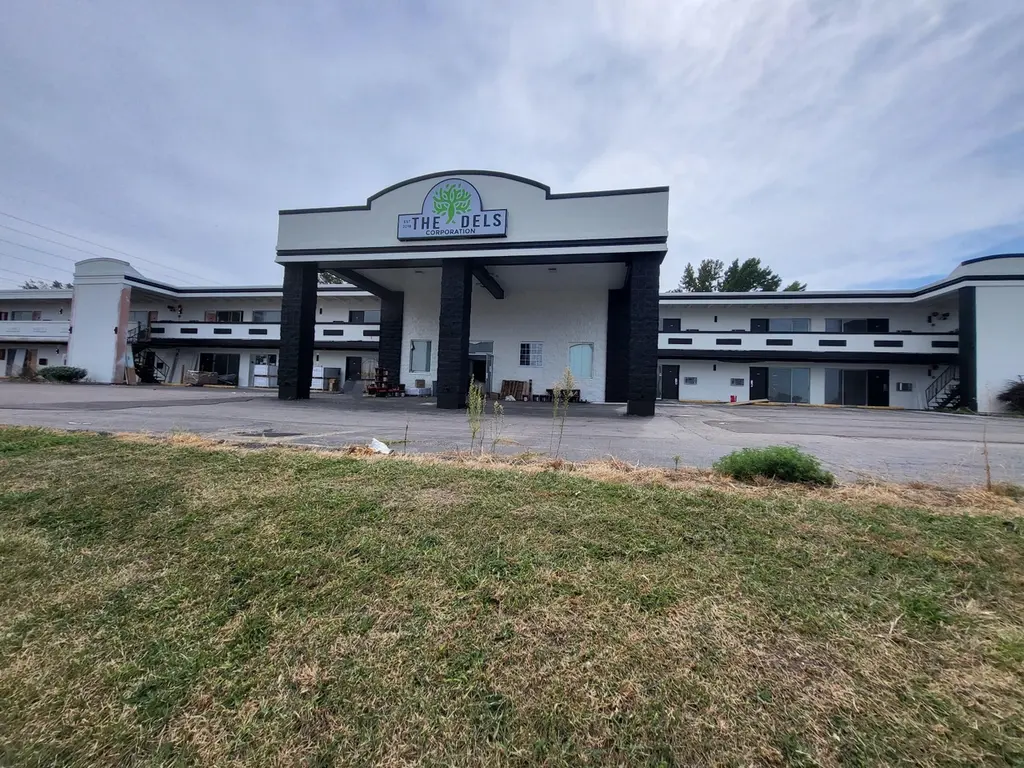
This a rare investment opportunity near the St. Louis airport with unmatched visibility. This 160-unit motel is positioned for continued hospitality use or a conversion into modern studio apartments, with the City of Hazelwood supportive of either direction. Ownership has already invested over $3.5 million in improvements including a new roof, upgraded electrical, updated plumbing, and substantial interior and exterior remodeling now underway. While the project requires completion, the major work is done, creating a turnkey path for its next owner. Located near Boeing's new large-scale facility, the property benefits from strong demand for extended stay lodging and workforce housing, making it an exceptional opportunity for investors and developers.
Key facts
- 160 unit motel
- Upgraded electrical
- New roof
Tags
Neighborhood map
What this means for you Summary
Snapshot
- This is a 160 × 1-bed/1-bath units multifamily listed at $5.00M. Condition is rated good.
Deal economics
- At list price, monthly cash flow is $117k ($1.40M/yr) — positive. Per door: $731/mo.
- The deal already cash-flows at list — no discount required.
- Meets the 1% rule at list price ($192k rent vs $5.00M).
- Recommended offer: $4.40M (12.0% below list) — sets the bar for market timing.
- Cap rate 34.4% vs local median 7.2% in Hazelwood — top-decile yield for the area; either an underpriced asset or a hidden risk that comps aren't pricing in. Stress-test before assuming the spread holds.
Location & tenants
- Location reads 62/100 on livability (#395 in MO) — a middle-class / working-renter tenant base. Strengths: cost of living A+, housing A+; Watch: schools D-, crime F, amenities F.
- Hazelwood (suburban): math 11% / reading 26% proficiency, ranked #306 of 324 in MO (top 94%) — low school quality limits family demand, transient renter base, plan for 1-2y turnover.
- Market conditions: Rents rising fast (+7.5%/yr); 218 active listings in the ZIP; 40 comparable units currently listed for rent nearby; rentals at typical pace (median 24d on market — plan ~3-4 weeks tenant-placement turnaround); 920 units permitted in St. Louis County in 2024 (250 in 5+ unit buildings).
- At $191,882/mo this rent would consume 3448% of the median local household income ($67k/yr) (locally 1429% of renters already pay >50% of income on rent) — very limited rent-growth headroom before tenants either downsize or default.
Forward outlook
- In year one you build about $535k of equity ($35k loan paydown + $500k appreciation (10.0% local appreciation)).
- At projected returns (10.0% appreciation + 7.5% rent growth), your $1.40M cash investment doubles in ~1 year — after that, you're playing with house money.
- By year 2, paydown + projected appreciation supports a ~$859k cash-out refi (75% LTV) — recoverable capital for the next deal without selling this one.
Negotiation context
- It's been on market 267 days — a 12% lower offer ($4.40M) is reasonable based on typical stale-listing flexibility.
Questions for the listing agent
- It's been on market 267 days. Have you received any prior offers? Is the seller open to a 12% concession, seller financing, or rate buy-down credit?
- Can we see the unit-by-unit rent roll, current vacancy, and any below-market leases? What's the average tenancy length?
- What capital expenditures (roof, boiler, parking lot, exteriors) have been made in the last 5 years, and what's planned in the next 2?
- Built in 1970 — when were the roof, HVAC, electrical panel, plumbing, and water heater last replaced?
- Why hasn't it sold? Are there any deal-killer items the seller is aware of (foundation, flood, title, zoning, code violations)?
- Is there a deadline driving the sale (1031 exchange, divorce, estate, relocation)? That informs how much negotiation room exists.
- Schools are D-rated, which usually means shorter tenancies and higher turnover. Who's the typical renter profile here, and what's been the actual vacancy rate?
- Crime grade is F in this area — have there been break-ins, vandalism, or insurance claims at this property in the last 3 years? What carrier currently insures it and at what premium?
- What's the average days-on-market for RENTAL listings here right now (not sales)? A rising rental-DOM trend means longer vacancies and softer asking-rent achievability than the comps imply.
- What's the recent tenant-quality profile in this submarket — average credit score on applications, eviction rate, late-payment / NSF rate, and stable-employment percentage? A property-management company in the area should have these aggregated.
- How much new apartment / multifamily construction is in the pipeline within 1–3 miles? Heavy new supply (>2% of stock underway) typically softens rents 12–24 months out; light construction supports rent growth.
Investment metrics
- 1% rule
- 3.84% ✓
- Cap rate
- 34.38%
- Cash-on-cash
- 100.31%
- DSCR
- 5.46
- GRM
- 2.2
CMA / ARV
- ARV (median comp)
- $396,761
- List price
- $5,000,000
- Delta
- 1160.20%
- Verdict
- OVERPRICED
- Comps
- 2 within 1.0 mi
Show comp detail 1 sale within ~0.75 mi
| Address | Dist | Beds/Ba | Sqft | Sold | Price | $/sf | Match |
|---|---|---|---|---|---|---|---|
| 7411 Sieloff Dr Unit H | 0.46mi | 15/7.0 | 5,722 | 9mo | $420,000 | $73 | 58 |
Match score weights: distance 35% · size 25% · config 20% · recency 20%. Top-matched comps best support the ARV.
Projected returns pro-forma
10.0% appreciation · 7.51% rent growth · sell at horizon
- IRR
- —
- Equity multiple
- 8.92×
- Total profit
- $11,090,189
- Equity at exit
- $4,504,396
- IRR
- —
- Equity multiple
- 21.73×
- Total profit
- $29,015,303
- Equity at exit
- $9,713,900
Cash invested: $1,400,000 (down + closing). Projections, not guarantees.
Landlord ↔ Tenant lean methodology
- Overall (STATE)
- 81 Strongly Landlord-Friendly
- State Missouri
- 81 Strongly Landlord-Friendly · R+10
- County
- — inherits STATE
- City
- — inherits STATE
ZIP-level market 63033
- Home prices YoY
- 2.5%
- Rents YoY
- 7.5%
- Active inventory
- 218
- Price-to-rent
- 347.4×
Monthly cashflow live
- Estimated rent
- $191,882 high interval (Pro) →
- Mortgage (P&I)
- −$26,221
- Tax est. 1.5%
- −$6,250 /mo · $75,000/yr
- Insurance
- −$2,083
- HOA
- −$0
- Vacancy / Maint / Mgmt
- −$40,295
- Net cashflow
- $117,033
Break-even live
160-unit breakdown (identical units grouped — click to expand)
| Units | Beds | Baths | Est. rent |
|---|---|---|---|
| 160× units | 1 | 1 | $191,840 |
| #1 | 1 | 1 | $1,199 |
| #2 | 1 | 1 | $1,199 |
| #3 | 1 | 1 | $1,199 |
| #4 | 1 | 1 | $1,199 |
| #5 | 1 | 1 | $1,199 |
| #6 | 1 | 1 | $1,199 |
| #7 | 1 | 1 | $1,199 |
| #8 | 1 | 1 | $1,199 |
| #9 | 1 | 1 | $1,199 |
| #10 | 1 | 1 | $1,199 |
| #11 | 1 | 1 | $1,199 |
| #12 | 1 | 1 | $1,199 |
| #13 | 1 | 1 | $1,199 |
| #14 | 1 | 1 | $1,199 |
| #15 | 1 | 1 | $1,199 |
| #16 | 1 | 1 | $1,199 |
| #17 | 1 | 1 | $1,199 |
| #18 | 1 | 1 | $1,199 |
| #19 | 1 | 1 | $1,199 |
| #20 | 1 | 1 | $1,199 |
| #21 | 1 | 1 | $1,199 |
| #22 | 1 | 1 | $1,199 |
| #23 | 1 | 1 | $1,199 |
| #24 | 1 | 1 | $1,199 |
| #25 | 1 | 1 | $1,199 |
| #26 | 1 | 1 | $1,199 |
| #27 | 1 | 1 | $1,199 |
| #28 | 1 | 1 | $1,199 |
| #29 | 1 | 1 | $1,199 |
| #30 | 1 | 1 | $1,199 |
| #31 | 1 | 1 | $1,199 |
| #32 | 1 | 1 | $1,199 |
| #33 | 1 | 1 | $1,199 |
| #34 | 1 | 1 | $1,199 |
| #35 | 1 | 1 | $1,199 |
| #36 | 1 | 1 | $1,199 |
| #37 | 1 | 1 | $1,199 |
| #38 | 1 | 1 | $1,199 |
| #39 | 1 | 1 | $1,199 |
| #40 | 1 | 1 | $1,199 |
| #41 | 1 | 1 | $1,199 |
| #42 | 1 | 1 | $1,199 |
| #43 | 1 | 1 | $1,199 |
| #44 | 1 | 1 | $1,199 |
| #45 | 1 | 1 | $1,199 |
| #46 | 1 | 1 | $1,199 |
| #47 | 1 | 1 | $1,199 |
| #48 | 1 | 1 | $1,199 |
| #49 | 1 | 1 | $1,199 |
| #50 | 1 | 1 | $1,199 |
| #51 | 1 | 1 | $1,199 |
| #52 | 1 | 1 | $1,199 |
| #53 | 1 | 1 | $1,199 |
| #54 | 1 | 1 | $1,199 |
| #55 | 1 | 1 | $1,199 |
| #56 | 1 | 1 | $1,199 |
| #57 | 1 | 1 | $1,199 |
| #58 | 1 | 1 | $1,199 |
| #59 | 1 | 1 | $1,199 |
| #60 | 1 | 1 | $1,199 |
| #61 | 1 | 1 | $1,199 |
| #62 | 1 | 1 | $1,199 |
| #63 | 1 | 1 | $1,199 |
| #64 | 1 | 1 | $1,199 |
| #65 | 1 | 1 | $1,199 |
| #66 | 1 | 1 | $1,199 |
| #67 | 1 | 1 | $1,199 |
| #68 | 1 | 1 | $1,199 |
| #69 | 1 | 1 | $1,199 |
| #70 | 1 | 1 | $1,199 |
| #71 | 1 | 1 | $1,199 |
| #72 | 1 | 1 | $1,199 |
| #73 | 1 | 1 | $1,199 |
| #74 | 1 | 1 | $1,199 |
| #75 | 1 | 1 | $1,199 |
| #76 | 1 | 1 | $1,199 |
| #77 | 1 | 1 | $1,199 |
| #78 | 1 | 1 | $1,199 |
| #79 | 1 | 1 | $1,199 |
| #80 | 1 | 1 | $1,199 |
| #81 | 1 | 1 | $1,199 |
| #82 | 1 | 1 | $1,199 |
| #83 | 1 | 1 | $1,199 |
| #84 | 1 | 1 | $1,199 |
| #85 | 1 | 1 | $1,199 |
| #86 | 1 | 1 | $1,199 |
| #87 | 1 | 1 | $1,199 |
| #88 | 1 | 1 | $1,199 |
| #89 | 1 | 1 | $1,199 |
| #90 | 1 | 1 | $1,199 |
| #91 | 1 | 1 | $1,199 |
| #92 | 1 | 1 | $1,199 |
| #93 | 1 | 1 | $1,199 |
| #94 | 1 | 1 | $1,199 |
| #95 | 1 | 1 | $1,199 |
| #96 | 1 | 1 | $1,199 |
| #97 | 1 | 1 | $1,199 |
| #98 | 1 | 1 | $1,199 |
| #99 | 1 | 1 | $1,199 |
| #100 | 1 | 1 | $1,199 |
| #101 | 1 | 1 | $1,199 |
| #102 | 1 | 1 | $1,199 |
| #103 | 1 | 1 | $1,199 |
| #104 | 1 | 1 | $1,199 |
| #105 | 1 | 1 | $1,199 |
| #106 | 1 | 1 | $1,199 |
| #107 | 1 | 1 | $1,199 |
| #108 | 1 | 1 | $1,199 |
| #109 | 1 | 1 | $1,199 |
| #110 | 1 | 1 | $1,199 |
| #111 | 1 | 1 | $1,199 |
| #112 | 1 | 1 | $1,199 |
| #113 | 1 | 1 | $1,199 |
| #114 | 1 | 1 | $1,199 |
| #115 | 1 | 1 | $1,199 |
| #116 | 1 | 1 | $1,199 |
| #117 | 1 | 1 | $1,199 |
| #118 | 1 | 1 | $1,199 |
| #119 | 1 | 1 | $1,199 |
| #120 | 1 | 1 | $1,199 |
| #121 | 1 | 1 | $1,199 |
| #122 | 1 | 1 | $1,199 |
| #123 | 1 | 1 | $1,199 |
| #124 | 1 | 1 | $1,199 |
| #125 | 1 | 1 | $1,199 |
| #126 | 1 | 1 | $1,199 |
| #127 | 1 | 1 | $1,199 |
| #128 | 1 | 1 | $1,199 |
| #129 | 1 | 1 | $1,199 |
| #130 | 1 | 1 | $1,199 |
| #131 | 1 | 1 | $1,199 |
| #132 | 1 | 1 | $1,199 |
| #133 | 1 | 1 | $1,199 |
| #134 | 1 | 1 | $1,199 |
| #135 | 1 | 1 | $1,199 |
| #136 | 1 | 1 | $1,199 |
| #137 | 1 | 1 | $1,199 |
| #138 | 1 | 1 | $1,199 |
| #139 | 1 | 1 | $1,199 |
| #140 | 1 | 1 | $1,199 |
| #141 | 1 | 1 | $1,199 |
| #142 | 1 | 1 | $1,199 |
| #143 | 1 | 1 | $1,199 |
| #144 | 1 | 1 | $1,199 |
| #145 | 1 | 1 | $1,199 |
| #146 | 1 | 1 | $1,199 |
| #147 | 1 | 1 | $1,199 |
| #148 | 1 | 1 | $1,199 |
| #149 | 1 | 1 | $1,199 |
| #150 | 1 | 1 | $1,199 |
| #151 | 1 | 1 | $1,199 |
| #152 | 1 | 1 | $1,199 |
| #153 | 1 | 1 | $1,199 |
| #154 | 1 | 1 | $1,199 |
| #155 | 1 | 1 | $1,199 |
| #156 | 1 | 1 | $1,199 |
| #157 | 1 | 1 | $1,199 |
| #158 | 1 | 1 | $1,199 |
| #159 | 1 | 1 | $1,199 |
| #160 | 1 | 1 | $1,199 |
| Total (160 units) | $191,882 | ||
UW: 25.0% down · 7.5% · 30yr · 1.5% tax · 5.0% vac · 8.0% maint · 8.0% mgmt
Financing live
Cash to close
- Down payment
- $1,250,000
- Closing costs
- $150,000
- Reserves months
- —
- Total cash needed
- —
Loan-product check · same deal, 3 products live
Conventional
25% down · 7.5% · 30yr
- Down + closing
- —
- Monthly P&I
- —
- Monthly cashflow
- —
- DSCR
- —
- Eligible?
- —
Personal DTI + credit; lowest rate.
DSCR
20% down · 8.5% · 30yr
- Down + closing
- —
- Monthly P&I
- —
- Monthly cashflow
- —
- DSCR
- —
- Eligible?
- —
No personal income docs; deal must DSCR.
Hard money
10% down · 12.0% · 12mo
- Down + closing
- —
- Monthly P&I
- —
- Monthly cashflow
- —
- DSCR
- —
- Eligible?
- —
Short-term bridge; refi at stabilization.
Rent comps 40 comps
| Address | Beds | Baths | Sqft | Rent | $/sqft | DOM | Units | Dist |
|---|---|---|---|---|---|---|---|---|
| 8507 Tally Ho Dr Hazelwood, MO | 2.0 | 1.5 | 1478 | $1,300 | $0.88 | 44d | 5 | 0.11mi |
| 135 Saint Maurice Ln Florissant, MO | 3.0 | 1.0 | 816 | $1,395 | $1.71 | 44d | 1 | 0.38mi |
| 7244 Hazelcrest Dr Hazelwood, MO | 3.0 | 2.0 | — | $1,500 | — | 18d | 1 | 0.42mi |
| 7459 Hazelcrest Dr Hazelwood, MO | 3.0 | 2.0 | — | $1,400 | — | 44d | 1 | 0.49mi |
| 7489 Hazelcrest Dr Hazelwood, MO | 3.0 | 1.5 | — | $1,400 | — | 44d | 1 | 0.54mi |
| 220 Du Bourg Ln Florissant, MO | 2.0 | 1.0 | 816 | $1,150 | $1.41 | 44d | 1 | 0.56mi |
| 7437 Hazelcrest Dr Unit H Hazelwood, MO | 3.0 | 1.0 | 1000 | $1,000 | $1.00 | 8d | 1 | 0.57mi |
| 7025 Richwood Ln Hazelwood, MO | 3.0 | 1.0 | 936 | $1,375 | $1.47 | 18d | 1 | 0.58mi |
| 17 Valley Dr Florissant, MO | 2.0 | 2.0 | 1356 | $1,525 | $1.12 | 44d | 1 | 0.60mi |
| 7326 Hazelcrest Dr Hazelwood, MO | 3.0 | 2.0 | — | $1,500 | — | 18d | 1 | 0.61mi |
| 241 Flora Dr Saint Louis, MO | 2.0 | 1.0 | 703 | $1,075 | $1.53 | 24d | 1 | 0.66mi |
| 221 Barto Dr Saint Louis, MO | 3.0 | 2.0 | 958 | $1,295 | $1.35 | 20d | 1 | 0.68mi |
| 5 Santa Cruz Dr Florissant, MO | 2.0 | 1.0 | 1410 | $1,411 | $1.00 | 16d | 1 | 0.68mi |
| 263 Sadonia Ave Saint Louis, MO | 3.0 | 2.0 | 888 | $1,350 | $1.52 | 44d | 1 | 0.71mi |
| 260 Sadonia Ave Saint Louis, MO | 3.0 | 2.0 | 1088 | $1,623 | $1.49 | 20d | 1 | 0.73mi |
| 201 Becker Dr Saint Louis, MO | 3.0 | 1.0 | — | $1,350 | — | 3d | 1 | 0.75mi |
| 204 Flora Dr Saint Louis, MO | 1.0 | 1.0 | 760 | $850 | $1.12 | 8d | 1 | 0.76mi |
| 1180 S New Florissant Rd Florissant, MO | 3.0 | 1.0 | 925 | $1,225 | $1.32 | 24d | 1 | 0.79mi |
| 1250 S New Florissant Rd Florissant, MO | 2.0 | 1.0 | 1150 | $1,500 | $1.30 | 15d | 1 | 0.81mi |
| 8412 Chalons Ct Saint Louis, MO | 3.0 | 1.0 | 1380 | $1,370 | $0.99 | 24d | 1 | 0.81mi |
| 8330 Woodhurst Dr Saint Louis, MO | 3.0 | 1.0 | 1120 | $1,000 | $0.89 | 8d | 1 | 0.88mi |
| 6698 Amora Ave Berkeley, MO | 2.0–3.0 | 1.5 | 1625 | $1,250 | $0.77 | 44d | 1 | 0.93mi |
| 1465 W Duchesne Dr Florissant, MO | 3.0 | 1.0 | 896 | $1,500 | $1.67 | 44d | 1 | 0.93mi |
| 16 Mary Rose Ct Hazelwood, MO | 3.0 | 2.0 | 1506 | $1,706 | $1.13 | 15d | 1 | 0.94mi |
| 240 Chez Vant Ct Hazelwood, MO | 2.0 | 1.5 | 1440 | $1,350 | $0.94 | 44d | 1 | 0.94mi |
| 240 Chez Vant Ct Hazelwood, MO | 1.0 | 1.0 | 770 | $825 | $1.07 | 20d | 1 | 0.94mi |
| 36 Connolly Dr Saint Louis, MO | 3.0 | 1.0 | 1024 | $1,149 | $1.12 | 24d | 1 | 0.95mi |
| 32 Connolly Dr Saint Louis, MO | 3.0 | 1.0 | — | $775 | — | 20d | 1 | 0.95mi |
| 24 Barto Dr Saint Louis, MO | 3.0 | 1.0 | 864 | $1,400 | $1.62 | 44d | 1 | 0.96mi |
| 6811 Brower Ct Saint Louis, MO | 3.0 | 1.0 | — | $1,400 | — | 44d | 1 | 0.96mi |
| 171 Elbring Dr Saint Louis, MO | 3.0 | 1.5 | 1008 | $1,395 | $1.38 | 12d | 1 | 0.98mi |
| 305 S Lafayette St Florissant, MO | 3.0 | 1.0 | 864 | $1,409 | $1.63 | 16d | 1 | 0.98mi |
| 107 Anistasia Dr Saint Louis, MO | 2.0 | 2.0 | 1030 | $1,400 | $1.36 | 24d | 1 | 0.99mi |
| 8418 Bayberry Dr Saint Louis, MO | 3.0 | 2.0 | 1288 | $1,350 | $1.05 | 22d | 1 | 1.02mi |
| 153 Bascom Dr Saint Louis, MO | 3.0 | 1.0 | 1076 | $1,195 | $1.11 | 20d | 1 | 1.04mi |
| 11 Anistasia Dr Saint Louis, MO | 3.0 | 1.5 | 1120 | $1,345 | $1.20 | 24d | 1 | 1.05mi |
| 8437 January Ave Saint Louis, MO | 3.0 | 2.0 | 1288 | $1,350 | $1.05 | 44d | 1 | 1.07mi |
| 46 Bascom Dr Saint Louis, MO | 2.0 | 1.0 | 932 | $1,175 | $1.26 | 44d | 1 | 1.11mi |
| 23 Quick Dr Apt 2 Florissant, MO | 2.0 | 1.0 | 850 | $1,100 | $1.29 | 44d | 1 | 1.12mi |
| 35 Alpha Dr Unit 1472885P Florissant, MO | 3.0 | 2.0 | — | $5,413 | — | 3d | 1 | 1.12mi |
Listing history 16 events
-
2026-06-18days on market $5,000,000 Active 267 DOM
-
2026-06-17days on market $5,000,000 Active 266 DOM
-
2026-06-16days on market $5,000,000 Active 265 DOM
-
2026-06-15days on market $5,000,000 Active 264 DOM
-
2026-06-13days on market $5,000,000 Active 262 DOM
-
2026-06-13days on market $5,000,000 Active 261 DOM
-
2026-06-09days on market $5,000,000 Active 258 DOM
-
2026-06-08days on market $5,000,000 Active 257 DOM
-
2026-06-07days on market $5,000,000 Active 256 DOM
-
2026-06-05days on market $5,000,000 Active 253 DOM
-
2026-06-03days on market $5,000,000 Active 252 DOM
-
2026-06-02days on market $5,000,000 Active 251 DOM
-
2026-06-01days on market $5,000,000 Active 250 DOM
-
2026-05-31days on market $5,000,000 Active 249 DOM
-
2025-12-18price $5,000,000 759-char remark
Show marketing remark (759 chars)
This a rare investment opportunity near the St. Louis airport with unmatched visibility. This 160-unit motel is positioned for continued hospitality use or a conversion into modern studio apartments, with the City of Hazelwood supportive of either direction. Ownership has already invested over $3.5 million in improvements including a new roof, upgraded electrical, updated plumbing, and substantial interior and exterior remodeling now underway. While the project requires completion, the major work is done, creating a turnkey path for its next owner. Located near Boeing's new large-scale facility, the property benefits from strong demand for extended stay lodging and workforce housing, making it an exceptional opportunity for investors and developers.
-
2025-09-22$5,750,000 Active 759-char remark
Show marketing remark (759 chars)
This a rare investment opportunity near the St. Louis airport with unmatched visibility. This 160-unit motel is positioned for continued hospitality use or a conversion into modern studio apartments, with the City of Hazelwood supportive of either direction. Ownership has already invested over $3.5 million in improvements including a new roof, upgraded electrical, updated plumbing, and substantial interior and exterior remodeling now underway. While the project requires completion, the major work is done, creating a turnkey path for its next owner. Located near Boeing's new large-scale facility, the property benefits from strong demand for extended stay lodging and workforce housing, making it an exceptional opportunity for investors and developers.
ⓘ Source: listings_history table (triggers on properties + properties_extension) + one-shot
backfill from property_details.listing_events for pre-trigger history.
Nearby sold comps map
Loading sold comps map…
Walkable amenities ~0.75 mi
Loading nearby amenities…
Taxation est. · year 1
- Rental income
- $2,302,584
- − Mortgage interest
- −$280,078
- − Property taxes
- −$75,000
- − Insurance
- −$25,000
- − Repairs & maintenance
- −$184,207
- − Management
- −$184,207
- − Depreciation
- −$145,455
- Taxable income
- $1,408,638
- Est. tax owed @ 24.0%
- −$338,073
- After-tax cash flow
- $1,066,322/yr
For passive investors: Depreciation is non-cash, so a rental often shows a tax loss while cash-flowing — sheltering income. Rental losses are passive: they offset passive income freely, and up to $25,000/yr can offset ordinary (W-2) income if you actively participate and your MAGI is under $100k (phasing out to $0 by $150k); unused losses carry forward. On sale, claimed depreciation is recaptured at up to 25%, and gains may owe capital-gains tax (a 1031 exchange can defer both). Figures are a year-1 estimate at your 24.0% rate — not tax advice; consult a CPA.
Condition & rehab AI · 12 photos
This 160-unit motel is undergoing moderate renovations, with new roof, flooring, and paint. The property is in good condition and ready for a new owner to complete the renovations and prepare for occupancy.
Repairs flagged
- Major kitchen cabinets — cabinets removed, likely for renovation
- Major bathroom fixtures — tub and sink removed, likely for renovation
Value-add opportunities
- Both renovate kitchen and bathroom — major renovations will attract both buyers and renters
- Rental landscaping and curb appeal — improved landscaping will attract tenants
Renovation cost estimate screening
| Repair item | Severity | Est. cost |
|---|---|---|
| kitchen cabinets · cabinets removed, likely for renovation | Major | $15,000–50,000 |
| bathroom fixtures · tub and sink removed, likely for renovation | Major | $15,000–50,000 |
| Total estimated repair cost · 2 items | $30,000–100,000 |
Value-add ROI direction
- Both renovate kitchen and bathroom — major renovations will attract both buyers and renters ↑
- Rental landscaping and curb appeal — improved landscaping will attract tenants ↑
ⓘ Cost ranges are severity-bucket heuristics (US national rule-of-thumb). Get contractor quotes + a written scope before underwriting a rehab budget.
Schools (NCES district)
- District
- Hazelwood
- NCES district ID
- 2913830
- Math proficiency
- 11% ▼ -13.00%
- Reading proficiency
- 26% ▼ -6.00%
- Median HH income
- $51,621
- Composite
- 16.77/100
- National rank
- #9156
- State rank
- #306 of 324 in MO
Livability — Hazelwood
- Score
- 62/100
- State rank
- #395
- US rank
- #16956
Category grades
Schools grade is shown separately in the Schools card above.
Census & demographics
- Census place
- Hazelwood, MO
- County
- Saint Louis County · 888,823 people
- City population
- 69,104
- Metro
- St. Louis, MO-IL
- Population (ZIP)
- 43,056
- Household income
- $66,776
- Rent vs Own
- Severe rent burden
- 1429.0
Population outlook (St. Louis County) Hauer SSP2
- Today (2025)
- 1,025,227 people
- By 2030
- 1,028,023 · +0.3%
- By 2040
- 1,020,940 · -0.4%
- By 2050
- 1,007,280 · -1.8%
- By 2075
- 987,277 · -3.7%
- By 2100
- 921,984 · -10.1%
Race, ethnicity, and origin ACS 2023
- Neighborhood character
- Predominantly Black (71%)
- Race & ethnicity
- Black 71% White 23% Two or more races 4% Hispanic / Latino 1%
- Common ancestry
- Romanian 1% Lithuanian 1% Italian 1%
- Foreign-born
- 3% · Canada, Vietnam
- Languages at home
- 95% English-only · Spanish 1% French/Haitian/Cajun 1%
Political lean MEDSL · St. Louis
- 2024 margin
- Strong D (+23.4) · D 60.8% · R 37.4% · Other 1.7%
- 2008→2024 swing
- +3.5pp toward D · 2008: 19.9pp · 2024: 23.4pp
- All cycles
- 2024: D+23.4 2020: D+24.0 2016: D+16.2 2012: D+13.7 2008: D+19.9
Not yet ingested
- Civics
- —
Market trends
- HPI YoY
- ▲ 13.78%
- Current HPI
- 570.6
- Rent YoY
- ▲ 7.51%
- Metro
- St. Louis, MO-IL
- State GDP YoY
- ▲ 1.84%
- F500 in state
- 20
Industry mix (Fortune 500 HQ in MO)
| Industry | F500 HQs | Revenue |
|---|---|---|
| Healthcare | 1 | $163B |
|
||
| Insurance | 1 | $21B |
|
||
| Industrial Technology | 1 | $17B |
|
||
| Retail | 1 | $16B |
|
||
| Industrial Distribution | 1 | $10B |
|
||
| Utilities | 1 | $9B |
|
||
Price history
-13.0% since first listed2 events — show timeline
- 2025-12-18 Price Changed $5,000,000 SOMO
- 2025-09-22 Listed $5,750,000 SOMO
Cash-flow waterfall
monthlySold comps — $/sqft
last 12 mo · ≤1 miLoading sold comps…