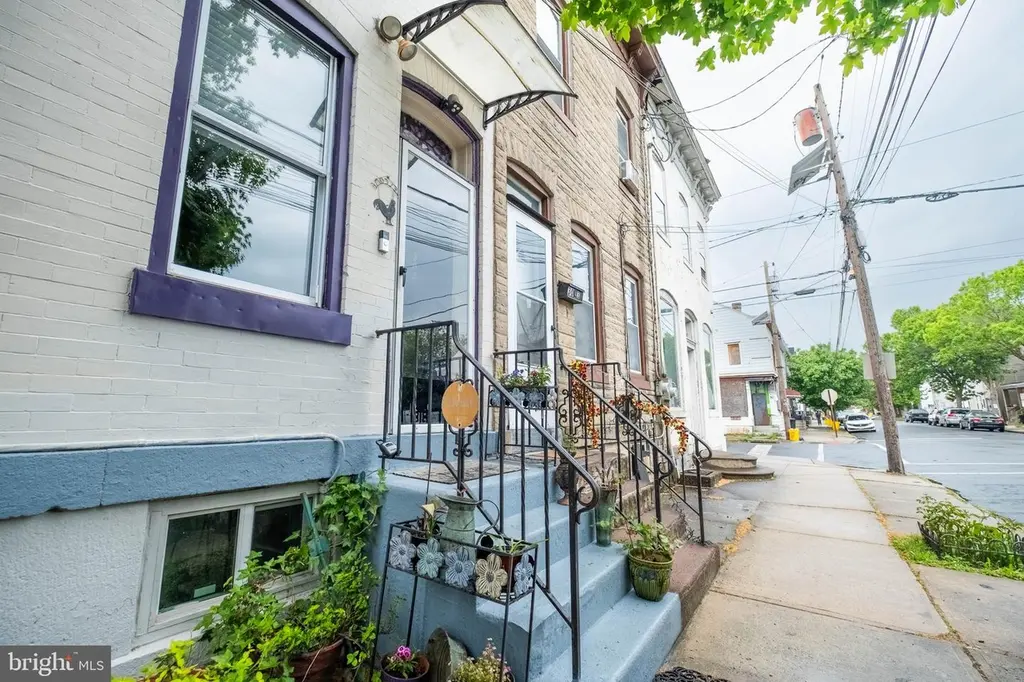
305 Cummings Ave · Trenton, NJ
Flood risk 1/10 · Minimal
- FEMA flood zone
- X (unshaded)
- Chance of flooding over 30 yrs
- 0.0%
- Est. flood insurance / yr
- $507 – $1,088
Fire risk 1/10 · Minimal
- Est. fire insurance / yr
- $526 – $976
Heat risk 6/10 · Moderate
- Hot days now (above 102°F)
- 7 days/yr
- Hot days in 30 yrs
- 15 days/yr
Wind risk 6/10 · Moderate
- Chance of severe wind over 30 yrs
- 27.0%
Air-quality risk 5/10 · Moderate
- Unhealthy air days now
- 6 days/yr
- Unhealthy air days in 30 yrs
- 8 days/yr
Risk factors via First Street. Map © Google.
Why this score? — see what drove the C+ grade
The composite is a weighted blend of 9 inputs, each scored 0–100. Each bar is that input's sub-score; the figure is the points it added to the 100-point composite (weight × sub-score).
- Cash flow +23.8/30.0
- ARV discount +15.0/15.0
- DSCR +7.7/10.0
- 1% rule +6.2/10.0
- Livability +3.8/5.0
- Rent growth +3.7/5.0
- Condition / age +2.5/5.0
- Schools +0.7/10.0
- Appreciation +0.0/10.0
$198,000
🖨 Deal sheet (PDF) 📄 Offer letter ✓ Due diligence
Listing remarks MLS
Recently Painted & Newly Carpeted. Large Spacious Rooms With Laundry On First Floor, Walk-Up Attic, Lr/Dr Combo, Eat-In-Kitchen, Newer Windows
Key facts
- Built 1887
- Listed 9 days
Property features AI
Finance
- Other: Fee simple ownership; Property listed in very good condition; Above-grade finished area recorded at 1,320 sq ft (source: Assessor)
Exterior
- Parking: On-street parking
- Utilities: Public water; Public sewer
- Home design: Interior townhouse/rowhouse
- Construction: Brick construction; Concrete perimeter foundation
- Exterior features: 15 x 100 lot dimensions
Interior
- Bedrooms: Three bedrooms on the first upper level
- Bathrooms: One full bathroom
- Heating & cooling: 90% forced air heating; Oil-fired heating fuel; Natural gas hot water
- Interior features: Level entry to main floor; Full basement
Neighborhood map
What this means for you Summary
Snapshot
- This is a 3-bed/1.0-bath townhouse listed at $198k.
Deal economics
- At list price, monthly cash flow is $380 ($5k/yr) — positive.
- The deal already cash-flows at list — no discount required.
- Meets the 1% rule at list price ($2k rent vs $198k).
- Cap rate 8.6% vs local median 5.8% in Trenton — top-decile yield for the area; either an underpriced asset or a hidden risk that comps aren't pricing in. Stress-test before assuming the spread holds.
Location & tenants
- Location reads 76/100 on livability (#133 in NJ, #3,533 nationally) — a middle-class / working-renter tenant base. Strengths: amenities A+, commute A+, health & safety A+; Watch: crime F, employment F.
- Trenton Public School District (urban): math 2% / reading 16% proficiency, ranked #471 of 472 in NJ (top 100%) — low school quality limits family demand, transient renter base, plan for 1-2y turnover; 80% free/reduced lunch — lower-income household profile, screen leases tightly.
- Zoned schools: Franklin Elementary School (math 3% / reading 14%, grade F, #1,261 of 1,303 statewide, top 97%, 349 students, 57% FRL); Dunn Middle School (math 2% / reading 19%, grade F, #424 of 431 statewide, top 98%, 670 students, 60% FRL); Trenton Central High School - Main Campus (math 2% / reading 10%, grade F, #396 of 399 statewide, top 99%, 2,255 students, 56% FRL) — zoned schools average 58% FRL vs 80% district-wide (23 pts lower); this property's tenant base skews higher-income than the district average.
- Market conditions: Rents rising fast (+4.7%/yr); 84 active listings in the ZIP; 32 comparable units currently listed for rent nearby; rentals at typical pace (median 23d on market — plan ~3-4 weeks tenant-placement turnaround); 2,256 units permitted in Mercer County in 2024 (1,303 in 5+ unit buildings).
- At $2,209/mo this rent would consume 47% of the median local household income ($57k/yr) (locally 2147% of renters already pay >50% of income on rent) — very limited rent-growth headroom before tenants either downsize or default.
Forward outlook
- Local home prices are declining (-3.0%/yr); year-one equity from $1k of loan paydown is wiped out by about $6k of value loss. Plan a longer hold.
- Mercer County population projected at +4% by 2050 — modest demand growth; plan on rents tracking national, not racing it.
- At projected returns (-3.0% appreciation + 4.7% rent growth), your $55k cash investment doubles in ~10 years — after that, you're playing with house money.
Negotiation context
- Only 9 days on market — expect competitive offers; lowballing is unlikely to land.
- 4 sale attempts since 27y ago with the ask held roughly flat each time — persistent listings suggest the price (not the market) is what's stuck; bring a comps-based counter.
- Current owner paid $45k; list at $198k implies a 340% gain — meaningful room to come down on a strong offer.
Risks & watch-outs
- Watch-outs: built in 1887 — expect roof / HVAC / electrical / plumbing capex.
- Climate carrying-cost: major wind risk, 27% chance of damaging wind over 30y; extreme-heat days projected 7→15/yr by 2055 (HVAC capex compounding) — expect insurance premiums to compound above CPI over the hold.
Questions for the listing agent
- Built in 1887 — when were the roof, HVAC, electrical panel, plumbing, and water heater last replaced?
- Is there a deadline driving the sale (1031 exchange, divorce, estate, relocation)? That informs how much negotiation room exists.
- Schools are F-rated, which usually means shorter tenancies and higher turnover. Who's the typical renter profile here, and what's been the actual vacancy rate?
- Crime grade is F in this area — have there been break-ins, vandalism, or insurance claims at this property in the last 3 years? What carrier currently insures it and at what premium?
- What's the average days-on-market for RENTAL listings here right now (not sales)? A rising rental-DOM trend means longer vacancies and softer asking-rent achievability than the comps imply.
- What's the recent tenant-quality profile in this submarket — average credit score on applications, eviction rate, late-payment / NSF rate, and stable-employment percentage? A property-management company in the area should have these aggregated.
- How much new for-sale + rental construction is in the pipeline within 1–3 miles? Heavy new supply typically softens prices + rents 12–24 months out; constrained supply supports both.
Investment metrics
- 1% rule
- 1.12% ✓
- Cap rate
- 8.60%
- Cash-on-cash
- 8.22%
- DSCR
- 1.37
- GRM
- 7.5
CMA / ARV
- ARV (on-the-fly)
- $249,480
- Comps found
- 12
Show comp detail 12 sales within ~0.75 mi
| Address | Dist | Beds/Ba | Sqft | Sold | Price | $/sf | Match |
|---|---|---|---|---|---|---|---|
| 814 Chestnut Ave | 0.21mi | 3/1.5 | 1,292 (-2%) | 0mo | $265,000 | $205 | 85 |
| 527 Emory Ave | 0.16mi | 4/1.0 (+1) | 1,484 (+12%) | 1mo | $230,000 | $155 | 66 |
| 148 Randall Ave | 0.64mi | 4/1.0 (+1) | 1,358 (+3%) | 1mo | $247,500 | $182 | 59 |
| 175 Anderson St | 0.26mi | 4/1.0 (+1) | 1,136 (-14%) | 1mo | $225,000 | $198 | 59 |
| 244 Jersey St | 0.71mi | 3/1.5 | 1,368 (+4%) | 1mo | $200,000 | $146 | 58 |
| 1553 Chambers St | 0.59mi | 3/1.0 | 1,182 (-10%) | 1mo | $225,000 | $190 | 54 |
| 744 Chambers St | 0.40mi | 4/2.0 (+1) | 1,458 (+10%) | 1mo | $269,000 | $184 | 54 |
| 25 Mckinley Ave | 0.70mi | 4/1.5 (+1) | 1,274 (-4%) | 0mo | $300,000 | $235 | 54 |
| 202 Commonwealth Ave | 0.47mi | 4/2.0 (+1) | 1,456 (+10%) | 1mo | $275,000 | $189 | 51 |
| 18 Panfili Ln | 0.65mi | 3/3.0 | 1,410 (+7%) | 1mo | $390,000 | $277 | 50 |
| 212 Commonwealth Ave | 0.46mi | 4/1.5 (+1) | 1,496 (+13%) | 0mo | $245,000 | $164 | 49 |
| 35 Jersey St | 0.61mi | 4/1.0 (+1) | 1,131 (-14%) | 0mo | $210,000 | $186 | 42 |
Match score weights: distance 35% · size 25% · config 20% · recency 20%. Top-matched comps best support the ARV.
Projected returns pro-forma
-3.0% appreciation · 4.71% rent growth · sell at horizon
- IRR
- -1.9%
- Equity multiple
- 0.93×
- Total profit
- $-3,995
- Equity at exit
- $29,522
- IRR
- 9.6%
- Equity multiple
- 1.80×
- Total profit
- $44,225
- Equity at exit
- $17,119
Cash invested: $55,440 (down + closing). Projections, not guarantees.
Landlord ↔ Tenant lean methodology
- Overall (STATE)
- 21 Tenant-Leaning
- State New Jersey
- 21 Tenant-Leaning · D+6
- County
- — inherits STATE
- City
- — inherits STATE
ZIP-level market 08611
- Rents YoY
- 4.7%
- Active inventory
- 84
- Price-to-rent
- 7.5×
Monthly cashflow live
- Estimated rent
- $2,209 high interval (Pro) →
- Mortgage (P&I)
- −$1,038
- Tax from tax record
- −$244 /mo · $2,933/yr
- Insurance
- −$82
- HOA
- −$0
- Vacancy / Maint / Mgmt
- −$464
- Net cashflow
- $380
Break-even live
Sensitivity live
| Price | -10% $492 | -5% $436 | +0% $380 | +5% $324 | +10% $268 |
|---|---|---|---|---|---|
| Rent | -10% $205 | -5% $293 | +0% $380 | +5% $467 | +10% $554 |
| Rate | -1.0pp $480 | -0.5pp $430 | base $380 | +0.5pp $329 | +1.0pp $276 |
UW: 25.0% down · 7.5% · 30yr · 1.5% tax · 5.0% vac · 8.0% maint · 8.0% mgmt
Financing live
Cash to close
- Down payment
- $49,500
- Closing costs
- $5,940
- Reserves months
- —
- Total cash needed
- —
Loan-product check · same deal, 3 products live
Conventional
25% down · 7.5% · 30yr
- Down + closing
- —
- Monthly P&I
- —
- Monthly cashflow
- —
- DSCR
- —
- Eligible?
- —
Personal DTI + credit; lowest rate.
DSCR
20% down · 8.5% · 30yr
- Down + closing
- —
- Monthly P&I
- —
- Monthly cashflow
- —
- DSCR
- —
- Eligible?
- —
No personal income docs; deal must DSCR.
Hard money
10% down · 12.0% · 12mo
- Down + closing
- —
- Monthly P&I
- —
- Monthly cashflow
- —
- DSCR
- —
- Eligible?
- —
Short-term bridge; refi at stabilization.
Rent comps 32 comps
| Address | Beds | Baths | Sqft | Rent | $/sqft | DOM | Units | Dist |
|---|---|---|---|---|---|---|---|---|
| 705 Anderson St Trenton, NJ | 3.0 | 1.0 | 1132 | $1,800 | $1.59 | 15d | 1 | 0.07mi |
| 176 Division St Apt 106 Trenton, NJ | 2.0 | 1.0 | 975 | $1,700 | $1.74 | 22d | 1 | 0.27mi |
| 1103 Division St Trenton, NJ | 4.0 | 1.0 | 1296 | $2,000 | $1.54 | 22d | 1 | 0.28mi |
| 234 Howell St Trenton, NJ | 3.0 | 3.0 | 1656 | $3,600 | $2.17 | 22d | 1 | 0.36mi |
| 1049 Genesee St Trenton, NJ | 3.0 | 1.0 | 1270 | $2,300 | $1.81 | 22d | 1 | 0.46mi |
| 203 Genesee St Unit 2 Trenton, NJ | 2.0 | 1.0 | 1452 | $1,700 | $1.17 | 22d | 1 | 0.49mi |
| 1132 Genesee St Unit 1132 Trenton, NJ | 3.0 | 1.0 | 1198 | $2,500 | $2.09 | 22d | 1 | 0.50mi |
| 635 Chambers St Trenton, NJ | 4.0 | 2.0 | 1312 | $2,500 | $1.91 | 15d | 1 | 0.51mi |
| 121 Columbus Ave Trenton, NJ | 3.0 | 1.0 | 1050 | $1,900 | $1.81 | 22d | 1 | 0.53mi |
| 313 Home Ave Trenton, NJ | 3.0 | 1.0 | 1112 | $2,100 | $1.89 | 15d | 1 | 0.54mi |
| 233 Virginia Ave Trenton, NJ | 3.0 | 1.0 | 1302 | $2,500 | $1.92 | 14d | 1 | 0.57mi |
| 720 Monmouth St Unit 204 Trenton, NJ | 2.0 | 1.0 | 1011 | $1,750 | $1.73 | 22d | 1 | 0.61mi |
| 1078 Lalor St Unit 1 Trenton, NJ | 2.0 | 1.0 | 1488 | $1,895 | $1.27 | 22d | 1 | 0.64mi |
| 1078 Lalor St Unit 2 Trenton, NJ | 2.0 | 1.0 | 1488 | $1,785 | $1.20 | 22d | 1 | 0.64mi |
| 71 Clark St Trenton, NJ | 1.0–2.0 | 1.0–2.0 | 975 | $2,350 | $2.41 | 15d | 4 | 0.70mi |
| 244 Jersey St Trenton, NJ | 3.0 | 1.5 | 1368 | $2,300 | $1.68 | 15d | 1 | 0.71mi |
| 973 S Olden Ave Unit 2ND FLOOR Trenton, NJ | 2.0 | 1.0 | 1664 | $1,850 | $1.11 | 22d | 1 | 0.86mi |
| 239 Ardmore Ave Trenton, NJ | 4.0 | 2.0 | 1665 | $2,750 | $1.65 | 22d | 1 | 0.88mi |
| 105 Walnut Ave Unit 1 Trenton, NJ | 2.0 | 1.0 | 1200 | $2,000 | $1.67 | 22d | 1 | 0.88mi |
| 547 Centre St Trenton, NJ | 3.0 | 1.0 | 1060 | $1,850 | $1.75 | 22d | 1 | 0.92mi |
| 234 Walnut Ave Trenton, NJ | 4.0 | 1.0 | 1480 | $2,200 | $1.49 | 22d | 1 | 0.95mi |
| 417 Walnut Ave Trenton, NJ | 3.0 | 1.0 | 992 | $2,050 | $2.07 | 22d | 1 | 1.03mi |
| 428 Cleveland Ave Trenton, NJ | 4.0 | 2.0 | 1400 | $2,500 | $1.79 | 22d | 1 | 1.06mi |
| 1165 E State St Trenton, NJ | 3.0 | 1.0 | 900 | $1,749 | $1.94 | 15d | 1 | 1.21mi |
| 700 Schiller Ave Trenton, NJ | 3.0 | 1.0 | 1558 | $2,500 | $1.60 | 15d | 1 | 1.23mi |
| 34 Southard St #2 Trenton, NJ | 2.0 | 2.0 | 1808 | $2,150 | $1.19 | 22d | 1 | 1.24mi |
| 42 Grant St Trenton, NJ | 4.0 | 1.0 | 1000 | $2,000 | $2.00 | 15d | 1 | 1.28mi |
| 216 E State St Trenton, NJ | 1.0–2.0 | 1.0 | 811 | $1,895 | $2.34 | 15d | 2 | 1.29mi |
| 219 Woodlawn Ave Trenton, NJ | 3.0 | 1.0 | 1456 | $2,355 | $1.62 | 15d | 1 | 1.30mi |
| 340 Connecticut Ave Unit 1 Hamilton Township, NJ | 2.0 | 1.0 | 1000 | $2,500 | $2.50 | 15d | 1 | 1.36mi |
| 340 Connecticut Ave Unit 2 Hamilton Township, NJ | 3.0 | 1.0 | 1400 | $2,850 | $2.04 | 15d | 1 | 1.36mi |
| 125 Olive St Trenton, NJ | 2.0–3.0 | 1.0–1.5 | 896 | $1,392 | $1.55 | 22d | 1 | 1.41mi |
Listing history 14 events
-
2026-05-21status Pending
-
2026-05-17historical Active Under Contract
-
2026-05-09$198,000 Active
-
2026-05-08historical $198,000
-
2001-11-21soldstatus $45,000
-
2001-11-16soldstatus $45,000 148-char remark
Show marketing remark (148 chars)
Recently Painted & Newly Carpeted. Large Spacious Rooms With Laundry On First Floor, Walk-Up Attic, Lr/Dr Combo, Eat-In-Kitchen, Newer Windows
-
2001-10-01historical 148-char remark
Show marketing remark (148 chars)
Recently Painted & Newly Carpeted. Large Spacious Rooms With Laundry On First Floor, Walk-Up Attic, Lr/Dr Combo, Eat-In-Kitchen, Newer Windows
-
2001-04-23$45,000 148-char remark
Show marketing remark (148 chars)
Recently Painted & Newly Carpeted. Large Spacious Rooms With Laundry On First Floor, Walk-Up Attic, Lr/Dr Combo, Eat-In-Kitchen, Newer Windows
-
2001-02-26soldstatus $19,000 201-char remark
Show marketing remark (201 chars)
Well Maintained, Spacious Row Home. New Electrical System, Newer Range And Hot Water Heater. Ceiling Fans, Juge Loft-Potential Bedroom/Office. Great Home Or Investment Property. Must See! Poss:P. O. T.
-
2001-01-23historical 201-char remark
Show marketing remark (201 chars)
Well Maintained, Spacious Row Home. New Electrical System, Newer Range And Hot Water Heater. Ceiling Fans, Juge Loft-Potential Bedroom/Office. Great Home Or Investment Property. Must See! Poss:P. O. T.
-
2000-10-11$19,000 201-char remark
Show marketing remark (201 chars)
Well Maintained, Spacious Row Home. New Electrical System, Newer Range And Hot Water Heater. Ceiling Fans, Juge Loft-Potential Bedroom/Office. Great Home Or Investment Property. Must See! Poss:P. O. T.
-
2000-09-22historical
-
1999-03-22$46,900
-
1987-02-06soldstatus $40,250
ⓘ Source: listings_history table (triggers on properties + properties_extension) + one-shot
backfill from property_details.listing_events for pre-trigger history.
Tax reassessment forecast NJ · Partial reset (capped growth)
- Current annual tax
- $2,933 · $244/mo
- Projected year-2 tax
- $3,932 · $328/mo
- Expected delta
- +$998/yr (+$83/mo · 34.0%)
ⓘ Screening estimate from a state-policy table — verify with the county assessor before closing.
Climate risk First Street
- Flood 1/10 Low FEMA zone X (unshaded) · 0% chance over 30 yrs
- Wildfire 1/10 Low
- Heat 6/10 Major 7 d/yr ≥102°F today · 15 d/yr by 30 yrs out
- Wind 6/10 Major 27% chance of damaging wind over 30 yrs
- Air quality 5/10 Major 6 unhealthy d/yr today · 8 by 30 yrs out
Nearby sold comps map
Loading sold comps map…
Walkable amenities ~0.75 mi
Loading nearby amenities…
Taxation est. · year 1
- Rental income
- $26,508
- − Mortgage interest
- −$11,091
- − Property taxes
- −$2,933
- − Insurance
- −$990
- − Repairs & maintenance
- −$2,121
- − Management
- −$2,121
- − Depreciation
- −$5,760
- Taxable income
- $1,492
- Est. tax owed @ 24.0%
- −$358
- After-tax cash flow
- $4,200/yr
For passive investors: Depreciation is non-cash, so a rental often shows a tax loss while cash-flowing — sheltering income. Rental losses are passive: they offset passive income freely, and up to $25,000/yr can offset ordinary (W-2) income if you actively participate and your MAGI is under $100k (phasing out to $0 by $150k); unused losses carry forward. On sale, claimed depreciation is recaptured at up to 25%, and gains may owe capital-gains tax (a 1031 exchange can defer both). Figures are a year-1 estimate at your 24.0% rate — not tax advice; consult a CPA.
Schools (NCES district)
- District
- Trenton Public School District
- NCES district ID
- 3416290
- Math proficiency
- 2% ▼ -8.00%
- Reading proficiency
- 16% ▼ -4.00%
- Median HH income
- $35,078
- Composite
- 7.31/100
- National rank
- #9956
- State rank
- #471 of 472 in NJ
Livability — Trenton
- Score
- 76/100
- State rank
- #133
- US rank
- #3533
Category grades
Schools grade is shown separately in the Schools card above.
Census & demographics
- Census place
- Trenton, NJ
- County
- Mercer County · 327,655 people
- City population
- 177,819
- Metro
- Trenton-Princeton, NJ
- Population (ZIP)
- 31,995
- Household income
- $56,788
- Rent vs Own
- Severe rent burden
- 2147.0
Population outlook (Mercer County) Hauer SSP2
- Today (2025)
- 381,395 people
- By 2030
- 384,640 · +0.9%
- By 2040
- 391,431 · +2.6%
- By 2050
- 397,845 · +4.3%
- By 2075
- 417,281 · +9.4%
- By 2100
- 420,327 · +10.2%
Race, ethnicity, and origin ACS 2023
- Neighborhood character
- Diverse neighborhood (Simpson 0.56)
- Race & ethnicity
- Hispanic / Latino 62% Black 20% Two or more races 18% White 14% Native American 4%
- Hispanic origin (detail)
- Mexican 2% Puerto Rican 12% Dominican 8%
- Common ancestry
- Romanian 2% Swiss 1% Hispanic 1%
- Foreign-born
- 37% · Canada, Jamaica, Guatemala
- Languages at home
- 41% English-only · Spanish 57% French/Haitian/Cajun 2%
Political lean MEDSL · Mercer
- 2024 margin
- Solid D (+33.9) · D 65.9% · R 32.0% · Other 2.1%
- 2008→2024 swing
- -2.2pp toward R · 2008: 36.1pp · 2024: 33.9pp
- All cycles
- 2024: D+33.9 2020: D+40.0 2016: D+36.2 2012: D+36.8 2008: D+36.1
Not yet ingested
- Civics
- —
Market trends
- HPI YoY
- ▼ -267.62%
- Current HPI
- 276.5427
- Rent YoY
- ▲ 4.71%
- Metro
- Trenton-Princeton, NJ
- State GDP YoY
- ▲ 2.05%
- F500 in state
- 34
Industry mix (Fortune 500 HQ in NJ)
| Industry | F500 HQs | Revenue |
|---|---|---|
| Consumer Goods | 3 | $31B |
|
||
| Pharmaceuticals | 2 | $153B |
|
||
| Technology | 2 | $21B |
|
||
| Insurance | 2 | $20B |
|
||
| Healthcare | 2 | $19B |
|
||
| Financial Services | 1 | $70B |
|
||
Price history
+391.9% since first listed14 events — show timeline
- 2026-05-21 Pending — BRIGHT MLS
- 2026-05-17 Contingent — BRIGHT MLS
- 2026-05-09 Listed $198,000 BRIGHT MLS
- 2026-05-08 Coming Soon $198,000 BRIGHT MLS
- 2001-11-21 Sold (Public Records) $45,000 Public Records
- 2001-11-16 Sold (MLS) $45,000 BRIGHT MLS
- 2001-10-01 Listing Removed — BRIGHT MLS
- 2001-04-23 Listed $45,000 BRIGHT MLS
- 2001-02-26 Sold (MLS) $19,000 BRIGHT MLS
- 2001-01-23 Listing Removed — BRIGHT MLS
- 2000-10-11 Listed $19,000 BRIGHT MLS
- 2000-09-22 Listing Removed — BRIGHT MLS
- 1999-03-22 Listed $46,900 BRIGHT MLS
- 1987-02-06 Sold (Public Records) $40,250 Public Records
Property tax history
+2.1%/yrLatest (2025): $2,933 · +1.5% YoY. Source: county tax records.
Cash-flow waterfall
monthlySold comps — $/sqft
last 12 mo · ≤1 miLoading sold comps…