101 NE 4th · England, AR
Flood risk 1/10 · Minimal
- FEMA flood zone
- X (unshaded)
- Chance of flooding over 30 yrs
- 0.0%
- Est. flood insurance / yr
- $507 – $1,088
Fire risk 1/10 · Minimal
- Est. fire insurance / yr
- $1,499 – $2,785
Heat risk 7/10 · Major
- Hot days now (above 108°F)
- 7 days/yr
- Hot days in 30 yrs
- 20 days/yr
Wind risk 4/10 · Minor
- Chance of severe wind over 30 yrs
- 14.0%
Air-quality risk 2/10 · Minimal
- Unhealthy air days now
- 1 days/yr
- Unhealthy air days in 30 yrs
- 2 days/yr
Risk factors via First Street. Map © Google.
Why this score? — see what drove the B+ grade
The composite is a weighted blend of 9 inputs, each scored 0–100. Each bar is that input's sub-score; the figure is the points it added to the 100-point composite (weight × sub-score).
- Cash flow +30.0/30.0
- 1% rule +10.0/10.0
- DSCR +10.0/10.0
- Appreciation +10.0/10.0
- ARV discount +7.5/15.0
- Livability +3.4/5.0
- Rent growth +2.5/5.0
- Condition / age +2.5/5.0
- Schools +2.3/10.0
$80,000
🖨 Deal sheet 📄 Offer letter ✓ Due diligence
Listing remarks MLS
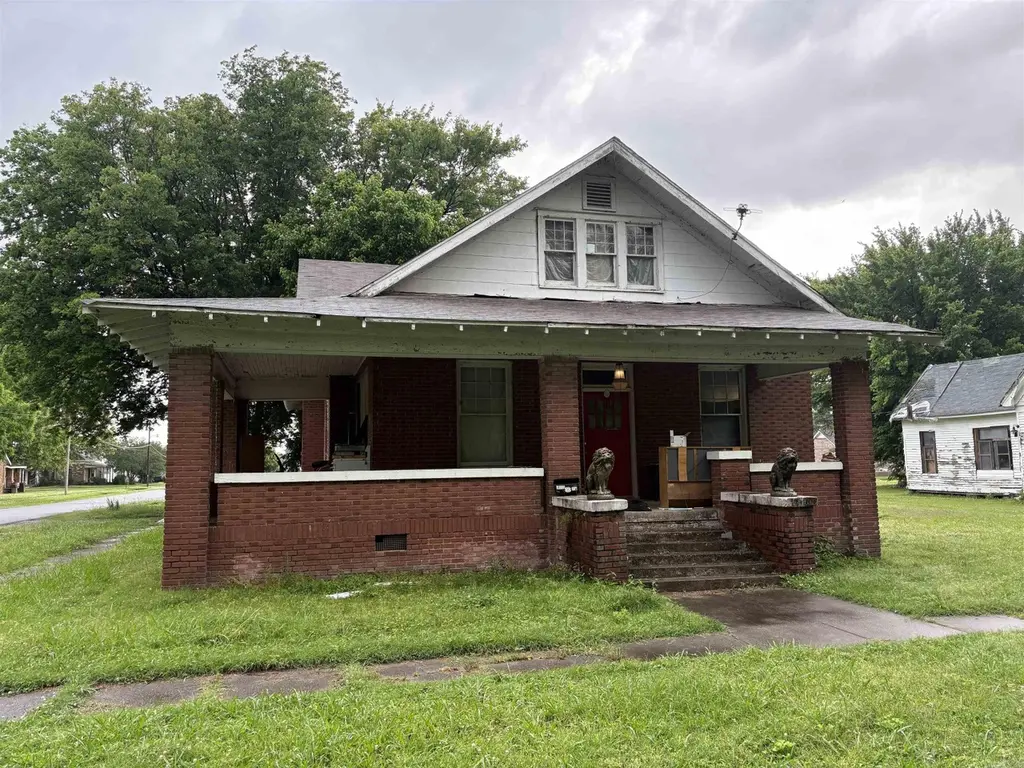
Nestled off NE 4th St and St. John, this spacious five-bedroom, two-bath home offers classic charm with a brick exterior and a welcoming covered front porch. Inside, you'll find hardwood floors throughout most of the home, a generous kitchen with ample cabinet space, and plenty of room for a growing family or hosting guests. Out back, a large, solidly built garage/workshop provides versatile space for storage, hobbies, or outdoor gear. Situated in the heart of a thriving farming community and renowned duck hunting region, this property is ideal for those who love the outdoors. Being sold as is, this home is a perfect canvas for updates and personal touches. With the right improvements, it could serve as a comfortable full-time residence or a fantastic home base for hunters and their families.
Key facts
- Covered front porch
- Generous kitchen
- Brick exterior
Tags
Neighborhood map
What this means for you Summary
Snapshot
- This is a 5-bed/2.0-bath single-family listed at $80k.
Deal economics
- At list price, monthly cash flow is $680 ($8k/yr) — positive.
- The deal already cash-flows at list — no discount required.
- Meets the 1% rule at list price ($1k rent vs $80k).
- Recommended offer: $73k (9.0% below list) — sets the bar for market timing.
Location & tenants
- Location reads 67/100 on livability (#96 in AR) — a middle-class / working-renter tenant base. Strengths: cost of living A+, housing A+, health & safety A+; Watch: schools F, crime D-, amenities F.
- England School District (town): math 27% / reading 28% proficiency, ranked #170 of 238 in AR (top 71%) — low school quality limits family demand, transient renter base, plan for 1-2y turnover; 66% free/reduced lunch — lower-income household profile, screen leases tightly.
- Market conditions: 50 active listings in the ZIP; 1 comparable units currently listed for rent nearby; 185 units permitted in Lonoke County in 2024 (0 in 5+ unit buildings).
Forward outlook
- In year one you build about $9k of equity ($553 loan paydown + $8k appreciation (10.0% local appreciation)).
- Lonoke County population projected at +12% by 2050 — modest demand growth; plan on rents tracking national, not racing it.
- At projected returns (10.0% appreciation + 3.0% rent growth), your $22k cash investment doubles in ~2 years — after that, you're playing with house money.
- By year 4, paydown + projected appreciation supports a ~$30k cash-out refi (75% LTV) — recoverable capital for the next deal without selling this one.
Negotiation context
- It's been on market 116 days — a 9% lower offer ($73k) is reasonable based on typical stale-listing flexibility.
- 3 sale attempts since 12y ago with the ask held roughly flat each time — persistent listings suggest the price (not the market) is what's stuck; bring a comps-based counter.
- Current owner paid $25k; list at $80k implies a 224% gain — meaningful room to come down on a strong offer.
Risks & watch-outs
- Watch-outs: built in 1906 — expect roof / HVAC / electrical / plumbing capex.
- Climate carrying-cost: extreme-heat days projected 7→20/yr by 2055 (HVAC capex compounding) — expect insurance premiums to compound above CPI over the hold.
Questions for the listing agent
- It's been on market 116 days. Have you received any prior offers? Is the seller open to a 9% concession, seller financing, or rate buy-down credit?
- Built in 1906 — when were the roof, HVAC, electrical panel, plumbing, and water heater last replaced?
- Why hasn't it sold? Are there any deal-killer items the seller is aware of (foundation, flood, title, zoning, code violations)?
- Is there a deadline driving the sale (1031 exchange, divorce, estate, relocation)? That informs how much negotiation room exists.
- Schools are F-rated, which usually means shorter tenancies and higher turnover. Who's the typical renter profile here, and what's been the actual vacancy rate?
- Crime grade is D in this area — have there been break-ins, vandalism, or insurance claims at this property in the last 3 years? What carrier currently insures it and at what premium?
- What's the average days-on-market for RENTAL listings here right now (not sales)? A rising rental-DOM trend means longer vacancies and softer asking-rent achievability than the comps imply.
- What's the recent tenant-quality profile in this submarket — average credit score on applications, eviction rate, late-payment / NSF rate, and stable-employment percentage? A property-management company in the area should have these aggregated.
- How much new for-sale + rental construction is in the pipeline within 1–3 miles? Heavy new supply typically softens prices + rents 12–24 months out; constrained supply supports both.
Investment metrics
- 1% rule
- 1.87% ✓
- Cap rate
- 16.50%
- Cash-on-cash
- 36.44%
- DSCR
- 2.62
- GRM
- 4.4
CMA / ARV
- ARV (median comp)
- $235,025
- List price
- $80,000
- Delta
- -65.96%
- Verdict
- UNDERPRICED
- Comps
- 8 within 1.0 mi
Projected returns pro-forma
10.0% appreciation · 3.0% rent growth · sell at horizon
- IRR
- 52.3%
- Equity multiple
- 4.88×
- Total profit
- $86,888
- Equity at exit
- $72,070
- IRR
- 45.9%
- Equity multiple
- 10.90×
- Total profit
- $221,785
- Equity at exit
- $155,422
Cash invested: $22,400 (down + closing). Projections, not guarantees.
Landlord ↔ Tenant lean methodology
- Overall (STATE)
- 92 Strongly Landlord-Friendly
- State Arkansas
- 92 Strongly Landlord-Friendly · R+14
- County
- — inherits STATE
- City
- — inherits STATE
ZIP-level market 72046
- Home prices YoY
- 20.0%
- Active inventory
- 50
- Price-to-rent
- 4.4×
Monthly cashflow live
- Estimated rent
- $1,499 medium interval (Pro) →
- Mortgage (P&I)
- −$420
- Tax from tax record
- −$51 /mo · $613/yr
- Insurance
- −$33
- HOA
- −$0
- Vacancy / Maint / Mgmt
- −$315
- Net cashflow
- $680
Break-even live
UW: 25.0% down · 7.5% · 30yr · 1.5% tax · 5.0% vac · 8.0% maint · 8.0% mgmt
Financing live
Cash to close
- Down payment
- $20,000
- Closing costs
- $2,400
- Reserves months
- —
- Total cash needed
- —
Loan-product check · same deal, 3 products live
Conventional
25% down · 7.5% · 30yr
- Down + closing
- —
- Monthly P&I
- —
- Monthly cashflow
- —
- DSCR
- —
- Eligible?
- —
Personal DTI + credit; lowest rate.
DSCR
20% down · 8.5% · 30yr
- Down + closing
- —
- Monthly P&I
- —
- Monthly cashflow
- —
- DSCR
- —
- Eligible?
- —
No personal income docs; deal must DSCR.
Hard money
10% down · 12.0% · 12mo
- Down + closing
- —
- Monthly P&I
- —
- Monthly cashflow
- —
- DSCR
- —
- Eligible?
- —
Short-term bridge; refi at stabilization.
Rent comps 1 comps
| Address | Beds | Baths | Sqft | Rent | $/sqft | DOM | Units | Dist |
|---|---|---|---|---|---|---|---|---|
| 303 E Nichols St England, AR | 4.0 | 2.5 | 3000 | $1,499 | $0.50 | 14d | 1 | 0.20mi |
Listing history 10 events
-
2026-05-31days on market $80,000 Active 116 DOM
-
2026-05-31days on market $80,000 Active 115 DOM
-
2026-02-04$80,000 New Listing 803-char remark
Show marketing remark (803 chars)
Nestled off NE 4th St and St. John, this spacious five-bedroom, two-bath home offers classic charm with a brick exterior and a welcoming covered front porch. Inside, you'll find hardwood floors throughout most of the home, a generous kitchen with ample cabinet space, and plenty of room for a growing family or hosting guests. Out back, a large, solidly built garage/workshop provides versatile space for storage, hobbies, or outdoor gear. Situated in the heart of a thriving farming community and renowned duck hunting region, this property is ideal for those who love the outdoors. Being sold as is, this home is a perfect canvas for updates and personal touches. With the right improvements, it could serve as a comfortable full-time residence or a fantastic home base for hunters and their families.
-
2026-01-18historical
-
2025-05-17$80,000 New Listing
-
2015-05-21soldstatus $24,701
-
2015-03-31historical
-
2014-11-11$26,700
-
2010-08-05soldstatus $68,000
-
2005-08-19soldstatus $64,000
ⓘ Source: listings_history table (triggers on properties + properties_extension) + one-shot
backfill from property_details.listing_events for pre-trigger history.
Tax reassessment forecast AR · Resets to sale price
- Current annual tax
- $613 · $51/mo
- Projected year-2 tax
- $613 · $51/mo
- Expected delta
- $0/yr ($0/mo · 0.0%)
ⓘ Screening estimate from a state-policy table — verify with the county assessor before closing.
Climate risk First Street
- Flood 1/10 Low FEMA zone X (unshaded) · 0% chance over 30 yrs
- Wildfire 1/10 Low
- Heat 7/10 Severe 7 d/yr ≥108°F today · 20 d/yr by 30 yrs out
- Wind 4/10 Moderate 14% chance of damaging wind over 30 yrs
- Air quality 2/10 Low 1 unhealthy d/yr today · 2 by 30 yrs out
Nearby sold comps map
Loading sold comps map…
Walkable amenities ~0.75 mi
Loading nearby amenities…
Taxation est. · year 1
- Rental income
- $17,988
- − Mortgage interest
- −$4,481
- − Property taxes
- −$613
- − Insurance
- −$400
- − Repairs & maintenance
- −$1,439
- − Management
- −$1,439
- − Depreciation
- −$2,327
- Taxable income
- $7,288
- Est. tax owed @ 24.0%
- −$1,749
- After-tax cash flow
- $6,414/yr
For passive investors: Depreciation is non-cash, so a rental often shows a tax loss while cash-flowing — sheltering income. Rental losses are passive: they offset passive income freely, and up to $25,000/yr can offset ordinary (W-2) income if you actively participate and your MAGI is under $100k (phasing out to $0 by $150k); unused losses carry forward. On sale, claimed depreciation is recaptured at up to 25%, and gains may owe capital-gains tax (a 1031 exchange can defer both). Figures are a year-1 estimate at your 24.0% rate — not tax advice; consult a CPA.
Schools (NCES district)
- District
- England School District
- NCES district ID
- 0505850
- Math proficiency
- 27% ▼ -7.00%
- Reading proficiency
- 28% ▼ -2.00%
- Median HH income
- $36,807
- Composite
- 22.87/100
- National rank
- #8006
- State rank
- #170 of 238 in AR
Livability — England
- Score
- 67/100
- State rank
- #96
- US rank
- #10256
Category grades
Schools grade is shown separately in the Schools card above.
Census & demographics
- Census place
- England, AR
- Population (ZIP)
- 4,128
Population outlook (Lonoke County) Hauer SSP2
- Today (2025)
- 78,072 people
- By 2030
- 80,673 · +3.3%
- By 2040
- 84,977 · +8.8%
- By 2050
- 87,778 · +12.4%
- By 2075
- 91,398 · +17.1%
- By 2100
- 87,858 · +12.5%
Race, ethnicity, and origin ACS 2023
- Neighborhood character
- Predominantly White (68%)
- Race & ethnicity
- White 68% Black 20% Hispanic / Latino 6% Two or more races 5%
- Hispanic origin (detail)
- Mexican 5%
- Common ancestry
- Slovak 4% Serbian 1% Italian 1%
- Foreign-born
- 5% · Canada
- Languages at home
- 93% English-only · Spanish 7%
Political lean MEDSL · Lonoke
- 2024 margin
- Solid R (+53.7) · D 22.2% · R 75.8% · Other 2.0%
- 2008→2024 swing
- -6.2pp toward R · 2008: -47.5pp · 2024: -53.7pp
- All cycles
- 2024: R+53.7 2020: R+52.8 2016: R+53.3 2012: R+50.9 2008: R+47.5
Not yet ingested
- Civics
- —
Market trends
- HPI YoY
- ▲ 33.41%
- Current HPI
- 200.75
- Rent YoY
- —
- Metro
- —
- State GDP YoY
- ▲ 3.80%
- F500 in state
- 10
Industry mix (Fortune 500 HQ in AR)
| Industry | F500 HQs | Revenue |
|---|---|---|
| Retail | 1 | $681B |
|
||
| Food / Agriculture | 1 | $53B |
|
||
| Retail / Energy | 1 | $22B |
|
||
| Transportation / Logistics | 1 | $12B |
|
||
| Energy | 1 | $4B |
|
||
Price history
+25.0% since first listed8 events — show timeline
- 2026-02-04 Listed $80,000 CARMLS
- 2026-01-18 Listing Removed — CARMLS
- 2025-05-17 Listed $80,000 CARMLS
- 2015-05-21 Sold (MLS) $24,701 CARMLS
- 2015-03-31 Listing Removed — CARMLS
- 2014-11-11 Listed $26,700 CARMLS
- 2010-08-05 Sold (Public Records) $68,000 Public Records
- 2005-08-19 Sold (Public Records) $64,000 Public Records
Property tax history
-0.4%/yrLatest (2025): $613 · +0.0% YoY. Source: county tax records.
Cash-flow waterfall
monthlySold comps — $/sqft
last 12 mo · ≤1 miLoading sold comps…