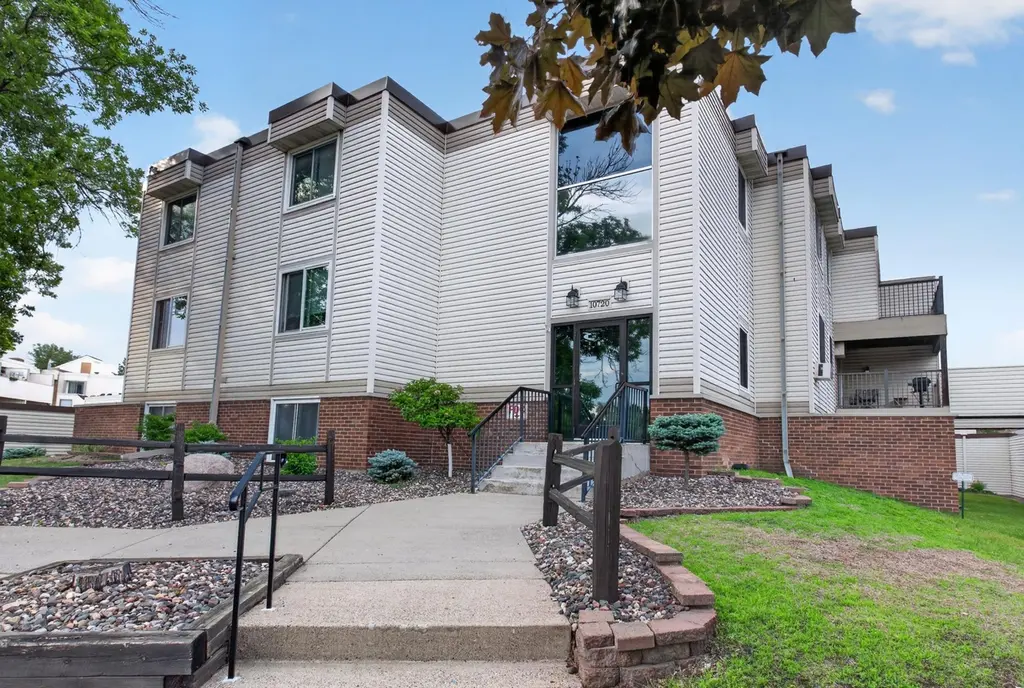
10720 Rockford Rd #205 · Plymouth, MN
Flood risk 1/10 · Minimal
- FEMA flood zone
- X (unshaded)
- Chance of flooding over 30 yrs
- 0.0%
- Est. flood insurance / yr
- $507 – $1,088
Fire risk 1/10 · Minimal
- Est. fire insurance / yr
- $888 – $1,650
Heat risk 2/10 · Minimal
- Hot days now (above 98°F)
- 7 days/yr
- Hot days in 30 yrs
- 14 days/yr
Wind risk 2/10 · Minimal
- Chance of severe wind over 30 yrs
- —
Air-quality risk 2/10 · Minimal
- Unhealthy air days now
- 2 days/yr
- Unhealthy air days in 30 yrs
- 2 days/yr
Risk factors via First Street. Map © Google.
Why this score? — see what drove the D grade
The composite is a weighted blend of 9 inputs, each scored 0–100. Each bar is that input's sub-score; the figure is the points it added to the 100-point composite (weight × sub-score).
- Cash flow +9.7/30.0
- 1% rule +8.9/10.0
- ARV discount +7.5/15.0
- Livability +4.2/5.0
- Rent growth +3.6/5.0
- Schools +3.0/10.0
- DSCR +2.7/10.0
- Condition / age +2.5/5.0
- Appreciation +0.0/10.0
$119,900
🖨 Deal sheet (PDF) 📄 Offer letter ✓ Due diligence
Listing remarks MLS
Discover the ultimate blend of comfort and convenience in this updated 2-bed, 1-bath condo in Plymouth, MN. Boasting new appliances, fresh paint, and plush carpet, this unit is move-in ready. Unwind on the huge deck or take advantage of the association's indoor and outdoor pools, tennis courts, and fitness room. Located just minutes from shopping, dining, and entertainment, this condo is the epitome of easy living. Don't miss out on the opportunity to make this your new home! Garage space, when available, can be rented for $50 per month, per space.
Key facts
- $594 HOA
- Garage
- Built 1970
Property features AI
Finance
- Other: Shared building rooms include an amusement/party room and an exercise room
- HOA & community: HOA managed by Cedar Management, Inc.; Monthly association fee; Association amenities include laundry and sauna; Association fee covers hazard insurance, heating, lawn care, grounds maintenance, professional management, sewer, shared amenities and water
Exterior
- Parking: No designated parking
- Utilities: City water connected; City sewer connected; Natural gas
- Home design: Attached residential property; Two levels; Main-level entry
- Construction: 900 foundation area; Other foundation
- Exterior features: Porch; Stone, metal and vinyl exterior
Interior
- Kitchen: Microwave; Range; Refrigerator; Stainless steel appliances; Eat-in kitchen
- Bedrooms: 2 bedrooms (both on the main level)
- Bathrooms: 1 full bathroom (main floor)
- Heating & cooling: Hot water heating; Wall unit(s) for cooling
- Interior features: Microwave; Range; Refrigerator; Stainless steel appliances; Eat-in kitchen; Deck
- Laundry & utility: Laundry in common area
Neighborhood map
What this means for you Summary
Snapshot
- This is a 2-bed/1.0-bath condo listed at $120k.
Deal economics
- At list price, monthly cash flow is $-79 ($-951/yr) — negative.
- To cash-flow at today's rent, offer at most $106k (11.7% below list).
- Meets the 1% rule at list price ($2k rent vs $120k).
- Recommended offer: $106k (11.7% below list) — sets the bar for cash-flow.
- Cap rate 5.5% vs local median 3.1% in Plymouth — top-decile yield for the area; either an underpriced asset or a hidden risk that comps aren't pricing in. Stress-test before assuming the spread holds.
Location & tenants
- Location reads 85/100 on livability (#17 in MN, #517 nationally) — a professional / high-income tenant draw. Strengths: crime A+, commute A+, employment A+; Watch: amenities F, cost of living F.
- Robbinsdale Public School District (suburban): math 24% / reading 44% proficiency, ranked #250 of 301 in MN (top 83%) — families likely to look elsewhere, expect single-tenant / working-renter base with shorter leases.
- Zoned schools: Zachary Lane Elementary (math 55% / reading 71%, grade B, #168 of 857 statewide, top 20%, 385 students, 29% FRL); Plymouth Middle (math 18% / reading 55%, grade F, #169 of 258 statewide, top 65%, 836 students, 50% FRL); Robbinsdale Armstrong Senior High (math 37% / reading 58%, grade D, #162 of 471 statewide, top 35%, 1,832 students, 45% FRL) — zoned schools at 41% FRL track the district average.
- Zoned-school proficiency averages 49% at this address vs 34% district-wide (+15 pts) — the actual schools serving this property are materially stronger than the Robbinsdale Public School District average implies; a family-tenant draw the district grade alone would hide.
- Market conditions: Rents rising fast (+4.5%/yr); 73 active listings in the ZIP; 16 comparable units currently listed for rent nearby; rentals at typical pace (median 24d on market — plan ~3-4 weeks tenant-placement turnaround); high-income renter base; 4,651 units permitted in Hennepin County in 2024 (2,443 in 5+ unit buildings).
- This rent is only 16% of the median local income ($124k/yr) — well below the 30% rent-burden line; pricing power to push rent on renewal without tenant pushback.
Forward outlook
- Local home prices are declining (-3.0%/yr); year-one equity from $829 of loan paydown is wiped out by about $4k of value loss. Plan a longer hold.
- Hennepin County population projected at +30% by 2050 — long-run rental-demand tailwind backs the buy-and-hold thesis.
Negotiation context
- It's been on market 16 days — a 2% lower offer ($118k) is reasonable based on typical stale-listing flexibility.
- 8 sale attempts since 34y ago with the ask held roughly flat each time — persistent listings suggest the price (not the market) is what's stuck; bring a comps-based counter.
Risks & watch-outs
- Watch-outs: HOA is 36% of rent.
Questions for the listing agent
- What do current leases actually rent for vs. the listed asking? Can we see a recent rent roll and the last 12 months of T-12 income?
- Built in 1970 — when were the roof, HVAC, electrical panel, plumbing, and water heater last replaced?
- What does the HOA fee cover, when was the last increase, and are there any pending special assessments or reserve-fund shortfalls?
- Any open or pending special assessments — roof, HVAC, plumbing, elevator, façade? What's the per-unit balance and payoff schedule, and is the seller paying it off at close or rolling it to the buyer?
- Is there a deadline driving the sale (1031 exchange, divorce, estate, relocation)? That informs how much negotiation room exists.
- Schools are A-rated — typically a magnet for longer-tenancy family renters. What's the average tenant stay here, and is there a school-zone premium baked into asking?
- The area grade is low — what's the realistic commute time and amenity access for the typical tenant pool here? Any planned neighborhood developments (good or bad) we should know about?
- What's the average days-on-market for RENTAL listings here right now (not sales)? A rising rental-DOM trend means longer vacancies and softer asking-rent achievability than the comps imply.
- What's the recent tenant-quality profile in this submarket — average credit score on applications, eviction rate, late-payment / NSF rate, and stable-employment percentage? A property-management company in the area should have these aggregated.
- How much new apartment / multifamily construction is in the pipeline within 1–3 miles? Heavy new supply (>2% of stock underway) typically softens rents 12–24 months out; light construction supports rent growth.
Investment metrics
- 1% rule
- 1.39% ✓
- Cap rate
- 5.50%
- Cash-on-cash
- -2.83%
- DSCR
- 0.87
- GRM
- 6.0
CMA / ARV
No comps found within radius.
Projected returns pro-forma
-3.0% appreciation · 4.52% rent growth · sell at horizon
- IRR
- -17.7%
- Equity multiple
- 0.36×
- Total profit
- $-21,508
- Equity at exit
- $17,877
- IRR
- -5.2%
- Equity multiple
- 0.62×
- Total profit
- $-12,727
- Equity at exit
- $10,367
Cash invested: $33,572 (down + closing). Projections, not guarantees.
Landlord ↔ Tenant lean methodology
- Overall (STATE)
- 46 Balanced
- State Minnesota
- 46 Balanced · D+2
- County
- — inherits STATE
- City
- — inherits STATE
ZIP-level market 55442
- Rents YoY
- 4.5%
- Active inventory
- 73
- Price-to-rent
- 6.0×
Monthly cashflow live
- Estimated rent
- $1,670 high interval (Pro) →
- Mortgage (P&I)
- −$629
- Tax from tax record
- −$126 /mo · $1,512/yr
- Insurance
- −$50
- HOA
- −$594
- Vacancy / Maint / Mgmt
- −$351
- Net cashflow
- $-79
Break-even live
Sensitivity live
| Price | -10% $-11 | -5% $-45 | +0% $-79 | +5% $-113 | +10% $-147 |
|---|---|---|---|---|---|
| Rent | -10% $-211 | -5% $-145 | +0% $-79 | +5% $-13 | +10% $53 |
| Rate | -1.0pp $-19 | -0.5pp $-49 | base $-79 | +0.5pp $-110 | +1.0pp $-142 |
UW: 25.0% down · 7.5% · 30yr · 1.5% tax · 5.0% vac · 8.0% maint · 8.0% mgmt
Financing live
Cash to close
- Down payment
- $29,975
- Closing costs
- $3,597
- Reserves months
- —
- Total cash needed
- —
Loan-product check · same deal, 3 products live
Conventional
25% down · 7.5% · 30yr
- Down + closing
- —
- Monthly P&I
- —
- Monthly cashflow
- —
- DSCR
- —
- Eligible?
- —
Personal DTI + credit; lowest rate.
DSCR
20% down · 8.5% · 30yr
- Down + closing
- —
- Monthly P&I
- —
- Monthly cashflow
- —
- DSCR
- —
- Eligible?
- —
No personal income docs; deal must DSCR.
Hard money
10% down · 12.0% · 12mo
- Down + closing
- —
- Monthly P&I
- —
- Monthly cashflow
- —
- DSCR
- —
- Eligible?
- —
Short-term bridge; refi at stabilization.
Rent comps 16 comps
| Address | Beds | Baths | Sqft | Rent | $/sqft | DOM | Units | Dist |
|---|---|---|---|---|---|---|---|---|
| 10840 Rockford Rd #203 Minneapolis, MN | 2.0 | 1.0 | 970 | $1,575 | $1.62 | 26d | 1 | 0.09mi |
| 10840 Rockford Rd #203 Minneapolis, MN | 2.0 | 1.0 | 970 | $1,575 | $1.62 | 45d | 1 | 0.09mi |
| 4545 Nathan Ln N Plymouth, MN | 1.0–3.0 | 1.0–2.0 | 1105 | $1,970 | $1.78 | 3d | 17 | 0.47mi |
| 4540 Nathan Ln N Minneapolis, MN | 1.0–3.0 | 1.0–2.0 | 1155 | $2,072 | $1.79 | 0d | 30 | 0.60mi |
| 4075 Lancaster Ln N Unit 4075-4 Minneapolis, MN | 1.0 | 1.0 | 800 | $1,355 | $1.69 | 22d | 1 | 0.61mi |
| 4075 Lancaster Ln N Unit 4055-3 Minneapolis, MN | 2.0 | 1.0 | 985 | $1,615 | $1.64 | 23d | 1 | 0.61mi |
| 4075 Lancaster Ln N #6 Minneapolis, MN | 2.0 | 1.0–2.0 | 1017 | $1,688 | $1.66 | 0d | 2 | 0.62mi |
| 3925 Lancaster Ln N Plymouth, MN | 1.0–2.0 | 1.0–2.0 | 950 | $1,670 | $1.76 | 0d | 9 | 0.73mi |
| 3930 Lancaster Ln N Minneapolis, MN | 1.0 | 1.0 | 800 | $1,200 | $1.50 | 25d | 1 | 0.80mi |
| 9700 37th Pl N Plymouth, MN | 1.0–2.0 | 1.0 | 980 | $1,474 | $1.50 | 45d | 1 | 0.81mi |
| 4601 Independence Ave N Unit 202 Minneapolis, MN | 1.0 | 1.0 | 699 | $1,195 | $1.71 | 26d | 1 | 0.83mi |
| 4601 Independence Ave N Unit 306 Minneapolis, MN | 2.0 | 1.0 | 987 | $1,450 | $1.47 | 6d | 1 | 0.83mi |
| 9630 37th Pl N Plymouth, MN | 1.0–2.0 | 1.0 | 900 | $1,490 | $1.66 | 1d | 10 | 0.87mi |
| 3610 Lancaster Ln N Minneapolis, MN | 1.0–2.0 | 1.0 | 824 | $1,600 | $1.94 | 1d | 11 | 1.01mi |
| 5445 Orleans Ln N #2 Minneapolis, MN | 2.0 | 2.0 | 1105 | $1,850 | $1.67 | 26d | 1 | 1.35mi |
| 8420 N 42nd Ave Apt 10 New Hope, MN | 2.0 | 1.0 | 800 | $1,399 | $1.75 | 26d | 1 | 1.44mi |
HOA detail condo
- Monthly dues
- $594 · $7,128/yr
- Likely covers
- pool
- Assessments
- None detected in remarks — confirm with the listing agent.
Listing history 12 events
-
2026-06-21pricedays on market $119,900 Active 16 DOM
-
2026-06-18days on market $124,900 Active 13 DOM
-
2026-06-17remarks 335-char remark
-
2026-06-17days on market $124,900 Active 12 DOM
-
2026-06-16days on market $124,900 Active 11 DOM
-
2026-06-15days on market $124,900 Active 10 DOM
-
2026-06-13days on market $124,900 Active 8 DOM
-
2026-06-13days on market $124,900 Active 7 DOM
-
2026-06-09days on market $124,900 Active 4 DOM
-
2026-06-08days on market $124,900 Active 3 DOM
-
2026-06-07remarks 329-char remark
-
2026-06-07$124,900 Active 2 DOM
ⓘ Source: listings_history table (triggers on properties + properties_extension) + one-shot
backfill from property_details.listing_events for pre-trigger history.
Tax reassessment forecast MN · Partial reset (capped growth)
- Current annual tax
- $1,512 · $126/mo
- Projected year-2 tax
- $1,512 · $126/mo
- Expected delta
- $0/yr ($0/mo · 0.0%)
ⓘ Screening estimate from a state-policy table — verify with the county assessor before closing.
Climate risk First Street
- Flood 1/10 Low FEMA zone X (unshaded) · 0% chance over 30 yrs
- Wildfire 1/10 Low
- Heat 2/10 Low 7 d/yr ≥98°F today · 14 d/yr by 30 yrs out
- Wind 2/10 Low
- Air quality 2/10 Low 2 unhealthy d/yr today · 2 by 30 yrs out
Nearby sold comps map
Loading sold comps map…
Walkable amenities ~0.75 mi
Loading nearby amenities…
Taxation est. · year 1
- Rental income
- $20,042
- − Mortgage interest
- −$6,716
- − Property taxes
- −$1,512
- − Insurance
- −$600
- − Repairs & maintenance
- −$1,603
- − Management
- −$1,603
- − HOA
- −$7,128
- − Depreciation
- −$3,488
- Taxable loss
- −$2,608
- Est. tax savings @ 24.0%
- +$626
- After-tax cash flow
- $-325/yr
For passive investors: Depreciation is non-cash, so a rental often shows a tax loss while cash-flowing — sheltering income. Rental losses are passive: they offset passive income freely, and up to $25,000/yr can offset ordinary (W-2) income if you actively participate and your MAGI is under $100k (phasing out to $0 by $150k); unused losses carry forward. On sale, claimed depreciation is recaptured at up to 25%, and gains may owe capital-gains tax (a 1031 exchange can defer both). Figures are a year-1 estimate at your 24.0% rate — not tax advice; consult a CPA.
Schools (NCES district)
- District
- Robbinsdale Public School District
- NCES district ID
- 2731780
- Math proficiency
- 24% ▼ -11.00%
- Reading proficiency
- 44% ▼ -5.00%
- Median HH income
- $60,234
- Composite
- 30.42/100
- National rank
- #6240
- State rank
- #250 of 301 in MN
Livability — Plymouth
- Score
- 85/100
- State rank
- #17
- US rank
- #517
Category grades
Schools grade is shown separately in the Schools card above.
Census & demographics
- Census place
- Plymouth, MN
- County
- Hennepin County · 1,150,272 people
- City population
- 79,816
- Metro
- Minneapolis-St. Paul-Bloomington, MN-WI
- Population (ZIP)
- 12,694
- Household income
- $123,859
- Rent vs Own
- Severe rent burden
- 141.0
Population outlook (Hennepin County) Hauer SSP2
- Today (2025)
- 1,405,227 people
- By 2030
- 1,492,650 · +6.2%
- By 2040
- 1,660,157 · +18.1%
- By 2050
- 1,823,498 · +29.8%
- By 2075
- 2,221,283 · +58.1%
- By 2100
- 2,509,976 · +78.6%
Race, ethnicity, and origin ACS 2023
- Neighborhood character
- Predominantly White (78%)
- Race & ethnicity
- White 78% Two or more races 9% Asian 6% Hispanic / Latino 5% Black 4%
- Common ancestry
- Portuguese 15% Romanian 7% Lithuanian 4%
- Foreign-born
- 9% · Canada, China, Jamaica
- Languages at home
- 89% English-only · Spanish 2% Russian/Polish/Slavic 2% Tagalog/Filipino 1%
Political lean MEDSL · Hennepin
- 2024 margin
- Solid D (+42.6) · D 70.2% · R 27.5% · Other 2.3%
- 2008→2024 swing
- +14.0pp toward D · 2008: 28.6pp · 2024: 42.6pp
- All cycles
- 2024: D+42.6 2020: D+43.2 2016: D+35.3 2012: D+27.1 2008: D+28.6
Not yet ingested
- Civics
- —
Market trends
- HPI YoY
- ▼ -131.05%
- Current HPI
- 213.1289
- Rent YoY
- ▲ 4.52%
- Metro
- Minneapolis-St. Paul-Bloomington, MN-WI
- State GDP YoY
- ▲ 2.41%
- F500 in state
- 34
Industry mix (Fortune 500 HQ in MN)
| Industry | F500 HQs | Revenue |
|---|---|---|
| Healthcare | 2 | $407B |
|
||
| Retail | 2 | $150B |
|
||
| Consumer Goods | 2 | $32B |
|
||
| Industrial Machinery | 2 | $6B |
|
||
| Agriculture | 1 | $40B |
|
||
| Healthcare / Medical Devices | 1 | $32B |
|
||
Price history
+296.5% since first listed27 events — show timeline
- 2026-06-06 Listed $124,900 NORTHSTARMLS as Distributed by MLS Grid
- 2026-06-05 Coming Soon $124,900 NORTHSTARMLS as Distributed by MLS Grid
- 2023-06-01 Sold (Public Records) $145,000 Public Records
- 2023-05-31 Sold (MLS) $145,000 NORTHSTARMLS as Distributed by MLS Grid
- 2023-05-24 Pending — NORTHSTARMLS as Distributed by MLS Grid
- 2023-05-02 Contingent — NORTHSTARMLS as Distributed by MLS Grid
- 2023-04-28 Listed $141,000 NORTHSTARMLS as Distributed by MLS Grid
- 2018-01-16 Sold (Public Records) $109,900 Public Records
- 2018-01-11 Sold (MLS) $109,900 NORTHSTARMLS as Distributed by MLS Grid
- 2017-12-27 Pending — NORTHSTARMLS as Distributed by MLS Grid
- 2017-12-22 Contingent — NORTHSTARMLS as Distributed by MLS Grid
- 2017-12-13 Relisted — NORTHSTARMLS as Distributed by MLS Grid
- 2017-12-12 Contingent — NORTHSTARMLS as Distributed by MLS Grid
- 2017-10-02 Listed $109,900 NORTHSTARMLS as Distributed by MLS Grid
- 2003-04-10 Sold (Public Records) $110,000 Public Records
- 2000-06-29 Sold (MLS) $91,700 NORTHSTARMLS as Distributed by MLS Grid
- 2000-05-31 Listing Removed — NORTHSTARMLS as Distributed by MLS Grid
- 2000-05-18 Listed $89,900 NORTHSTARMLS as Distributed by MLS Grid
- 1993-11-15 Sold (Public Records) $31,000 Public Records
- 1993-10-25 Sold (MLS) $31,000 NORTHSTARMLS as Distributed by MLS Grid
- 1993-09-10 Listing Removed — NORTHSTARMLS as Distributed by MLS Grid
- 1993-08-07 Listed $32,900 NORTHSTARMLS as Distributed by MLS Grid
- 1993-04-19 Listing Removed — NORTHSTARMLS as Distributed by MLS Grid
- 1992-10-19 Listed $34,700 NORTHSTARMLS as Distributed by MLS Grid
- 1992-10-02 Listing Removed — NORTHSTARMLS as Distributed by MLS Grid
- 1992-04-02 Listed $34,700 NORTHSTARMLS as Distributed by MLS Grid
- 1991-07-22 Sold (Public Records) $31,500 Public Records
Property tax history
+5.9%/yrLatest (2025): $1,512 · +10.9% YoY. Source: county tax records.
Cash-flow waterfall
monthlySold comps — $/sqft
last 12 mo · ≤1 miLoading sold comps…