 🏷️ Likely Rental
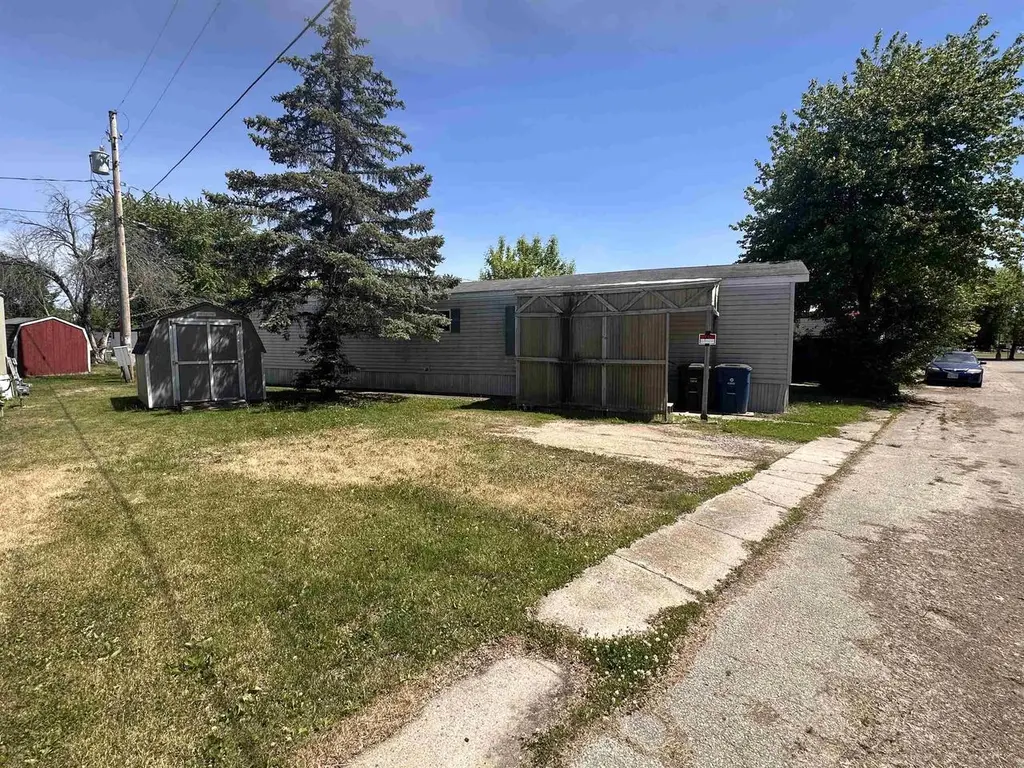
14 Mulberry Ln · Omro, WI
Flood risk No data
- FEMA flood zone
- —
- Chance of flooding over 30 yrs
- —
- Est. flood insurance / yr
- —
Fire risk No data
- Est. fire insurance / yr
- —
Heat risk No data
- Hot days now (above threshold)
- —
- Hot days in 30 yrs
- —
Wind risk No data
- Chance of severe wind over 30 yrs
- —
Air-quality risk No data
- Unhealthy air days now
- —
- Unhealthy air days in 30 yrs
- —
Risk factors via First Street. Map © Google.
Why this score? — see what drove the D grade
The composite is a weighted blend of 9 inputs, each scored 0–100. Each bar is that input's sub-score; the figure is the points it added to the 100-point composite (weight × sub-score).
- Cash flow +15.0/30.0
- ARV discount +7.5/15.0
- 1% rule +5.0/10.0
- DSCR +5.0/10.0
- Schools +3.3/10.0
- Livability +3.3/5.0
- Rent growth +2.5/5.0
- Condition / age +2.5/5.0
- Appreciation +0.0/10.0
$19,000
🖨 Deal sheet 📄 Offer letter ✓ Due diligence
Listing remarks
Don't sleep on this Omro Fixer, 2 spacious bedrooms, 1 bath, Full size laundry, Open concept kitchen with breakfast bar and spacious living room. With a little sprucing up this could be a cozy spot to call home. New shed, Covered entry and Off-street parking, quite spot conveniently located in Omro. Home is part of an estate being sold As-is. $475 per month lot fee plus Buyer pays Water & Sewer. 64x14, HOLPK, Built 2001, Issued 9/3/2004 Sale is for purcahse of home only, no land included.
Key facts
- Open concept kitchen
- Covered entry
- Off-street parking
Tags
Property features AI
Finance
- Other: Sold/Offered as-is
Exterior
- Utilities: Municipal water; Municipal sewer; Natural gas
- Home design: Single-family property; Slab foundation (no basement)
- Construction: Vinyl exterior
- Exterior features: Deck; Storage building (outbuilding)
Interior
- Kitchen: Kitchen on the main level (12 x 13); Breakfast bar; Range/Oven; Refrigerator; Microwave
- Bedrooms: Primary bedroom on the main level (11 x 13); Second bedroom on the main level (11 x 11)
- Bathrooms: One full bathroom; No ensuite bath in the primary bedroom
- Heating & cooling: Forced air heating; Central air conditioning; Natural gas fuel
- Interior features: Great room; Cathedral/vaulted ceilings
- Laundry & utility: Washer; Dryer
Neighborhood map
What this means for you Summary
Snapshot
- This is a 2-bed/1.0-bath single-family listed at $19k.
Deal economics
- At list price, monthly cash flow is $836 ($10k/yr) — positive.
- The deal already cash-flows at list — no discount required.
- Meets the 1% rule at list price ($1k rent vs $19k).
Location & tenants
- Location reads 66/100 on livability (#448 in WI) — a middle-class / working-renter tenant base. Strengths: cost of living A+, housing A+, crime A; Watch: schools D, amenities F, commute F.
- Omro School District (rural): math 37% / reading 37% proficiency, ranked #186 of 342 in WI (top 54%) — families likely to look elsewhere, expect single-tenant / working-renter base with shorter leases.
- Market conditions: 14 active listings in the ZIP; 1 comparable units currently listed for rent nearby; 652 units permitted in Winnebago County in 2024 (333 in 5+ unit buildings).
Forward outlook
- Local home prices are declining (-3.0%/yr); year-one equity from $131 of loan paydown is wiped out by about $570 of value loss. Plan a longer hold.
- Winnebago County population projected at +3% by 2050 — modest demand growth; plan on rents tracking national, not racing it.
- At projected returns (-3.0% appreciation + 3.0% rent growth), your $5k cash investment doubles in ~1 year — after that, you're playing with house money.
Negotiation context
- Only 10 days on market — expect competitive offers; lowballing is unlikely to land.
Questions for the listing agent
- Is there a deadline driving the sale (1031 exchange, divorce, estate, relocation)? That informs how much negotiation room exists.
- Schools are D-rated, which usually means shorter tenancies and higher turnover. Who's the typical renter profile here, and what's been the actual vacancy rate?
- The area grade is low — what's the realistic commute time and amenity access for the typical tenant pool here? Any planned neighborhood developments (good or bad) we should know about?
- What's the average days-on-market for RENTAL listings here right now (not sales)? A rising rental-DOM trend means longer vacancies and softer asking-rent achievability than the comps imply.
- What's the recent tenant-quality profile in this submarket — average credit score on applications, eviction rate, late-payment / NSF rate, and stable-employment percentage? A property-management company in the area should have these aggregated.
- How much new for-sale + rental construction is in the pipeline within 1–3 miles? Heavy new supply typically softens prices + rents 12–24 months out; constrained supply supports both.
Investment metrics
- 1% rule
- 6.44% ✓
- Cap rate
- 59.07%
- Cash-on-cash
- 188.49%
- DSCR
- 9.39
- GRM
- 1.3
CMA / ARV
- ARV (on-the-fly)
- $208,768
- Comps found
- 2
Show comp detail 2 sales within ~0.75 mi
| Address | Dist | Beds/Ba | Sqft | Sold | Price | $/sf | Match |
|---|---|---|---|---|---|---|---|
| 1213 E Main St | 0.13mi | 2/1.0 | 877 (-2%) | 20mo | $120,000 | $137 | 74 |
| 708 Pine St | 0.68mi | 3/1.0 (+1) | 1,008 (+12%) | 8mo | $235,000 | $233 | 36 |
Match score weights: distance 35% · size 25% · config 20% · recency 20%. Top-matched comps best support the ARV.
Projected returns pro-forma
-3.0% appreciation · 3.0% rent growth · sell at horizon
- IRR
- —
- Equity multiple
- 10.43×
- Total profit
- $50,163
- Equity at exit
- $2,833
- IRR
- —
- Equity multiple
- 22.11×
- Total profit
- $112,290
- Equity at exit
- $1,643
Cash invested: $5,320 (down + closing). Projections, not guarantees.
Landlord ↔ Tenant lean methodology
- Overall (STATE)
- 73 Landlord-Friendly
- State Wisconsin
- 73 Landlord-Friendly · R+2
- County
- — inherits STATE
- City
- — inherits STATE
ZIP-level market 54963
- Home prices YoY
- -34.2%
- Active inventory
- 14
- Price-to-rent
- 1.3×
Monthly cashflow live
- Estimated rent
- $1,224 medium interval (Pro) →
- Mortgage (P&I)
- −$100
- Tax est. 1.5%
- −$24 /mo · $285/yr
- Insurance
- −$8
- HOA
- −$0
- Vacancy / Maint / Mgmt
- −$257
- Net cashflow
- $836
Break-even live
UW: 25.0% down · 7.5% · 30yr · 1.5% tax · 5.0% vac · 8.0% maint · 8.0% mgmt
Financing live
Cash to close
- Down payment
- $4,750
- Closing costs
- $570
- Reserves months
- —
- Total cash needed
- —
Loan-product check · same deal, 3 products live
Conventional
25% down · 7.5% · 30yr
- Down + closing
- —
- Monthly P&I
- —
- Monthly cashflow
- —
- DSCR
- —
- Eligible?
- —
Personal DTI + credit; lowest rate.
DSCR
20% down · 8.5% · 30yr
- Down + closing
- —
- Monthly P&I
- —
- Monthly cashflow
- —
- DSCR
- —
- Eligible?
- —
No personal income docs; deal must DSCR.
Hard money
10% down · 12.0% · 12mo
- Down + closing
- —
- Monthly P&I
- —
- Monthly cashflow
- —
- DSCR
- —
- Eligible?
- —
Short-term bridge; refi at stabilization.
Rent comps 1 comps
| Address | Beds | Baths | Sqft | Rent | $/sqft | DOM | Units | Dist |
|---|---|---|---|---|---|---|---|---|
| 1670 Huckleberry Ave Omro, WI | 1.0–3.0 | 1.0–2.0 | 950 | $1,224 | $1.29 | 13d | 6 | 0.22mi |
Listing history 9 events
-
2026-06-15status $19,000 Pending 10 DOM
-
2026-06-15days on market $19,000 Active 10 DOM
-
2026-06-14days on market $19,000 Active 8 DOM
-
2026-06-13days on market $19,000 Active 7 DOM
-
2026-06-10days on market $19,000 Active 5 DOM
-
2026-06-09days on market $19,000 Active 4 DOM
-
2026-06-08days on market $19,000 Active 3 DOM
-
2026-06-07remarks 495-char remark
-
2026-06-07$19,000 Active 2 DOM
ⓘ Source: listings_history table (triggers on properties + properties_extension) + one-shot
backfill from property_details.listing_events for pre-trigger history.
Nearby sold comps map
Loading sold comps map…
Walkable amenities ~0.75 mi
Loading nearby amenities…
Taxation est. · year 1
- Rental income
- $14,688
- − Mortgage interest
- −$1,064
- − Property taxes
- −$285
- − Insurance
- −$95
- − Repairs & maintenance
- −$1,175
- − Management
- −$1,175
- − Depreciation
- −$553
- Taxable income
- $10,341
- Est. tax owed @ 24.0%
- −$2,482
- After-tax cash flow
- $7,546/yr
For passive investors: Depreciation is non-cash, so a rental often shows a tax loss while cash-flowing — sheltering income. Rental losses are passive: they offset passive income freely, and up to $25,000/yr can offset ordinary (W-2) income if you actively participate and your MAGI is under $100k (phasing out to $0 by $150k); unused losses carry forward. On sale, claimed depreciation is recaptured at up to 25%, and gains may owe capital-gains tax (a 1031 exchange can defer both). Figures are a year-1 estimate at your 24.0% rate — not tax advice; consult a CPA.
Schools (NCES district)
- District
- Omro School District
- NCES district ID
- 5510980
- Math proficiency
- 37% ▲ 9.00%
- Reading proficiency
- 37% ▲ 1.00%
- Median HH income
- $59,410
- Composite
- 32.92/100
- National rank
- #5602
- State rank
- #186 of 342 in WI
Livability — Omro
- Score
- 66/100
- State rank
- #448
- US rank
- #11406
Category grades
Schools grade is shown separately in the Schools card above.
Census & demographics
- Census place
- Omro, WI
- Population (ZIP)
- 7,203
Population outlook (Winnebago County) Hauer SSP2
- Today (2025)
- 175,480 people
- By 2030
- 177,928 · +1.4%
- By 2040
- 180,873 · +3.1%
- By 2050
- 181,302 · +3.3%
- By 2075
- 184,071 · +4.9%
- By 2100
- 175,932 · +0.3%
Race, ethnicity, and origin ACS 2023
- Neighborhood character
- Predominantly White (95%)
- Race & ethnicity
- White 95% Two or more races 2% Hispanic / Latino 1%
- Common ancestry
- Romanian 8% Portuguese 7% Lithuanian 2%
- Foreign-born
- 1%
- Languages at home
- 99% English-only · German/W. Germanic 1% Spanish 1%
Political lean MEDSL · Winnebago
- 2024 margin
- Toss-up / Even · D 46.9% · R 51.7% · Other 1.4%
- 2008→2024 swing
- -16.4pp toward R · 2008: 11.7pp · 2024: -4.8pp
- All cycles
- 2024: R+4.8 2020: R+4.0 2016: R+7.4 2012: D+3.8 2008: D+11.7
Not yet ingested
- Civics
- —
Market trends
- HPI YoY
- ▼ -101.14%
- Current HPI
- 194.1198
- Rent YoY
- —
- Metro
- —
- State GDP YoY
- ▲ 2.10%
- F500 in state
- 20
Industry mix (Fortune 500 HQ in WI)
| Industry | F500 HQs | Revenue |
|---|---|---|
| Industrial Machinery | 4 | $23B |
|
||
| Industrial Technology | 2 | $36B |
|
||
| Insurance | 1 | $36B |
|
||
| Professional Services | 1 | $19B |
|
||
| Utilities | 1 | $9B |
|
||
| Consumer Goods | 1 | $3B |
|
||
Price history
1 event — show timeline
- 2026-06-05 Listed $19,000 SCWMLS
Cash-flow waterfall
monthlySold comps — $/sqft
last 12 mo · ≤1 miLoading sold comps…