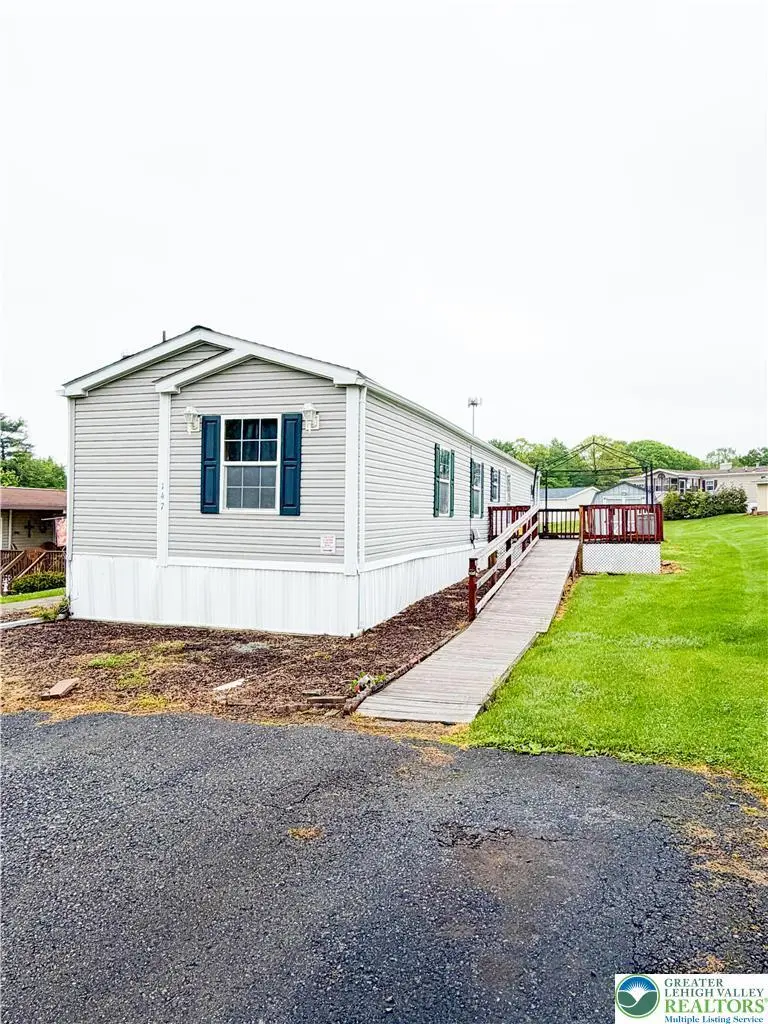
147 Ashley Ln · Lehighton, PA
Flood risk 1/10 · Minimal
- FEMA flood zone
- X (unshaded)
- Chance of flooding over 30 yrs
- 0.0%
- Est. flood insurance / yr
- $507 – $1,088
Fire risk 3/10 · Minor
- Est. fire insurance / yr
- $511 – $949
Heat risk 4/10 · Minor
- Hot days now (above 97°F)
- 7 days/yr
- Hot days in 30 yrs
- 16 days/yr
Wind risk 4/10 · Minor
- Chance of severe wind over 30 yrs
- 11.0%
Air-quality risk 2/10 · Minimal
- Unhealthy air days now
- 1 days/yr
- Unhealthy air days in 30 yrs
- 1 days/yr
Risk factors via First Street. Map © Google.
Why this score? — see what drove the D grade
The composite is a weighted blend of 9 inputs, each scored 0–100. Each bar is that input's sub-score; the figure is the points it added to the 100-point composite (weight × sub-score).
- Cash flow +12.3/30.0
- 1% rule +10.0/10.0
- ARV discount +5.2/15.0
- Livability +3.9/5.0
- DSCR +3.7/10.0
- Schools +3.5/10.0
- Rent growth +2.5/5.0
- Condition / age +2.5/5.0
- Appreciation +0.0/10.0
$85,000
🖨 Deal sheet (PDF) 📄 Offer letter ✓ Due diligence
Listing remarks
Discover affordable, low-maintenance living in the desirable Northside Heights Estates community! This 2 bedroom, 2 bath manufactured home offers comfortable one floor living with an open concept layout perfect for everyday living and entertaining. The spacious living room flows seamlessly into the dining area and large kitchen featuring ample cabinet and counter space. The primary bedroom includes a private full bath, while the second bedroom and additional full bath provide flexibility for guests, a home office, or hobbies. Enjoy the convenience of off-street parking, outdoor storage, and peaceful community surroundings with scenic mountain views nearby. Conveniently situated near major r
Key facts
- Outdoor storage
- Ample cabinet space
- Private full bath
Tags
Property features AI
Finance
- HOA & community: Association fee $610.50 monthly
Exterior
- Parking: No garage
- Utilities: Public water; Public sewer; Electric service 200+ amps with circuit breakers
- Home design: Single-story; Zoned RR
- Construction: Vinyl siding and wood siding; Asphalt/fiberglass roof; Slab foundation; About 1,050 above-grade finished area
- Exterior features: Mobile home; Lot roughly 0.22 acre (approx. 9,632 sq ft); Lot dimensions approx. 64 x 147 x 64 x 154
Interior
- Kitchen: Dishwasher; Electric oven; Electric range; Refrigerator
- Bedrooms: Total rooms: 5
- Flooring: Carpet; Luxury vinyl / luxury vinyl plank; Vinyl
- Bathrooms: 2 full bathrooms
- Heating & cooling: Forced air heating (oil); Central air conditioning
- Interior features: Dining area; Separate/formal dining room
- Laundry & utility: Washer; Electric dryer; Electric dryer hookup; Electric water heater
Neighborhood map
What this means for you Summary
Snapshot
- This is a 2-bed/2.0-bath manufactured listed at $85k.
Deal economics
- At list price, monthly cash flow is $-15 ($-185/yr) — negative.
- To cash-flow at today's rent, offer at most $82k (3.2% below list).
- Meets the 1% rule at list price ($1k rent vs $85k).
- Recommended offer: $82k (3.2% below list) — sets the bar for cash-flow.
- Cap rate 6.1% vs local median 4.3% in Lehighton — top-decile yield for the area; either an underpriced asset or a hidden risk that comps aren't pricing in. Stress-test before assuming the spread holds.
Location & tenants
- Location reads 77/100 on livability (#321 in PA, #2,848 nationally) — a middle-class / working-renter tenant base. Strengths: cost of living A+, health & safety A+, crime A-; Watch: employment D, commute F.
- Lehighton Area SD (suburban): math 32% / reading 50% proficiency, ranked #336 of 539 in PA (top 62%) — families likely to look elsewhere, expect single-tenant / working-renter base with shorter leases.
- Market conditions: 144 active listings in the ZIP; 180 units permitted in Carbon County in 2024 (10 in 5+ unit buildings).
Forward outlook
- Local home prices are declining (-3.0%/yr); year-one equity from $588 of loan paydown is wiped out by about $3k of value loss. Plan a longer hold.
- Carbon County population projected at -18% by 2050 — secular population decline; favor cash flow + early exit over multi-decade hold.
Negotiation context
- It's been on market 19 days — a 2% lower offer ($84k) is reasonable based on typical stale-listing flexibility.
Risks & watch-outs
- Watch-outs: HOA is 41% of rent.
Questions for the listing agent
- What do current leases actually rent for vs. the listed asking? Can we see a recent rent roll and the last 12 months of T-12 income?
- What does the HOA fee cover, when was the last increase, and are there any pending special assessments or reserve-fund shortfalls?
- Is there a deadline driving the sale (1031 exchange, divorce, estate, relocation)? That informs how much negotiation room exists.
- The area grade is low — what's the realistic commute time and amenity access for the typical tenant pool here? Any planned neighborhood developments (good or bad) we should know about?
- What's the average days-on-market for RENTAL listings here right now (not sales)? A rising rental-DOM trend means longer vacancies and softer asking-rent achievability than the comps imply.
- What's the recent tenant-quality profile in this submarket — average credit score on applications, eviction rate, late-payment / NSF rate, and stable-employment percentage? A property-management company in the area should have these aggregated.
- How much new for-sale + rental construction is in the pipeline within 1–3 miles? Heavy new supply typically softens prices + rents 12–24 months out; constrained supply supports both.
Investment metrics
- 1% rule
- 1.75% ✓
- Cap rate
- 6.08%
- Cash-on-cash
- -0.78%
- DSCR
- 0.97
- GRM
- 4.8
CMA / ARV
- ARV (on-the-fly)
- $80,850
- Comps found
- 2
Show comp detail 2 sales within ~0.75 mi
| Address | Dist | Beds/Ba | Sqft | Sold | Price | $/sf | Match |
|---|---|---|---|---|---|---|---|
| 163 Sheldan Ln Lot 163 | 0.09mi | 2/2.0 | 1,104 (+5%) | 3mo | $85,000 | $77 | 84 |
| 92 Sam Brooke Cir | 0.28mi | 3/2.0 (+1) | 1,152 (+10%) | 8mo | $65,000 | $56 | 59 |
Match score weights: distance 35% · size 25% · config 20% · recency 20%. Top-matched comps best support the ARV.
Projected returns pro-forma
-3.0% appreciation · 3.0% rent growth · sell at horizon
- IRR
- -17.0%
- Equity multiple
- 0.40×
- Total profit
- $-14,360
- Equity at exit
- $12,674
- IRR
- -8.0%
- Equity multiple
- 0.49×
- Total profit
- $-12,169
- Equity at exit
- $7,349
Cash invested: $23,800 (down + closing). Projections, not guarantees.
Landlord ↔ Tenant lean methodology
- Overall (STATE)
- 62 Landlord-Friendly
- State Pennsylvania
- 62 Landlord-Friendly · EVEN
- County
- — inherits STATE
- City
- — inherits STATE
ZIP-level market 18235
- Home prices YoY
- -27.1%
- Active inventory
- 144
- Price-to-rent
- 4.8×
Monthly cashflow live
- Estimated rent
- $1,488 medium interval (Pro) →
- Mortgage (P&I)
- −$446
- Tax from tax record
- −$100 /mo · $1,197/yr
- Insurance
- −$35
- HOA
- −$610
- Vacancy / Maint / Mgmt
- −$312
- Net cashflow
- $-15
Break-even live
Sensitivity live
| Price | -10% $33 | -5% $9 | +0% $-15 | +5% $-39 | +10% $-64 |
|---|---|---|---|---|---|
| Rent | -10% $-133 | -5% $-74 | +0% $-15 | +5% $43 | +10% $102 |
| Rate | -1.0pp $27 | -0.5pp $6 | base $-15 | +0.5pp $-37 | +1.0pp $-60 |
UW: 25.0% down · 7.5% · 30yr · 1.5% tax · 5.0% vac · 8.0% maint · 8.0% mgmt
Financing live
Cash to close
- Down payment
- $21,250
- Closing costs
- $2,550
- Reserves months
- —
- Total cash needed
- —
Loan-product check · same deal, 3 products live
Conventional
25% down · 7.5% · 30yr
- Down + closing
- —
- Monthly P&I
- —
- Monthly cashflow
- —
- DSCR
- —
- Eligible?
- —
Personal DTI + credit; lowest rate.
DSCR
20% down · 8.5% · 30yr
- Down + closing
- —
- Monthly P&I
- —
- Monthly cashflow
- —
- DSCR
- —
- Eligible?
- —
No personal income docs; deal must DSCR.
Hard money
10% down · 12.0% · 12mo
- Down + closing
- —
- Monthly P&I
- —
- Monthly cashflow
- —
- DSCR
- —
- Eligible?
- —
Short-term bridge; refi at stabilization.
HOA detail
- Monthly dues
- $610 · $7,320/yr
Listing history 12 events
-
2026-06-15statusdays on market $85,000 Pending 19 DOM
-
2026-06-14days on market $85,000 Active 18 DOM
-
2026-06-10days on market $85,000 Active 15 DOM
-
2026-06-09days on market $85,000 Active 14 DOM
-
2026-06-08days on market $85,000 Active 13 DOM
-
2026-06-07days on market $85,000 Active 12 DOM
-
2026-06-03days on market $85,000 Active 8 DOM
-
2026-06-02days on market $85,000 Active 7 DOM
-
2026-06-01days on market $85,000 Active 6 DOM
-
2026-05-31days on market $85,000 Active 5 DOM
-
2026-05-31days on market $85,000 Active 4 DOM
-
2026-05-26$85,000 Active
ⓘ Source: listings_history table (triggers on properties + properties_extension) + one-shot
backfill from property_details.listing_events for pre-trigger history.
Tax reassessment forecast PA · Partial reset (capped growth)
- Current annual tax
- $1,197 · $100/mo
- Projected year-2 tax
- $1,270 · $106/mo
- Expected delta
- +$73/yr (+$6/mo · 6.1%)
ⓘ Screening estimate from a state-policy table — verify with the county assessor before closing.
Climate risk First Street
- Flood 1/10 Low FEMA zone X (unshaded) · 0% chance over 30 yrs
- Wildfire 3/10 Moderate
- Heat 4/10 Moderate 7 d/yr ≥97°F today · 16 d/yr by 30 yrs out
- Wind 4/10 Moderate 11% chance of damaging wind over 30 yrs
- Air quality 2/10 Low 1 unhealthy d/yr today · 1 by 30 yrs out
Nearby sold comps map
Loading sold comps map…
Walkable amenities ~0.75 mi
Loading nearby amenities…
Taxation est. · year 1
- Rental income
- $17,856
- − Mortgage interest
- −$4,761
- − Property taxes
- −$1,197
- − Insurance
- −$425
- − Repairs & maintenance
- −$1,429
- − Management
- −$1,429
- − HOA
- −$7,320
- − Depreciation
- −$2,473
- Taxable loss
- −$1,177
- Est. tax savings @ 24.0%
- +$282
- After-tax cash flow
- $98/yr
For passive investors: Depreciation is non-cash, so a rental often shows a tax loss while cash-flowing — sheltering income. Rental losses are passive: they offset passive income freely, and up to $25,000/yr can offset ordinary (W-2) income if you actively participate and your MAGI is under $100k (phasing out to $0 by $150k); unused losses carry forward. On sale, claimed depreciation is recaptured at up to 25%, and gains may owe capital-gains tax (a 1031 exchange can defer both). Figures are a year-1 estimate at your 24.0% rate — not tax advice; consult a CPA.
Schools (NCES district)
- District
- Lehighton Area SD
- NCES district ID
- 4213500
- Math proficiency
- 32% ▼ -7.00%
- Reading proficiency
- 50% ▼ -11.00%
- Median HH income
- $51,115
- Composite
- 35.36/100
- National rank
- #4958
- State rank
- #336 of 539 in PA
Livability — Lehighton
- Score
- 77/100
- State rank
- #321
- US rank
- #2848
Category grades
Schools grade is shown separately in the Schools card above.
Census & demographics
- Population (ZIP)
- 19,121
Population outlook (Carbon County) Hauer SSP2
- Today (2025)
- 61,643 people
- By 2030
- 59,840 · -2.9%
- By 2040
- 55,413 · -10.1%
- By 2050
- 50,843 · -17.5%
- By 2075
- 43,326 · -29.7%
- By 2100
- 37,126 · -39.8%
Race, ethnicity, and origin ACS 2023
- Neighborhood character
- Predominantly White (94%)
- Race & ethnicity
- White 94% Two or more races 4% Hispanic / Latino 3%
- Common ancestry
- Romanian 6% Polish 5% Iranian 3%
- Foreign-born
- 2% · Canada, China
- Languages at home
- 96% English-only · Spanish 2% Russian/Polish/Slavic 1%
Political lean MEDSL · Carbon
- 2024 margin
- Solid R (+34.8) · D 32.2% · R 67.0%
- 2008→2024 swing
- -36.7pp toward R · 2008: 1.9pp · 2024: -34.8pp
- All cycles
- 2024: R+34.8 2020: R+32.0 2016: R+34.1 2012: R+6.9 2008: D+1.9
Not yet ingested
- Civics
- —
Market trends
- HPI YoY
- ▼ -69.77%
- Current HPI
- 187.4645
- Rent YoY
- —
- Metro
- —
- State GDP YoY
- ▲ 1.68%
- F500 in state
- 34
Industry mix (Fortune 500 HQ in PA)
| Industry | F500 HQs | Revenue |
|---|---|---|
| Healthcare | 2 | $309B |
|
||
| Insurance | 2 | $27B |
|
||
| Telecommunications / Media | 1 | $124B |
|
||
| Industrial Distribution | 1 | $22B |
|
||
| Financial Services | 1 | $20B |
|
||
| Chemicals / Materials | 1 | $18B |
|
||
Price history
1 event — show timeline
- 2026-05-26 Listed $85,000 GLVRMLS
Property tax history
+1.4%/yrLatest (2026): $1,197 · +0.8% YoY. Source: county tax records.
Cash-flow waterfall
monthlySold comps — $/sqft
last 12 mo · ≤1 miLoading sold comps…