7510 Yellowstone Blvd Unit 2H · New York, NY
Flood risk 10/10 · Severe
- FEMA flood zone
- X (unshaded)
- Chance of flooding over 30 yrs
- 0.99%
- Est. flood insurance / yr
- $507 – $1,088
Fire risk 1/10 · Minimal
- Est. fire insurance / yr
- $691 – $1,283
Heat risk 6/10 · Moderate
- Hot days now (above 99°F)
- 7 days/yr
- Hot days in 30 yrs
- 15 days/yr
Wind risk 6/10 · Moderate
- Chance of severe wind over 30 yrs
- 49.0%
Air-quality risk 5/10 · Moderate
- Unhealthy air days now
- 6 days/yr
- Unhealthy air days in 30 yrs
- 8 days/yr
Risk factors via First Street. Map © Google.
Why this score? — see what drove the C- grade
The composite is a weighted blend of 9 inputs, each scored 0–100. Each bar is that input's sub-score; the figure is the points it added to the 100-point composite (weight × sub-score).
- Cash flow +19.9/30.0
- ARV discount +7.5/15.0
- DSCR +6.3/10.0
- 1% rule +5.3/10.0
- Schools +5.0/10.0
- Livability +3.8/5.0
- Condition / age +3.8/5.0
- Rent growth +2.9/5.0
- Appreciation +0.0/10.0
$275,000
🖨 Deal sheet 📄 Offer letter ✓ Due diligence
Listing remarks
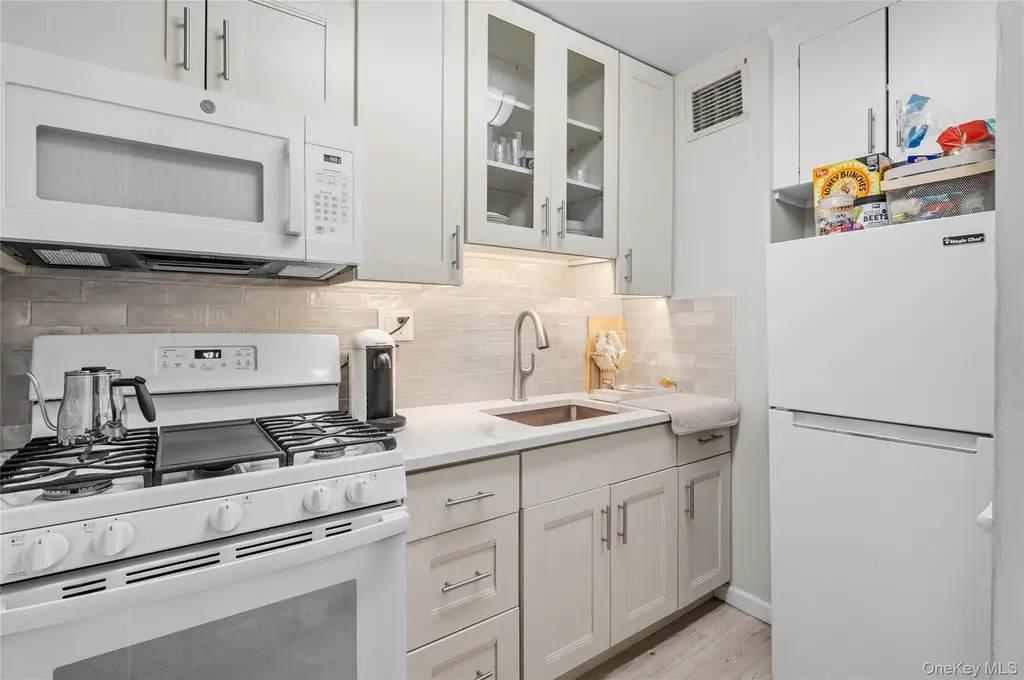
Beautiful and Extra Large 1 Bedroom Co Op Apartment. This Completely Updated Unit Features A Gorgeous Kitchen with new appliances, updated countertops and plenty of cabinet space. Stunning Full Bath, Spacious bedroom, Large Living Room & Dining Room. Gleaming Hardwood Floors, Plenty Of Closets, Large Windows and Updated Electric with new high hats. Many more Improvements Throughout this Bright, Sunny And Spacious Unit. Live in Super, Gym and Parking Garage In Building. Low Maintenance which Includes all utilities except electricity. Near All Transportation And Markets. Absolute Must See! It Is Priced To Sell And This One Will Not Last Long!
Key facts
- Garage
- Built 1956
- Listed 54 days
Property features AI
Exterior
- Parking: Has garage; Parking waitlist
- Utilities: Public sewer; Cable available; Electricity available; Natural gas connected; Phone available; Sewer connected; Public trash collection; Water connected
- Home design: Stock cooperative; Entry at level 2; One level unit; Building has 7 stories
- Construction: Brick exterior; Brick/mortar foundation
- Exterior features: Brick construction; Brick/mortar foundation; Not waterfront
Interior
- Kitchen: Convection oven; Gas oven; Gas range; Microwave; Refrigerator
- Bedrooms: Second-floor location
- Flooring: Hardwood
- Bathrooms: 1 full bathroom
- Heating & cooling: Natural gas heating; No cooling
- Interior features: Galley kitchen; His-and-hers closets; Natural woodwork; Pantry; Quartz/Quartzite counters; Storage; Oversized windows; No dogs allowed
- Laundry & utility: Common area laundry
Neighborhood map
What this means for you Summary
Snapshot
- This is a 1-bed/1.0-bath condo listed at $275k. Condition is rated good.
Deal economics
- At list price, monthly cash flow is $264 ($3k/yr) — positive.
- The deal already cash-flows at list — no discount required.
- Meets the 1% rule at list price ($3k rent vs $275k).
- Recommended offer: $267k (3.0% below list) — sets the bar for market timing.
- Cap rate 7.7% vs local median 2.6% in New York — top-decile yield for the area; either an underpriced asset or a hidden risk that comps aren't pricing in. Stress-test before assuming the spread holds.
Location & tenants
- Location reads 75/100 on livability (#268 in NY, #4,188 nationally) — a middle-class / working-renter tenant base. Strengths: amenities A+, commute A+, health & safety A; Watch: crime F, cost of living F.
- Market conditions: Rents rising (+1.7%/yr); 345 active listings in the ZIP; 40 comparable units currently listed for rent nearby; rentals at typical pace (median 19d on market — plan ~3-4 weeks tenant-placement turnaround); solid renter incomes; 5,302 units permitted in Queens County in 2024 (4,918 in 5+ unit buildings).
- This rent runs 37% of the median local income ($91k/yr) — at the standard rent-burdened threshold; future hikes will face affordability resistance.
Forward outlook
- Local home prices are declining (-3.0%/yr); year-one equity from $2k of loan paydown is wiped out by about $8k of value loss. Plan a longer hold.
- Queens County population projected at +16% by 2050 — long-run rental-demand tailwind backs the buy-and-hold thesis.
Negotiation context
- It's been on market 54 days — a 3% lower offer ($267k) is reasonable based on typical stale-listing flexibility.
Risks & watch-outs
- Watch-outs: flood insurance adds $66/mo; built in 1956 — expect roof / HVAC / electrical / plumbing capex.
- Climate carrying-cost: severe flood risk; major wind risk, 49% chance of damaging wind over 30y; extreme-heat days projected 7→15/yr by 2055 (HVAC capex compounding) — expect insurance premiums to compound above CPI over the hold.
Questions for the listing agent
- It's been on market 54 days. Have you received any prior offers? Is the seller open to a 3% concession, seller financing, or rate buy-down credit?
- Built in 1956 — when were the roof, HVAC, electrical panel, plumbing, and water heater last replaced?
- What's the actual annual flood-insurance premium (NFIP or private), and is the property in a SFHA with mandatory coverage?
- Any open or pending special assessments — roof, HVAC, plumbing, elevator, façade? What's the per-unit balance and payoff schedule, and is the seller paying it off at close or rolling it to the buyer?
- Is there a deadline driving the sale (1031 exchange, divorce, estate, relocation)? That informs how much negotiation room exists.
- Schools are B-rated — typically a magnet for longer-tenancy family renters. What's the average tenant stay here, and is there a school-zone premium baked into asking?
- Crime grade is F in this area — have there been break-ins, vandalism, or insurance claims at this property in the last 3 years? What carrier currently insures it and at what premium?
- What's the average days-on-market for RENTAL listings here right now (not sales)? A rising rental-DOM trend means longer vacancies and softer asking-rent achievability than the comps imply.
- What's the recent tenant-quality profile in this submarket — average credit score on applications, eviction rate, late-payment / NSF rate, and stable-employment percentage? A property-management company in the area should have these aggregated.
- How much new apartment / multifamily construction is in the pipeline within 1–3 miles? Heavy new supply (>2% of stock underway) typically softens rents 12–24 months out; light construction supports rent growth.
Investment metrics
- 1% rule
- 1.03% ✓
- Cap rate
- 7.73%
- Cash-on-cash
- 5.14%
- DSCR
- 1.23
- GRM
- 8.1
CMA / ARV
No comps found within radius.
Projected returns pro-forma
-3.0% appreciation · 1.74% rent growth · sell at horizon
- IRR
- -11.3%
- Equity multiple
- 0.59×
- Total profit
- $-31,226
- Equity at exit
- $41,003
- IRR
- -4.0%
- Equity multiple
- 0.75×
- Total profit
- $-19,378
- Equity at exit
- $23,777
Cash invested: $77,000 (down + closing). Projections, not guarantees.
Landlord ↔ Tenant lean methodology
- Overall (CITY)
- 0 Strongly Tenant-Friendly
- State New York
- 15 Strongly Tenant-Friendly · D+10
- County
- — inherits STATE
- City New York
- 0 Strongly Tenant-Friendly · D+34
ZIP-level market 11374
- Rents YoY
- 1.7%
- Active inventory
- 345
- Price-to-rent
- 8.1×
Monthly cashflow live
- Estimated rent
- $2,823 high interval (Pro) →
- Mortgage (P&I)
- −$1,442
- Tax est. 1.5%
- −$344 /mo · $4,125/yr
- Insurance
- −$115
- Flood insurance flood zone
- −$66 /mo · $798/yr
- HOA
- −$0
- Vacancy / Maint / Mgmt
- −$593
- Net cashflow
- $264
Break-even live
UW: 25.0% down · 7.5% · 30yr · 1.5% tax · 5.0% vac · 8.0% maint · 8.0% mgmt
Financing live
Cash to close
- Down payment
- $68,750
- Closing costs
- $8,250
- Reserves months
- —
- Total cash needed
- —
Loan-product check · same deal, 3 products live
Conventional
25% down · 7.5% · 30yr
- Down + closing
- —
- Monthly P&I
- —
- Monthly cashflow
- —
- DSCR
- —
- Eligible?
- —
Personal DTI + credit; lowest rate.
DSCR
20% down · 8.5% · 30yr
- Down + closing
- —
- Monthly P&I
- —
- Monthly cashflow
- —
- DSCR
- —
- Eligible?
- —
No personal income docs; deal must DSCR.
Hard money
10% down · 12.0% · 12mo
- Down + closing
- —
- Monthly P&I
- —
- Monthly cashflow
- —
- DSCR
- —
- Eligible?
- —
Short-term bridge; refi at stabilization.
Rent comps 40 comps
| Address | Beds | Baths | Sqft | Rent | $/sqft | DOM | Units | Dist |
|---|---|---|---|---|---|---|---|---|
| 6750 Thornton Pl Unit 2U Forest Hills, NY | — | 1.0 | 550 | $1,900 | $3.45 | 7d | 1 | 0.38mi |
| 6725 Dartmouth St Unit 3L Forest Hills, NY | 2.0 | 1.0 | 800 | $2,700 | $3.38 | 24d | 1 | 0.48mi |
| 6739 Clyde St Ph -H Forest Hills, NY | 2.0 | 2.0 | 1100 | $4,100 | $3.73 | 24d | 1 | 0.53mi |
| 6615 Thornton Pl Rego Park, NY | 1.0 | 1.0 | 700 | $2,672 | $3.82 | 4d | 3 | 0.57mi |
| 63-127 Fitchett St Unit 1FL Rego Park, NY | 2.0 | 1.0 | 1100 | $3,800 | $3.45 | 1d | 1 | 0.61mi |
| 63127 Fitchett St Rego Park, NY | 1.0 | 1.0 | 900 | $2,800 | $3.11 | 1d | 1 | 0.61mi |
| 66-01 Burns St Apt 3v Rego Park, NY | 1.0 | 1.0 | 820 | $2,300 | $2.80 | 20d | 1 | 0.63mi |
| 67-13 Austin St Unit 2A Flushing, NY | 1.0 | 1.0 | 600 | $2,595 | $4.33 | 16d | 1 | 0.66mi |
| 67-19 Austin St Unit 4C Flushing, NY | 2.0 | 1.0 | 800 | $3,500 | $4.38 | 13d | 1 | 0.66mi |
| 6620 Wetherole St Rego Park, NY | 1.0–2.0 | 1.0–2.0 | 700 | $2,400 | $3.43 | 24d | 2 | 0.71mi |
| 10460 Queens Blvd Forest Hills, NY | 1.0–2.0 | 1.0 | 916 | $3,350 | $3.66 | 5d | 2 | 0.76mi |
| 9915 Ascan Ave Forest Hills, NY | 2.0 | 1.0 | 600 | $2,700 | $4.50 | 24d | 1 | 0.76mi |
| 10010 67th Rd Unit 6L Forest Hills, NY | 1.0 | 1.0 | 845 | $2,700 | $3.20 | 21d | 1 | 0.79mi |
| 10620 70th Ave Unit 6B Forest Hills, NY | 1.0 | 1.0 | 765 | $3,600 | $4.71 | 24d | 1 | 0.80mi |
| 150 Greenway Ter Forest Hills, NY | 1.0–2.0 | 1.0 | 937 | $3,825 | $4.08 | 20d | 2 | 0.81mi |
| 78-68 84th St Unit 2 Flushing, NY | 2.0 | 1.0 | 800 | $3,500 | $4.38 | 24d | 1 | 0.84mi |
| 10740 70th Rd Unit 7F Forest Hills, NY | 1.0 | 1.0 | 750 | $2,650 | $3.53 | 24d | 1 | 0.86mi |
| 9876 Queens Blvd Unit 3A Rego Park, NY | 1.0 | 1.0 | 820 | $2,900 | $3.54 | 24d | 1 | 0.86mi |
| 97-12 65th Rd Apt 5D Rego Park, NY | 1.0 | 1.0 | 800 | $3,395 | $4.24 | 5d | 1 | 0.89mi |
| 97-12 65th Rd Unit 4-C Rego Park, NY | 1.0 | 1.0 | 650 | $3,350 | $5.15 | 5d | 1 | 0.91mi |
| 10025 Queens Blvd Unit 3M Forest Hills, NY | 2.0 | 1.0 | 925 | $2,900 | $3.14 | 24d | 1 | 0.91mi |
| 98-81 Queens Blvd Unit 15E Rego Park, NY | 1.0 | 1.0 | 700 | $3,335 | $4.76 | 5d | 1 | 0.91mi |
| 98-81 Queens Blvd Unit 14K Rego Park, NY | 2.0 | 2.0 | 950 | $4,490 | $4.73 | 12d | 1 | 0.91mi |
| 10240 67th Dr Unit 1C Forest Hills, NY | 1.0 | 1.5 | 780 | $2,500 | $3.21 | 24d | 1 | 0.94mi |
| 10825 72nd Ave Forest Hills, NY | 1.0–2.0 | 1.0 | 700 | $3,500 | $5.00 | 4d | 2 | 0.94mi |
| 10919 72nd Rd Unit 6F Forest Hills, NY | 1.0 | 1.0 | 696 | $3,485 | $5.01 | 11d | 1 | 0.97mi |
| 6945 108th St Unit 3F Forest Hills, NY | 2.0 | 1.0 | 900 | $3,600 | $4.00 | 6d | 1 | 0.97mi |
| 102-45 67th Rd Forest Hills, NY | 1.0 | 1.0 | 700 | $2,350 | $3.36 | 18d | 1 | 0.97mi |
| 6771 Yellowstone Blvd Unit 2R Forest Hills, NY | 1.0 | 1.0 | 700 | $2,550 | $3.64 | 24d | 1 | 0.99mi |
| 102-55 67th Rd Unit 2V Forest Hills, NY | 1.0 | 1.0 | 633 | $2,350 | $3.71 | 19d | 1 | 1.00mi |
| 6347 Booth St Unit 3C Rego Park, NY | 1.0 | 1.0 | 700 | $3,400 | $4.86 | 24d | 1 | 1.00mi |
| 11007 73rd Rd Forest Hills, NY | 1.0 | 1.0 | 950 | $1,800 | $1.89 | 18d | 1 | 1.04mi |
| 9825 64th Rd Unit 8F Rego Park, NY | 2.0 | 1.0 | 850 | $2,400 | $2.82 | 1d | 1 | 1.05mi |
| 9725 64th Ave Rego Park, NY | 1.0 | 1.0 | 760 | $1,800 | $2.37 | 18d | 1 | 1.05mi |
| 9810 64th Ave Unit 3A Rego Park, NY | 1.0 | 1.0 | 850 | $2,450 | $2.88 | 2d | 1 | 1.06mi |
| 9810 64th Ave Rego Park, NY | 1.0 | 1.0 | 825 | $2,125 | $2.58 | 17d | 2 | 1.06mi |
| 11019 72nd Rd Unit 1B Forest Hills, NY | 1.0 | 1.0 | 750 | $3,200 | $4.27 | 13d | 1 | 1.06mi |
| 105-25 67th Rd Forest Hills, NY | 1.0 | 1.0 | 750 | $1,800 | $2.40 | 18d | 1 | 1.08mi |
| 102-39 66th Ave Unit 1 Flushing, NY | 2.0 | 1.0 | 981 | $3,000 | $3.06 | 1d | 1 | 1.11mi |
| 7540 Austin St Unit 4HR Forest Hills, NY | 1.0 | 1.0 | 841 | $2,990 | $3.56 | 24d | 1 | 1.14mi |
HOA detail condo
- Monthly dues
- $0 · $0/yr
- Likely covers
- electricgym
- Assessments
- None detected in remarks — confirm with the listing agent.
Listing history 14 events
-
2026-06-18days on market $275,000 Active 54 DOM
-
2026-06-17days on market $275,000 Active 53 DOM
-
2026-06-16days on market $275,000 Active 52 DOM
-
2026-06-15days on market $275,000 Active 51 DOM
-
2026-06-13days on market $275,000 Active 49 DOM
-
2026-06-10days on market $275,000 Active 45 DOM
-
2026-06-08days on market $275,000 Active 44 DOM
-
2026-06-08days on market $275,000 Active 43 DOM
-
2026-06-04days on market $275,000 Active 40 DOM
-
2026-06-03days on market $275,000 Active 39 DOM
-
2026-06-01days on market $275,000 Active 37 DOM
-
2026-05-31days on market $275,000 Active 36 DOM
-
2026-05-06price $275,000
-
2026-04-24$267,000 Active
ⓘ Source: listings_history table (triggers on properties + properties_extension) + one-shot
backfill from property_details.listing_events for pre-trigger history.
Climate risk First Street
- Flood 10/10 Extreme FEMA zone X (unshaded) · 99% chance over 30 yrs
- Wildfire 1/10 Low
- Heat 6/10 Major 7 d/yr ≥99°F today · 15 d/yr by 30 yrs out
- Wind 6/10 Major 49% chance of damaging wind over 30 yrs
- Air quality 5/10 Major 6 unhealthy d/yr today · 8 by 30 yrs out
Nearby sold comps map
Loading sold comps map…
Walkable amenities ~0.75 mi
Loading nearby amenities…
Taxation est. · year 1
- Rental income
- $33,881
- − Mortgage interest
- −$15,404
- − Property taxes
- −$4,125
- − Insurance
- −$2,172
- − Repairs & maintenance
- −$2,710
- − Management
- −$2,710
- − Depreciation
- −$8,000
- Taxable loss
- −$1,242
- Est. tax savings @ 24.0%
- +$298
- After-tax cash flow
- $3,461/yr
For passive investors: Depreciation is non-cash, so a rental often shows a tax loss while cash-flowing — sheltering income. Rental losses are passive: they offset passive income freely, and up to $25,000/yr can offset ordinary (W-2) income if you actively participate and your MAGI is under $100k (phasing out to $0 by $150k); unused losses carry forward. On sale, claimed depreciation is recaptured at up to 25%, and gains may owe capital-gains tax (a 1031 exchange can defer both). Figures are a year-1 estimate at your 24.0% rate — not tax advice; consult a CPA.
Condition & rehab AI · 13 photos
This fully updated 1-bedroom condo is move-in ready with a fresh interior and modern amenities.
Value-add opportunities
- Both landscaping — improves curb appeal and adds value
- Both smart home integration — enhances convenience and adds value
- Both smart thermostat — saves energy and adds value
Renovation cost estimate screening
Value-add ROI direction
- Both landscaping — improves curb appeal and adds value ↑
- Both smart home integration — enhances convenience and adds value ↑
- Both smart thermostat — saves energy and adds value ↑
ⓘ Cost ranges are severity-bucket heuristics (US national rule-of-thumb). Get contractor quotes + a written scope before underwriting a rehab budget.
Schools (NCES district)
No district data.
Livability — New York
- Score
- 75/100
- State rank
- #268
- US rank
- #4188
Category grades
Schools grade is shown separately in the Schools card above.
Census & demographics
- Census place
- New York, NY
- County
- Queens County · 1,914,869 people
- City population
- 7,731,280
- Metro
- New York-Newark-Jersey City, NY-NJ-PA
- Population (ZIP)
- 46,989
- Household income
- $90,631
- Rent vs Own
- Severe rent burden
- 3149.0
Population outlook (Queens County) Hauer SSP2
- Today (2025)
- 2,546,320 people
- By 2030
- 2,643,059 · +3.8%
- By 2040
- 2,815,563 · +10.6%
- By 2050
- 2,944,423 · +15.6%
- By 2075
- 3,123,338 · +22.7%
- By 2100
- 3,098,688 · +21.7%
Race, ethnicity, and origin ACS 2023
- Neighborhood character
- Highly diverse neighborhood (Simpson 0.72)
- Race & ethnicity
- White 38% Asian 29% Hispanic / Latino 22% Two or more races 13% Black 4%
- Hispanic origin (detail)
- Mexican 1% Puerto Rican 3% Dominican 3%
- Common ancestry
- Scotch-Irish 6% Romanian 2% Subsaharan African 1%
- Foreign-born
- 54% · Canada, China, Jamaica
- Languages at home
- 28% English-only · Spanish 18% Russian/Polish/Slavic 15% Chinese 13%
Political lean MEDSL · Queens
- 2024 margin
- Strong D (+24.6) · D 62.3% · R 37.7%
- 2008→2024 swing
- -26.2pp toward R · 2008: 50.8pp · 2024: 24.6pp
- All cycles
- 2024: D+24.6 2020: D+45.2 2016: D+53.4 2012: D+58.5 2008: D+50.8
Not yet ingested
- Civics
- —
Market trends
- HPI YoY
- ▼ -163.20%
- Current HPI
- 207.1869
- Rent YoY
- ▲ 1.74%
- Metro
- New York-Newark-Jersey City, NY-NJ-PA
- State GDP YoY
- ▲ 2.60%
- F500 in state
- 92
Industry mix (Fortune 500 HQ in NY)
| Industry | F500 HQs | Revenue |
|---|---|---|
| Financial Services | 10 | $950B |
|
||
| Consumer Goods | 9 | $162B |
|
||
| Insurance | 4 | $225B |
|
||
| Telecommunications | 2 | $144B |
|
||
| Pharmaceuticals | 2 | $112B |
|
||
| Media / Entertainment | 2 | $69B |
|
||
Price history
+3.0% since first listed2 events — show timeline
- 2026-05-06 Price Changed $275,000 OneKey® MLS as Distributed by MLS Grid
- 2026-04-24 Listed $267,000 OneKey® MLS as Distributed by MLS Grid
Cash-flow waterfall
monthlySold comps — $/sqft
last 12 mo · ≤1 miLoading sold comps…