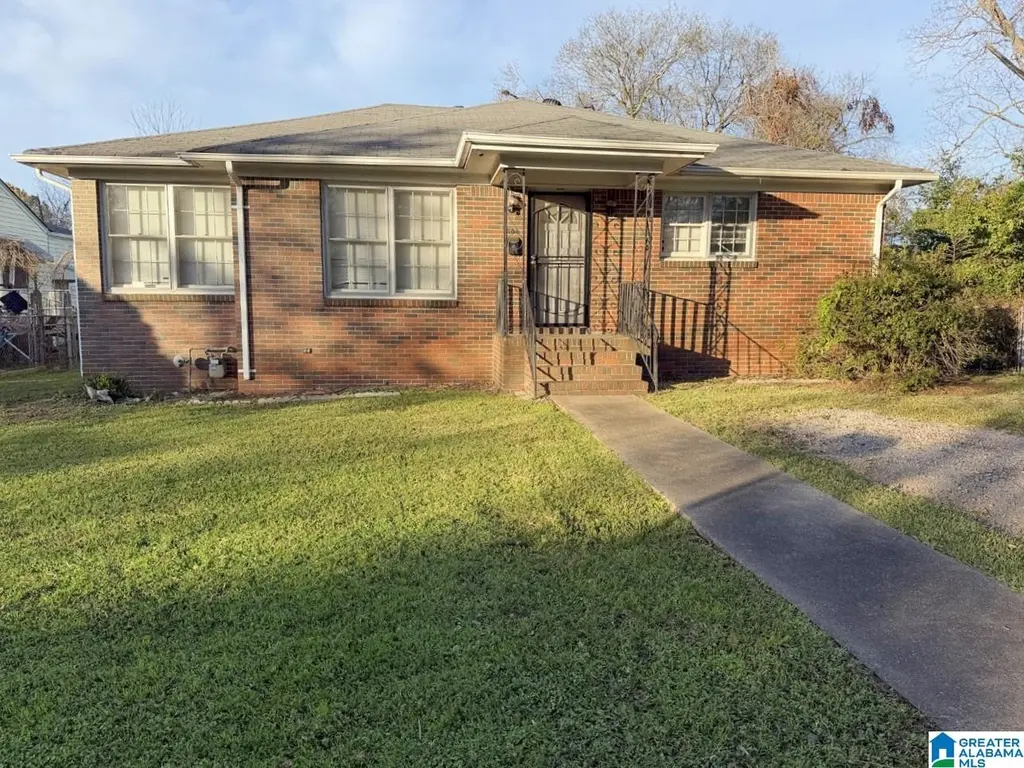
604 40th Pl · Fairfield, AL
Flood risk 1/10 · Minimal
- FEMA flood zone
- X (unshaded)
- Chance of flooding over 30 yrs
- 0.0%
- Est. flood insurance / yr
- $507 – $1,088
Fire risk 1/10 · Minimal
- Est. fire insurance / yr
- $916 – $1,700
Heat risk 7/10 · Major
- Hot days now (above 107°F)
- 7 days/yr
- Hot days in 30 yrs
- 20 days/yr
Wind risk 6/10 · Moderate
- Chance of severe wind over 30 yrs
- 27.0%
Air-quality risk 4/10 · Minor
- Unhealthy air days now
- 5 days/yr
- Unhealthy air days in 30 yrs
- 5 days/yr
Risk factors via First Street. Map © Google.
Why this score? — see what drove the C grade
The composite is a weighted blend of 9 inputs, each scored 0–100. Each bar is that input's sub-score; the figure is the points it added to the 100-point composite (weight × sub-score).
- Cash flow +30.0/30.0
- 1% rule +10.0/10.0
- DSCR +10.0/10.0
- Livability +3.2/5.0
- Rent growth +2.5/5.0
- Condition / age +2.5/5.0
- Schools +0.7/10.0
- ARV discount +0.0/15.0
- Appreciation +0.0/10.0
$74,900
🖨 Deal sheet (PDF) 📄 Offer letter ✓ Due diligence
Listing remarks
This three-bedroom, two-bathroom property presents a compelling investment opportunity with solid structural foundation. Within walking distance of Fairfield High Preparatory School. The generous lot provides excellent potential with a two car carport, block building workshop, and metal storage building in the backyard. This property has had several updates in the past and with a few more updates, this residence could be transformed into a desirable property. The established neighborhood location offers convenience and accessibility, making it an attractive prospect for investors seeking renovation projects with strong upside potential. Schedule your showing today to discover this property
Key facts
- Two car carport
- 9,147 sq ft lot
- 2 parking spots
Tags
Property features AI
Finance
- Other: Lot size about 0.21 acre; Subdivision: Fairfield
- Financial info: Down payment assistance available
- HOA & community: Garbage fee collected quarterly
Exterior
- Parking: Detached parking; Driveway parking; 2 carport spaces
- Security: No security features listed
- Utilities: Public water; Connected sewer; Electric water heater; Internet available (Spectrum)
- Home design: Existing construction; 3-side brick exterior; Crawl space foundation
- Construction: 3-side brick construction; Crawl space foundation
- Exterior features: Open deck; Storage building; No pool, patio, garden/patio, or waterfront
Interior
- Kitchen: Laminate countertops
- Bedrooms: Multiple bedrooms on main level (bedrooms listed at level 1)
- Flooring: Vinyl flooring
- Bathrooms: Two full bathrooms; Tub/shower combo
- Heating & cooling: No heat; No air conditioning
- Interior features: Ceilings: Other (see remarks); No additional interior features listed
- Laundry & utility: Laundry on main level; Washer hookup; Electric dryer hookup; Laundry located in a closet
Neighborhood map
What this means for you Summary
Snapshot
- This is a 3-bed/2.0-bath single-family listed at $75k.
Deal economics
- At list price, monthly cash flow is $368 ($4k/yr) — positive.
- The deal already cash-flows at list — no discount required.
- Meets the 1% rule at list price ($1k rent vs $75k).
- Recommended offer: $73k (3.0% below list) — sets the bar for market timing.
- Cap rate 12.2% vs local median 10.2% in Fairfield — meaningfully above typical; check what's discounted (condition, days-on-market, listing class) to confirm the premium yield is real.
Location & tenants
- Location reads 64/100 on livability (#160 in AL) — a middle-class / working-renter tenant base. Strengths: commute A+, cost of living A+, housing A+; Watch: crime D+, amenities F, employment F.
- Fairfield City (suburban): math 2% / reading 15% proficiency, ranked #125 of 129 in AL (top 97%) — low school quality limits family demand, transient renter base, plan for 1-2y turnover; 84% free/reduced lunch — lower-income household profile, screen leases tightly.
- Zoned schools: Glen Oaks Elementary School (math 2% / reading 17%, grade F, #568 of 627 statewide, top 94%, 324 students, 70% FRL); C J Donald Middle School (math 2% / reading 17%, grade F, #227 of 257 statewide, top 90%, 332 students, 85% FRL).
- Market conditions: 51 active listings in the ZIP; 40 comparable units currently listed for rent nearby; rentals lingering (median 46d on market — plan ~5-8 weeks vacancy on turnover, expect pricing pressure); 60% of comp listings sitting > 30 days — soft ceiling on asking rent; 2,114 units permitted in Jefferson County in 2024 (556 in 5+ unit buildings).
Forward outlook
- Local home prices are declining (-3.0%/yr); year-one equity from $518 of loan paydown is wiped out by about $2k of value loss. Plan a longer hold.
- Jefferson County population projected to shrink 4% by 2050 — rents likely to lag national; underwrite the cash flow, not the appreciation.
- At projected returns (-3.0% appreciation + 3.0% rent growth), your $21k cash investment doubles in ~6 years — after that, you're playing with house money.
Negotiation context
- It's been on market 60 days — a 3% lower offer ($73k) is reasonable based on typical stale-listing flexibility.
Risks & watch-outs
- Watch-outs: built in 1945 — expect roof / HVAC / electrical / plumbing capex.
- Climate carrying-cost: major wind risk, 27% chance of damaging wind over 30y; extreme-heat days projected 7→20/yr by 2055 (HVAC capex compounding) — expect insurance premiums to compound above CPI over the hold.
Questions for the listing agent
- It's been on market 60 days. Have you received any prior offers? Is the seller open to a 3% concession, seller financing, or rate buy-down credit?
- Built in 1945 — when were the roof, HVAC, electrical panel, plumbing, and water heater last replaced?
- Is there a deadline driving the sale (1031 exchange, divorce, estate, relocation)? That informs how much negotiation room exists.
- Schools are F-rated, which usually means shorter tenancies and higher turnover. Who's the typical renter profile here, and what's been the actual vacancy rate?
- Crime grade is D in this area — have there been break-ins, vandalism, or insurance claims at this property in the last 3 years? What carrier currently insures it and at what premium?
- What's the average days-on-market for RENTAL listings here right now (not sales)? A rising rental-DOM trend means longer vacancies and softer asking-rent achievability than the comps imply.
- What's the recent tenant-quality profile in this submarket — average credit score on applications, eviction rate, late-payment / NSF rate, and stable-employment percentage? A property-management company in the area should have these aggregated.
- How much new for-sale + rental construction is in the pipeline within 1–3 miles? Heavy new supply typically softens prices + rents 12–24 months out; constrained supply supports both.
Investment metrics
- 1% rule
- 1.59% ✓
- Cap rate
- 12.19%
- Cash-on-cash
- 21.07%
- DSCR
- 1.94
- GRM
- 5.2
CMA / ARV
- ARV (median comp)
- $55,416
- List price
- $74,900
- Delta
- 35.16%
- Verdict
- OVERPRICED
- Comps
- 20 within 1.0 mi
Show comp detail 12 sales within ~0.75 mi
| Address | Dist | Beds/Ba | Sqft | Sold | Price | $/sf | Match |
|---|---|---|---|---|---|---|---|
| 521 41st St | 0.08mi | 3/1.0 | 1,800 (+6%) | 8mo | $70,000 | $39 | 76 |
| 920 39th St | 0.39mi | 3/2.0 | 1,636 (-3%) | 2mo | $145,000 | $89 | 75 |
| 732 41st St | 0.11mi | 3/1.0 | 1,584 (-6%) | 11mo | $50,000 | $32 | 71 |
| 601 41st St | 0.05mi | 3/1.0 | 1,442 (-15%) | 3mo | $52,250 | $36 | 66 |
| 728 39th Pl | 0.18mi | 2/1.0 (-1) | 1,576 (-7%) | 16mo | $42,000 | $27 | 58 |
| 949 44th St | 0.52mi | 3/2.5 | 1,595 (-6%) | 9mo | $94,000 | $59 | 57 |
| 925 Valley Road Pl | 0.37mi | 3/3.0 | 1,813 (+7%) | 17mo | $98,400 | $54 | 53 |
| 1109 40th St | 0.54mi | 4/1.0 (+1) | 1,556 (-8%) | 5mo | $90,000 | $58 | 48 |
| 1301 Frisco St | 0.69mi | 3/1.0 | 1,650 (-3%) | 16mo | $105,894 | $64 | 46 |
| 1023 46th St | 0.68mi | 3/2.0 | 1,920 (+13%) | 0mo | $75,000 | $39 | 46 |
| 513 Oak Pl | 0.40mi | 3/1.0 | 1,440 (-15%) | 9mo | $30,000 | $21 | 45 |
| 4517 Debardeleben Ave | 0.34mi | 3/1.0 | 1,446 (-15%) | 13mo | $11,500 | $8 | 45 |
Match score weights: distance 35% · size 25% · config 20% · recency 20%. Top-matched comps best support the ARV.
Projected returns pro-forma
-3.0% appreciation · 3.0% rent growth · sell at horizon
- IRR
- 13.6%
- Equity multiple
- 1.54×
- Total profit
- $11,367
- Equity at exit
- $11,168
- IRR
- 22.4%
- Equity multiple
- 2.92×
- Total profit
- $40,306
- Equity at exit
- $6,476
Cash invested: $20,972 (down + closing). Projections, not guarantees.
Landlord ↔ Tenant lean methodology
- Overall (STATE)
- 90 Strongly Landlord-Friendly
- State Alabama
- 90 Strongly Landlord-Friendly · R+15
- County
- — inherits STATE
- City
- — inherits STATE
ZIP-level market 35064
- Home prices YoY
- -28.8%
- Active inventory
- 51
- Price-to-rent
- 5.2×
Monthly cashflow live
- Estimated rent
- $1,191 high interval (Pro) →
- Mortgage (P&I)
- −$393
- Tax from tax record
- −$149 /mo · $1,787/yr
- Insurance
- −$31
- HOA
- −$0
- Vacancy / Maint / Mgmt
- −$250
- Net cashflow
- $368
Break-even live
Sensitivity live
| Price | -10% $411 | -5% $389 | +0% $368 | +5% $347 | +10% $326 |
|---|---|---|---|---|---|
| Rent | -10% $274 | -5% $321 | +0% $368 | +5% $415 | +10% $462 |
| Rate | -1.0pp $406 | -0.5pp $387 | base $368 | +0.5pp $349 | +1.0pp $329 |
UW: 25.0% down · 7.5% · 30yr · 1.5% tax · 5.0% vac · 8.0% maint · 8.0% mgmt
Financing live
Cash to close
- Down payment
- $18,725
- Closing costs
- $2,247
- Reserves months
- —
- Total cash needed
- —
Loan-product check · same deal, 3 products live
Conventional
25% down · 7.5% · 30yr
- Down + closing
- —
- Monthly P&I
- —
- Monthly cashflow
- —
- DSCR
- —
- Eligible?
- —
Personal DTI + credit; lowest rate.
DSCR
20% down · 8.5% · 30yr
- Down + closing
- —
- Monthly P&I
- —
- Monthly cashflow
- —
- DSCR
- —
- Eligible?
- —
No personal income docs; deal must DSCR.
Hard money
10% down · 12.0% · 12mo
- Down + closing
- —
- Monthly P&I
- —
- Monthly cashflow
- —
- DSCR
- —
- Eligible?
- —
Short-term bridge; refi at stabilization.
Rent comps 40 comps
| Address | Beds | Baths | Sqft | Rent | $/sqft | DOM | Units | Dist |
|---|---|---|---|---|---|---|---|---|
| 521 41st St Fairfield, AL | 4.0 | 2.0 | 1800 | $1,300 | $0.72 | 45d | 1 | 0.07mi |
| 518 41st St Fairfield, AL | 3.0 | 2.0 | 1095 | $1,200 | $1.10 | 45d | 1 | 0.08mi |
| 728 41st St Fairfield, AL | 3.0 | 1.0 | 1316 | $1,100 | $0.84 | 45d | 1 | 0.12mi |
| 1309 41st St Fairfield, AL | 3.0 | 1.0 | 1070 | $1,200 | $1.12 | 45d | 1 | 0.30mi |
| 5001 Farrell Ave Fairfield, AL | 2.0 | 1.0 | 1218 | $995 | $0.82 | 45d | 1 | 0.32mi |
| 3517 Avenue F Birmingham, AL | 3.0 | 2.0 | 1155 | $1,200 | $1.04 | 45d | 1 | 0.33mi |
| 518 Oak Pl Fairfield, AL | 3.0 | 1.0 | 1236 | $875 | $0.71 | 21d | 1 | 0.40mi |
| 513 Oak Pl Fairfield, AL | 4.0 | 2.0 | 1440 | $1,300 | $0.90 | 25d | 1 | 0.42mi |
| 813 46th St Fairfield, AL | 2.0 | 1.0 | 1100 | $825 | $0.75 | 12d | 1 | 0.50mi |
| 920 47th Street Ensley Birmingham, AL | 3.0 | 1.0 | 1070 | $895 | $0.84 | 5d | 1 | 0.59mi |
| 3201 Avenue E Birmingham, AL | 3.0 | 1.0 | 1056 | $925 | $0.88 | 45d | 1 | 0.59mi |
| 304 52nd St Fairfield, AL | 4.0 | 2.0 | 1355 | $1,000 | $0.74 | 45d | 1 | 0.62mi |
| 3100 Avenue J Birmingham, AL | 3.0 | 1.0 | 1409 | $1,000 | $0.71 | 12d | 1 | 0.68mi |
| 410 54th St Fairfield, AL | 2.0 | 1.0 | 1068 | $700 | $0.66 | 4d | 1 | 0.69mi |
| 328 54th St Unit B Fairfield, AL | 2.0 | 1.0 | 1570 | $750 | $0.48 | 45d | 1 | 0.71mi |
| 1232 Frisco St Birmingham, AL | 4.0 | 2.0 | 1332 | $1,295 | $0.97 | 3d | 1 | 0.71mi |
| 1226 Frisco St Birmingham, AL | 4.0 | 2.0 | 1232 | $1,245 | $1.01 | 13d | 1 | 0.72mi |
| 1312 Gulfport St Birmingham, AL | 3.0 | 1.5 | 1376 | $1,100 | $0.80 | 45d | 1 | 0.74mi |
| 1300 Gulfport St Birmingham, AL | 3.0 | 2.0 | 1778 | $1,200 | $0.67 | 45d | 1 | 0.75mi |
| 2908 Avenue I Unit I Ensley, AL | 3.0 | 1.0 | 1383 | $1,025 | $0.74 | 25d | 1 | 0.77mi |
| 1037 47th Street Ensley Unit ENSLEY Birmingham, AL | 3.0 | 2.0 | 1299 | $1,000 | $0.77 | 45d | 1 | 0.78mi |
| 5219 Court G Unit G Fairfield, AL | 3.0 | 1.0 | 1140 | $950 | $0.83 | 25d | 1 | 0.81mi |
| 1306 35th Street Ensley Birmingham, AL | 3.0 | 2.0 | 1100 | $1,173 | $1.07 | 5d | 1 | 0.82mi |
| 829 51st Street Ensley Birmingham, AL | 3.0 | 1.0 | 1203 | $1,340 | $1.11 | 5d | 1 | 0.83mi |
| 1301 32nd Street Ensley Birmingham, AL | 3.0 | 1.0 | 1200 | $975 | $0.81 | 45d | 1 | 0.83mi |
| 1112 47th St W Birmingham, AL | 2.0 | 1.0 | 1166 | $975 | $0.84 | 45d | 1 | 0.83mi |
| 1313 Pike Rd Birmingham, AL | 3.0 | 1.0 | 1437 | $975 | $0.68 | 45d | 1 | 0.85mi |
| 5300 Avenue I Birmingham, AL | 4.0 | 2.0 | 1360 | $1,500 | $1.10 | 3d | 1 | 0.87mi |
| 2722 Avenue I Unit I Ensley, AL | 4.0 | 1.0 | 1578 | $1,000 | $0.63 | 45d | 1 | 0.88mi |
| 5406 Court G Unit G Fairfield, AL | 3.0 | 2.0 | 1449 | $1,199 | $0.83 | 13d | 1 | 0.89mi |
| 2711 Avenue E Birmingham, AL | 2.0 | 1.0 | 1560 | $800 | $0.51 | 45d | 1 | 0.90mi |
| 1417 34th Street Ensley Birmingham, AL | 3.0 | 1.0 | 1103 | $1,025 | $0.93 | 45d | 1 | 0.93mi |
| 5316 Court I Birmingham, AL | 3.0 | 2.0 | 1284 | $1,200 | $0.93 | 45d | 1 | 0.93mi |
| 1420 Warrior Rd Birmingham, AL | 3.0 | 1.0 | 1061 | $1,050 | $0.99 | 45d | 1 | 0.93mi |
| 5503 Myron Massey Blvd Fairfield, AL | 3.0 | 2.0 | 1119 | $1,200 | $1.07 | 45d | 1 | 0.94mi |
| 1345 46th Street Ensley Unit ENSLEY Birmingham, AL | 3.0 | 2.0 | 1617 | $1,175 | $0.73 | 5d | 1 | 0.97mi |
| 1410 46th Street Ensley Unit ENSLEY Birmingham, AL | 3.0 | 1.0 | 1200 | $1,000 | $0.83 | 45d | 1 | 1.00mi |
| 1436 44th Street Ensley Unit ENSLEY Birmingham, AL | 4.0 | 2.0 | 1435 | $1,495 | $1.04 | 3d | 1 | 1.01mi |
| 5722 Terrace Ave Fairfield, AL | 4.0 | 2.0 | 1548 | $1,495 | $0.97 | 45d | 1 | 1.02mi |
| 209 58th St Fairfield, AL | 3.0 | 2.0 | 1468 | $1,200 | $0.82 | 45d | 1 | 1.04mi |
Listing history 20 events
-
2026-06-22days on market $74,900 Active 60 DOM
-
2026-06-18days on market $74,900 Active 57 DOM
-
2026-06-17days on market $74,900 Active 56 DOM
-
2026-06-16days on market $74,900 Active 55 DOM
-
2026-06-15days on market $74,900 Active 54 DOM
-
2026-06-13days on market $74,900 Active 52 DOM
-
2026-06-10days on market $74,900 Active 49 DOM
-
2026-06-09days on market $74,900 Active 48 DOM
-
2026-06-08days on market $74,900 Active 47 DOM
-
2026-06-07days on market $74,900 Active 46 DOM
-
2026-06-03days on market $74,900 Active 42 DOM
-
2026-06-02days on market $74,900 Active 41 DOM
-
2026-06-01days on market $74,900 Active 40 DOM
-
2026-05-31days on market $74,900 Active 39 DOM
-
2026-04-22$74,900 Active 730-char remark
-
2025-12-19soldstatus $951,400
-
2022-02-24price $825
-
2018-10-25soldstatus $33,500
-
2017-07-21price $29,900
-
1989-04-26soldstatus $39,700
ⓘ Source: listings_history table (triggers on properties + properties_extension) + one-shot
backfill from property_details.listing_events for pre-trigger history.
Tax reassessment forecast AL · Resets to sale price
- Current annual tax
- $1,787 · $149/mo
- Projected year-2 tax
- $1,787 · $149/mo
- Expected delta
- $0/yr ($0/mo · 0.0%)
ⓘ Screening estimate from a state-policy table — verify with the county assessor before closing.
Climate risk First Street
- Flood 1/10 Low FEMA zone X (unshaded) · 0% chance over 30 yrs
- Wildfire 1/10 Low
- Heat 7/10 Severe 7 d/yr ≥107°F today · 20 d/yr by 30 yrs out
- Wind 6/10 Major 27% chance of damaging wind over 30 yrs
- Air quality 4/10 Moderate 5 unhealthy d/yr today · 5 by 30 yrs out
Nearby sold comps map
Loading sold comps map…
Walkable amenities ~0.75 mi
Loading nearby amenities…
Taxation est. · year 1
- Rental income
- $14,295
- − Mortgage interest
- −$4,196
- − Property taxes
- −$1,787
- − Insurance
- −$374
- − Repairs & maintenance
- −$1,144
- − Management
- −$1,144
- − Depreciation
- −$2,179
- Taxable income
- $3,472
- Est. tax owed @ 24.0%
- −$833
- After-tax cash flow
- $3,585/yr
For passive investors: Depreciation is non-cash, so a rental often shows a tax loss while cash-flowing — sheltering income. Rental losses are passive: they offset passive income freely, and up to $25,000/yr can offset ordinary (W-2) income if you actively participate and your MAGI is under $100k (phasing out to $0 by $150k); unused losses carry forward. On sale, claimed depreciation is recaptured at up to 25%, and gains may owe capital-gains tax (a 1031 exchange can defer both). Figures are a year-1 estimate at your 24.0% rate — not tax advice; consult a CPA.
Schools (NCES district)
- District
- Fairfield City
- NCES district ID
- 0101440
- Math proficiency
- 2% ▼ -18.00%
- Reading proficiency
- 15% ▼ -4.00%
- Median HH income
- $35,288
- Composite
- 6.92/100
- National rank
- #9974
- State rank
- #125 of 129 in AL
Livability — Fairfield
- Score
- 64/100
- State rank
- #160
- US rank
- #14390
Category grades
Schools grade is shown separately in the Schools card above.
Census & demographics
- Census place
- Fairfield, AL
- County
- Jefferson County · 527,445 people
- City population
- 9,872
- Metro
- Birmingham-Hoover, AL
- Population (ZIP)
- 9,872
- Household income
- $48,692
- Rent vs Own
- Severe rent burden
- 784.0
Population outlook (Jefferson County) Hauer SSP2
- Today (2025)
- 669,185 people
- By 2030
- 669,694 · +0.1%
- By 2040
- 661,388 · -1.2%
- By 2050
- 643,086 · -3.9%
- By 2075
- 577,267 · -13.7%
- By 2100
- 474,758 · -29.1%
Race, ethnicity, and origin ACS 2023
- Neighborhood character
- Predominantly Black (91%)
- Race & ethnicity
- Black 91% White 7% Two or more races 2%
- Foreign-born
- 1% · Canada
- Languages at home
- 99% English-only · Spanish 1%
Political lean MEDSL · Jefferson
- 2024 margin
- D (+10.4) · D 54.6% · R 44.2% · Other 1.2%
- 2008→2024 swing
- +5.4pp toward D · 2008: 5.1pp · 2024: 10.4pp
- All cycles
- 2024: D+10.4 2020: D+13.2 2016: D+7.2 2012: D+6.0 2008: D+5.1
Not yet ingested
- Civics
- —
Market trends
- HPI YoY
- ▼ -50.47%
- Current HPI
- 124.7012
- Rent YoY
- —
- Metro
- Birmingham-Hoover, AL
- State GDP YoY
- ▲ 2.94%
- F500 in state
- 4
Industry mix (Fortune 500 HQ in AL)
| Industry | F500 HQs | Revenue |
|---|---|---|
| Financial Services | 1 | $8B |
|
||
| Healthcare | 1 | $5B |
|
||
Price history
+88.7% since first listed6 events — show timeline
- 2026-04-22 Listed $74,900 Greater Alabama MLS
- 2025-12-19 Sold (Public Records) $951,400 Public Records
- 2022-02-24 Price Changed $825 RENT.
- 2018-10-25 Sold (Public Records) $33,500 Public Records
- 2017-07-21 Price Changed $29,900 Greater Alabama MLS
- 1989-04-26 Sold (Public Records) $39,700 Public Records
Property tax history
+9.7%/yrLatest (2025): $1,787 · +0.0% YoY. Source: county tax records.
Cash-flow waterfall
monthlySold comps — $/sqft
last 12 mo · ≤1 miLoading sold comps…