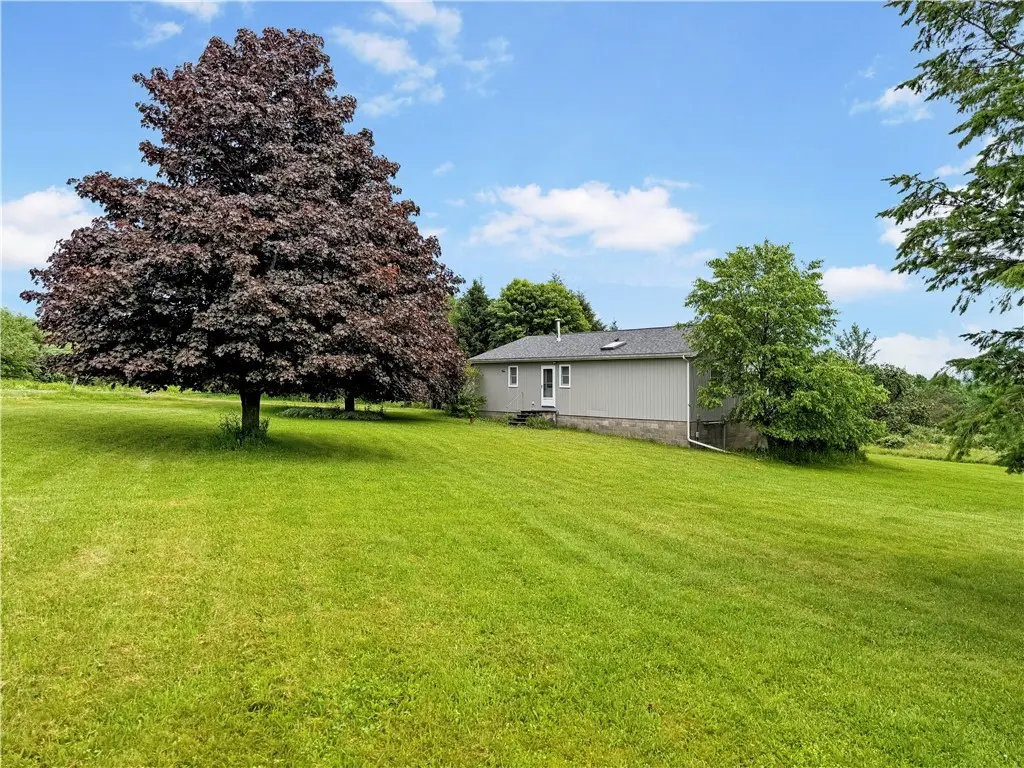
2179 Williams Rd · Elkland, PA
Flood risk 1/10 · Minimal
- FEMA flood zone
- X
- Chance of flooding over 30 yrs
- 0.0%
- Est. flood insurance / yr
- $507 – $1,088
Fire risk 4/10 · Minor
- Est. fire insurance / yr
- $691 – $1,283
Heat risk 2/10 · Minimal
- Hot days now (above 92°F)
- 7 days/yr
- Hot days in 30 yrs
- 15 days/yr
Wind risk 1/10 · Minimal
- Chance of severe wind over 30 yrs
- —
Air-quality risk 1/10 · Minimal
- Unhealthy air days now
- 0 days/yr
- Unhealthy air days in 30 yrs
- 0 days/yr
Risk factors via First Street. Map © Google.
Why this score? — see what drove the B- grade
The composite is a weighted blend of 9 inputs, each scored 0–100. Each bar is that input's sub-score; the figure is the points it added to the 100-point composite (weight × sub-score).
- Cash flow +23.1/30.0
- Appreciation +10.0/10.0
- ARV discount +7.5/15.0
- DSCR +7.4/10.0
- 1% rule +5.4/10.0
- Schools +5.1/10.0
- Livability +3.2/5.0
- Rent growth +2.5/5.0
- Condition / age +2.5/5.0
$185,000
🖨 Deal sheet (PDF) 📄 Offer letter ✓ Due diligence
Listing remarks MLS
BEAUTIFUL VIEW WITH 6 ACRES. POND. NEW ROOF 2000 . FRESHLY PAINTED INSIDE. . HOT WATER BASEBOARD HEAT. CARPORT.
Key facts
- Own pond
- Open space
- Plenty of storage
Tags
Property features AI
Exterior
- Parking: Carport
- Utilities: Well water; Septic tank
- Home design: Single-story home; Existing construction
- Construction: Vinyl siding; Attic/crawl hatchway(s) insulated; Block and slab foundation; Asphalt roof
- Exterior features: Deck; Open porch; Gravel driveway; Leased propane tank; Secluded, rural and irregular lot
Interior
- Kitchen: Electric cooktop; Refrigerator
- Bedrooms: Three main-level bedrooms
- Flooring: Carpet; Ceramic tile; Hardwood; Varied flooring
- Bathrooms: Two full bathrooms (both on the main level)
- Heating & cooling: Gas heating; Baseboard heat; Window and wall cooling units
- Interior features: Eat-in kitchen; Separate/formal living room; Pantry; Bedroom on main level; Main level primary
- Laundry & utility: Main-level laundry; Washer; Dryer; Gas water heater
Neighborhood map
What this means for you Summary
Snapshot
- This is a 3-bed/1.0-bath single-family listed at $185k.
Deal economics
- At list price, monthly cash flow is $332 ($4k/yr) — positive.
- The deal already cash-flows at list — no discount required.
- Meets the 1% rule at list price ($2k rent vs $185k).
Location & tenants
- Location reads 65/100 on livability (#1,171 in PA) — a middle-class / working-renter tenant base. Strengths: cost of living A+, housing A+, health & safety A+; Watch: amenities F, commute F.
- Jasper-Troupsburg Central School District (rural): math 61% / reading 56% proficiency, ranked #319 of 755 in NY (top 42%) — acceptable for families but not a draw, mixed tenant base, ~2y average lease.
- Zoned schools: Jasper-Troupsburg Elementary School (math 62% / reading 57%, grade B-, #745 of 2,108 statewide, top 39%, 213 students, 57% FRL); Jasper-Troupsburg Junior-Senior High School (math 67% / reading 64%, grade B, #766 of 1,100 statewide, top 70%, 158 students, 52% FRL).
- Market conditions: 196 units permitted in Steuben County in 2024 (0 in 5+ unit buildings).
Forward outlook
- In year one you build about $20k of equity ($1k loan paydown + $18k appreciation (10.0% local appreciation)).
- Steuben County population projected at -20% by 2050 — secular population decline; favor cash flow + early exit over multi-decade hold.
- At projected returns (10.0% appreciation + 3.0% rent growth), your $52k cash investment doubles in ~3 years — after that, you're playing with house money.
- By year 2, paydown + projected appreciation supports a ~$32k cash-out refi (75% LTV) — recoverable capital for the next deal without selling this one.
Negotiation context
- Only 6 days on market — expect competitive offers; lowballing is unlikely to land.
- 3 sale attempts since 26y ago with the ask held roughly flat each time — persistent listings suggest the price (not the market) is what's stuck; bring a comps-based counter.
- Current owner paid $67k; list at $185k implies a 177% gain — meaningful room to come down on a strong offer.
Questions for the listing agent
- Built in 1966 — when were the roof, HVAC, electrical panel, plumbing, and water heater last replaced?
- Is there a deadline driving the sale (1031 exchange, divorce, estate, relocation)? That informs how much negotiation room exists.
- Schools are D-rated, which usually means shorter tenancies and higher turnover. Who's the typical renter profile here, and what's been the actual vacancy rate?
- What's the average days-on-market for RENTAL listings here right now (not sales)? A rising rental-DOM trend means longer vacancies and softer asking-rent achievability than the comps imply.
- What's the recent tenant-quality profile in this submarket — average credit score on applications, eviction rate, late-payment / NSF rate, and stable-employment percentage? A property-management company in the area should have these aggregated.
- How much new for-sale + rental construction is in the pipeline within 1–3 miles? Heavy new supply typically softens prices + rents 12–24 months out; constrained supply supports both.
Investment metrics
- 1% rule
- 1.04% ✓
- Cap rate
- 8.45%
- Cash-on-cash
- 7.69%
- DSCR
- 1.34
- GRM
- 8.0
CMA / ARV
No comps found within radius.
Projected returns pro-forma
10.0% appreciation · 3.0% rent growth · sell at horizon
- IRR
- 29.9%
- Equity multiple
- 3.35×
- Total profit
- $121,873
- Equity at exit
- $166,663
- IRR
- 25.9%
- Equity multiple
- 7.61×
- Total profit
- $342,226
- Equity at exit
- $359,414
Cash invested: $51,800 (down + closing). Projections, not guarantees.
Landlord ↔ Tenant lean methodology
- Overall (STATE)
- 62 Landlord-Friendly
- State Pennsylvania
- 62 Landlord-Friendly · EVEN
- County
- — inherits STATE
- City
- — inherits STATE
ZIP-level market 14801
- Home prices YoY
- 3.3%
- Price-to-rent
- 8.0×
Monthly cashflow live
- Estimated rent
- $1,931 medium interval (Pro) →
- Mortgage (P&I)
- −$970
- Tax from tax record
- −$146 /mo · $1,752/yr
- Insurance
- −$77
- HOA
- −$0
- Lot rent
- −$0
- Vacancy / Maint / Mgmt
- −$405
- Net cashflow
- $332
Break-even live
Sensitivity live
| Price | -10% $437 | -5% $384 | +0% $332 | +5% $280 | +10% $227 |
|---|---|---|---|---|---|
| Rent | -10% $179 | -5% $256 | +0% $332 | +5% $408 | +10% $484 |
| Rate | -1.0pp $425 | -0.5pp $379 | base $332 | +0.5pp $284 | +1.0pp $235 |
UW: 25.0% down · 7.5% · 30yr · 1.5% tax · 5.0% vac · 8.0% maint · 8.0% mgmt
Financing live
Cash to close
- Down payment
- $46,250
- Closing costs
- $5,550
- Reserves months
- —
- Total cash needed
- —
Loan-product check · same deal, 3 products live
Conventional
25% down · 7.5% · 30yr
- Down + closing
- —
- Monthly P&I
- —
- Monthly cashflow
- —
- DSCR
- —
- Eligible?
- —
Personal DTI + credit; lowest rate.
DSCR
20% down · 8.5% · 30yr
- Down + closing
- —
- Monthly P&I
- —
- Monthly cashflow
- —
- DSCR
- —
- Eligible?
- —
No personal income docs; deal must DSCR.
Hard money
10% down · 12.0% · 12mo
- Down + closing
- —
- Monthly P&I
- —
- Monthly cashflow
- —
- DSCR
- —
- Eligible?
- —
Short-term bridge; refi at stabilization.
Listing history 6 events
-
2026-06-22days on market $185,000 Active 6 DOM
-
2026-06-21days on market $185,000 Active 5 DOM
-
2026-06-21days on market $185,000 Active 4 DOM
-
2026-06-18days on market $185,000 Active 2 DOM
-
2026-06-17remarks 687-char remark
-
2026-06-17$185,000 Active 1 DOM
ⓘ Source: listings_history table (triggers on properties + properties_extension) + one-shot
backfill from property_details.listing_events for pre-trigger history.
Tax reassessment forecast PA · Partial reset (capped growth)
- Current annual tax
- $1,752 · $146/mo
- Projected year-2 tax
- $2,338 · $195/mo
- Expected delta
- +$585/yr (+$49/mo · 33.4%)
ⓘ Screening estimate from a state-policy table — verify with the county assessor before closing.
Climate risk First Street
- Flood 1/10 Low FEMA zone X · 0% chance over 30 yrs
- Wildfire 4/10 Moderate
- Heat 2/10 Low 7 d/yr ≥92°F today · 15 d/yr by 30 yrs out
- Wind 1/10 Low
- Air quality 1/10 Low 0 unhealthy d/yr today · 0 by 30 yrs out
Nearby sold comps map
Loading sold comps map…
Walkable amenities ~0.75 mi
Loading nearby amenities…
Taxation est. · year 1
- Rental income
- $23,168
- − Mortgage interest
- −$10,363
- − Property taxes
- −$1,752
- − Insurance
- −$925
- − Repairs & maintenance
- −$1,853
- − Management
- −$1,853
- − Depreciation
- −$5,382
- Taxable income
- $1,039
- Est. tax owed @ 24.0%
- −$249
- After-tax cash flow
- $3,734/yr
For passive investors: Depreciation is non-cash, so a rental often shows a tax loss while cash-flowing — sheltering income. Rental losses are passive: they offset passive income freely, and up to $25,000/yr can offset ordinary (W-2) income if you actively participate and your MAGI is under $100k (phasing out to $0 by $150k); unused losses carry forward. On sale, claimed depreciation is recaptured at up to 25%, and gains may owe capital-gains tax (a 1031 exchange can defer both). Figures are a year-1 estimate at your 24.0% rate — not tax advice; consult a CPA.
Schools (NCES district)
- District
- Jasper-Troupsburg Central School District
- NCES district ID
- 3600007
- Math proficiency
- 61% ▲ 9.00%
- Reading proficiency
- 56% ▲ 8.00%
- Median HH income
- $41,266
- Composite
- 50.68/100
- National rank
- #3935
- State rank
- #319 of 755 in NY
Livability — Elkland
- Score
- 65/100
- State rank
- #1171
- US rank
- #13602
Category grades
Schools grade is shown separately in the Schools card above.
Census & demographics
- Population (ZIP)
- 5,415
Population outlook (Steuben County) Hauer SSP2
- Today (2025)
- 93,062 people
- By 2030
- 89,793 · -3.5%
- By 2040
- 82,353 · -11.5%
- By 2050
- 74,286 · -20.2%
- By 2075
- 55,589 · -40.3%
- By 2100
- 37,587 · -59.6%
Race, ethnicity, and origin ACS 2023
- Neighborhood character
- Predominantly White (96%)
- Race & ethnicity
- White 96% Two or more races 3% Hispanic / Latino 1%
- Common ancestry
- Romanian 3% Polish 2% Iranian 2%
- Foreign-born
- 1%
- Languages at home
- 91% English-only · German/W. Germanic 8%
Political lean MEDSL · Steuben
- 2024 margin
- Solid R (+31.8) · D 34.1% · R 65.9%
- 2008→2024 swing
- -15.0pp toward R · 2008: -16.8pp · 2024: -31.8pp
- All cycles
- 2024: R+31.8 2020: R+29.6 2016: R+36.2 2012: R+16.4 2008: R+16.8
Not yet ingested
- Civics
- —
Market trends
- HPI YoY
- ▲ 10.75%
- Current HPI
- 332.2296
- Rent YoY
- —
- Metro
- —
- State GDP YoY
- ▲ 1.68%
- F500 in state
- 34
Industry mix (Fortune 500 HQ in PA)
| Industry | F500 HQs | Revenue |
|---|---|---|
| Healthcare | 2 | $309B |
|
||
| Insurance | 2 | $27B |
|
||
| Telecommunications / Media | 1 | $124B |
|
||
| Industrial Distribution | 1 | $22B |
|
||
| Financial Services | 1 | $20B |
|
||
| Chemicals / Materials | 1 | $18B |
|
||
Price history
+193.7% since first listed7 events — show timeline
- 2026-06-16 Listed $185,000 UNYREIS
- 2002-06-17 Sold (Public Records) $66,900 Public Records
- 2002-06-07 Sold (MLS) $66,900 UNYREIS
- 2002-03-13 Listed $69,900 UNYREIS
- 2001-03-29 Sold (Public Records) $61,000 Public Records
- 2001-03-27 Sold (MLS) $61,000 UNYREIS
- 2000-09-05 Listed $63,000 UNYREIS
Property tax history
-5.0%/yrLatest (2025): $1,752 · +4.7% YoY. Source: county tax records.
Cash-flow waterfall
monthlySold comps — $/sqft
last 12 mo · ≤1 miLoading sold comps…